

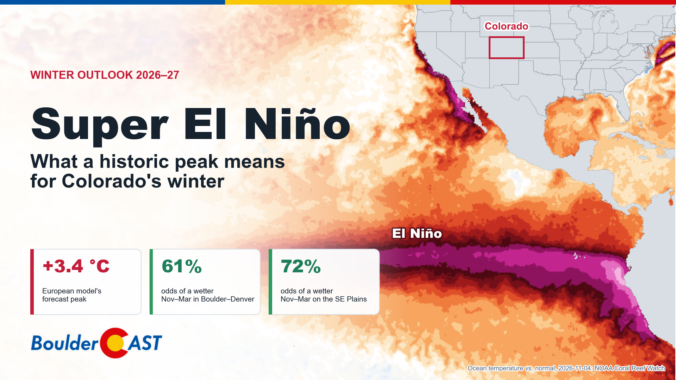
The tropical Pacific Ocean off the coast of South America is running more than 10 degrees warmer than normal, and this historic El Niño is still strengthening. That raises the question everyone in Colorado is asking: does a super El Niño guarantee a snowy winter? To find out, we dug into the latest forecasts from 10 seasonal climate models, analyzed 131 years of Colorado weather records, and graded how well those models have performed here in the past. The official BoulderCAST winter outlook brings encouraging news for some parts of the state, especially along the Front Range and eastern plains. But for skiers hoping for a blockbuster season in the nearby mountains, the outlook is more complicated and more worrying. And we may have to wait several more months before winter actually shows up.
What You Need to Know
- 🌡️ El Niño keeps strengthening. NOAA’s Relative Oceanic Niño Index jumped to +1.97 °C for August–October, the strongest reading since early 2016. It’s still climbing.
- 📈 The European seasonal model peaks the event around +3.4 °C in December–January. That would beat every El Niño on record since 1950, including 1982–83, 1997–98 and 2015–16.
- 🌊 Out West, the signal is loud: an exceptionally wet winter is favored for California and the Desert Southwest, while the northern Rockies lean dry.
- 🏔️ For Colorado, the models split the state. The plains and the San Juans lean wet, the northern and central mountains don’t, and Boulder and Denver sit right on the line. The wettest-looking forecast for us is late winter into early spring, and that happens to be where the models have their best track record here.
- ❄️ History says strong El Niño winters in Boulder specifically are feast or famine for snowfall, with almost nothing in between.

Go Premium, get all the perks.
Daily Forecast Updates
Get our daily forecast discussion every morning delivered to your inbox.
All Our Model Data
Access to all our Colorado-centric high-resolution weather model graphics. Seriously — every one!
Ski & Hiking Forecasts
6-day forecasts for all the Colorado ski resorts, plus more than 120 hiking trails, including every 14er.
Smoke Forecasts
Wildfire smoke concentration predictions up to 84 hours into the future.
Exclusive Content
Weekend outlooks every Thursday, bonus storm updates, historical data and much more!
No Advertisements
Enjoy ad-free viewing on the entire site.
I
t’s official: we are in the midst of one of the strongest El Niño events ever observed. And the tropical Pacific isn’t done yet. All year we’ve watched this event build, from a lingering La Niña last winter to a rapidly warming equatorial Pacific by late spring. It became a strong El Niño by late summer. It’s now pushing into territory that only a handful of events have ever reached, and it may soon go past all of them.
So what does a potentially record-breaking El Niño mean for Boulder, Denver and the rest of Colorado? Let’s dig into the latest data, the newest seasonal forecasts and what history tells us.
Where El Niño stands right now
Here’s every El Niño and La Niña since 1950, from our Colorado Climate Hub:
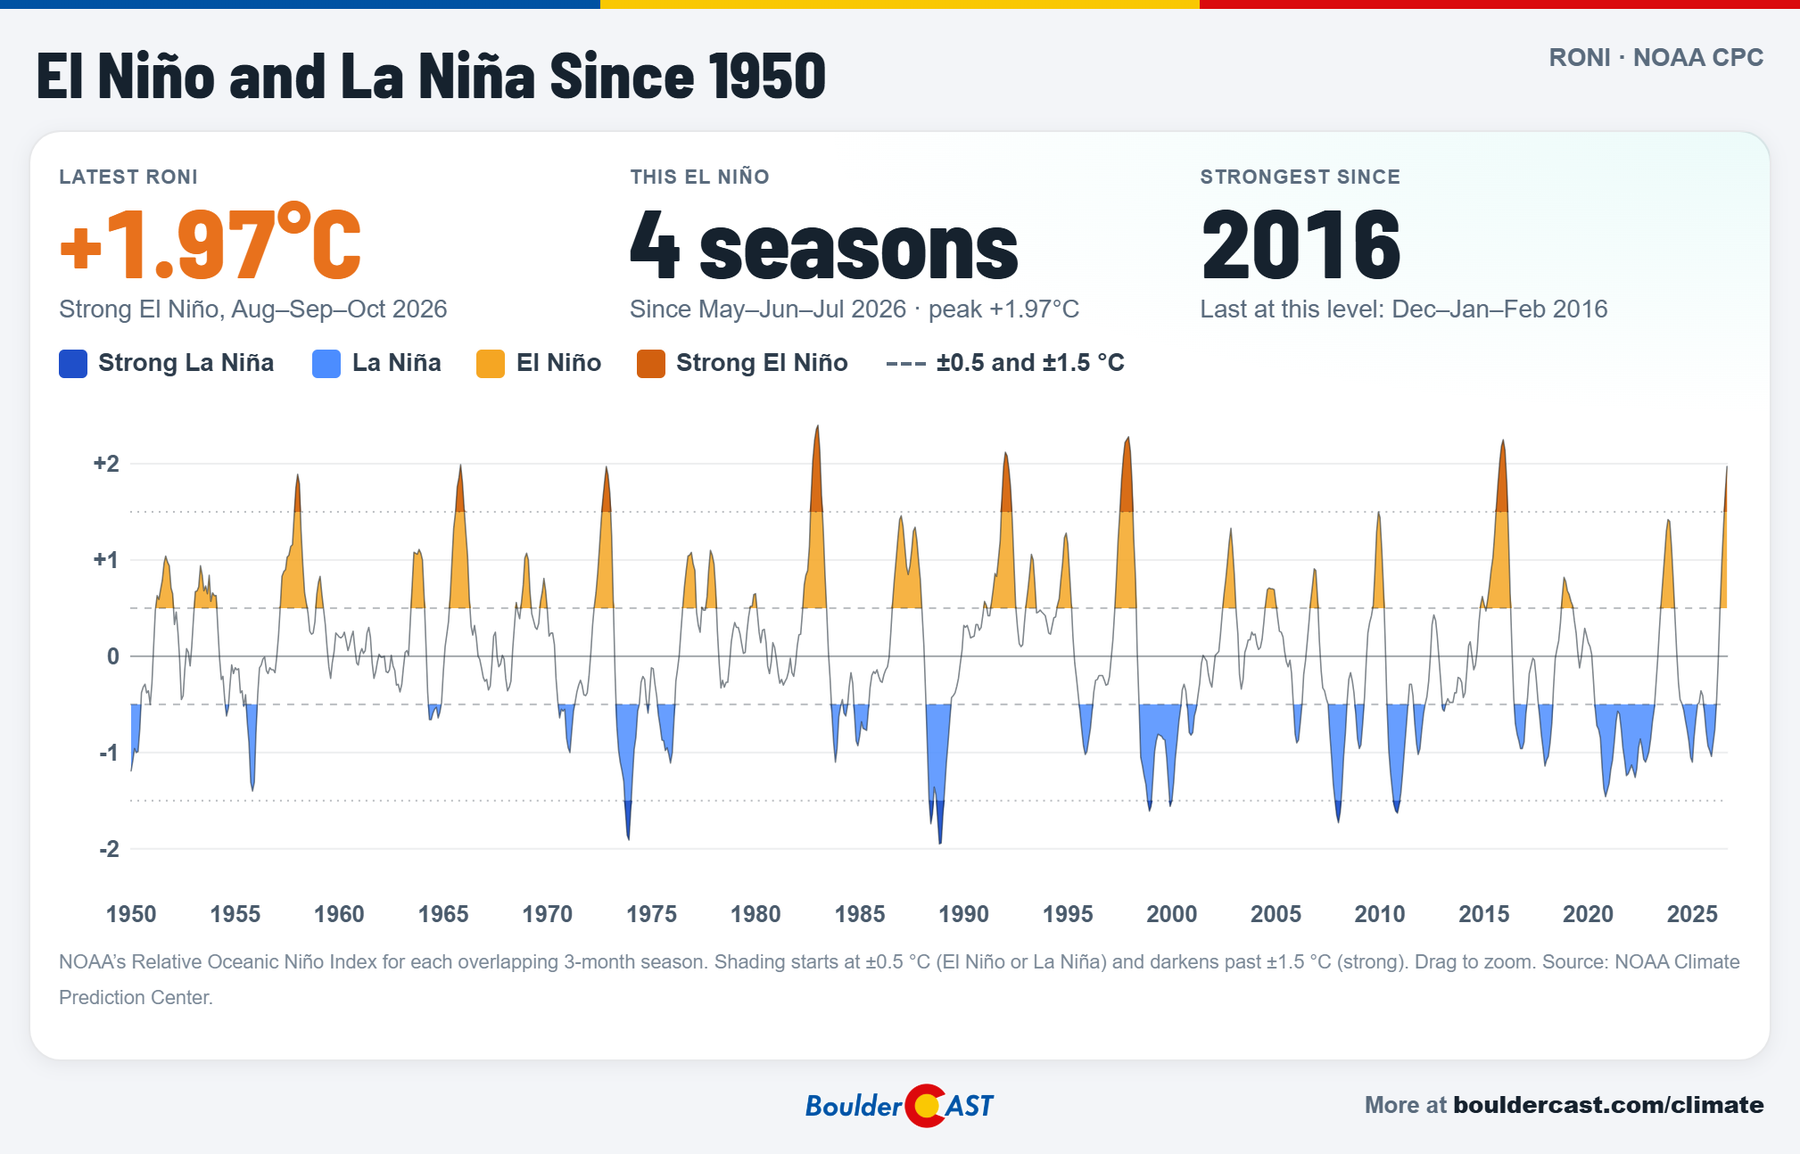
El Niño and La Niña since 1950, NOAA’s Relative Oceanic Niño Index
The newest 3-month value, for August–October 2026, is +1.97 °C. That’s up a full degree in just three months, and it’s the highest reading since the 2015–16 super El Niño. That’s on NOAA’s Relative Oceanic Niño Index (RONI), which is the metric that has quickly become the global standard and what our Climate Hub uses.
A quick word on which index we’re quoting, because it matters a lot this year:
- The traditional Oceanic Niño Index (ONI) measures how warm the Niño 3.4 region of the Pacific is against a fixed 30-year normal. For August–October it’s running +2.46 °C, already in the same league as the biggest events on record.
- The relative index (RONI) subtracts the warming of the entire tropics. The whole planet’s oceans have warmed substantially over the last century, so the old index makes recent El Niños look stronger than they really are compared with past events. RONI corrects for that. It’s the fairer comparison with 1982–83 or 1997–98, and it’s what NOAA now uses to rate strength.
On either index, this is a top-tier event. NOAA’s Climate Prediction Center, in its October 8 discussion, put the odds of a strong-to-very-strong El Niño lasting through January–March at better than 83%. It also gave sizable odds that this becomes a “historic” event, meaning a 3-month RONI of +2.5 °C or more, stronger than any El Niño since 1950: 83% for October–December and 70% for November–January.
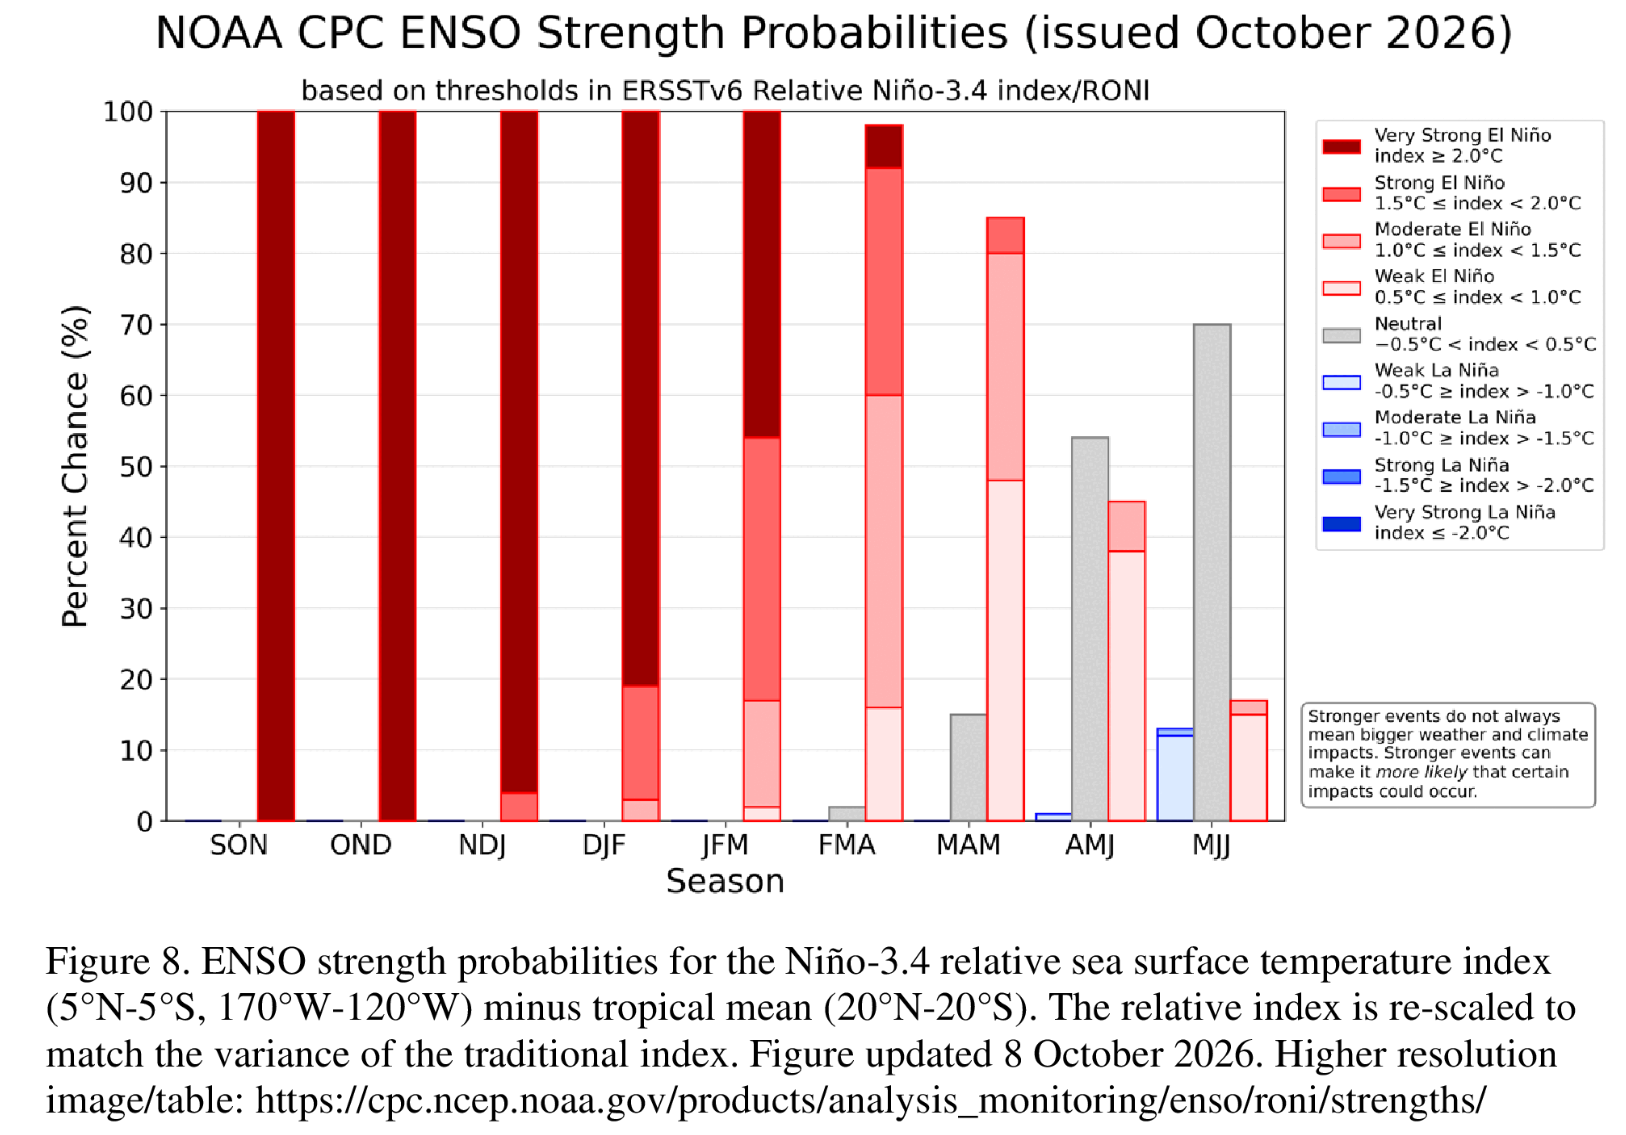
Climate scientist Daniel Swain’s excellent October 12 deep dive at Weather West adds a few points worth highlighting:
- The weekly numbers are already at or past the records. Weekly RONI hit about +2.4 °C in mid-October, statistically tied with the strongest ever measured. The traditional weekly index was far above its previous record.
- This is the most eastern-centered El Niño on record. The warmest water sits unusually far east, toward South America. Research suggests these “east-based” events tend to have the biggest and most reliable effects on West Coast weather.
- More strengthening is likely. A strong burst of westerly winds along the equator was expected to push the event higher still, with a peak most likely in December, give or take a month.
Here’s what that looks like from space. This is NOAA Coral Reef Watch’s satellite map of ocean temperatures compared with normal on November 4, 2026:
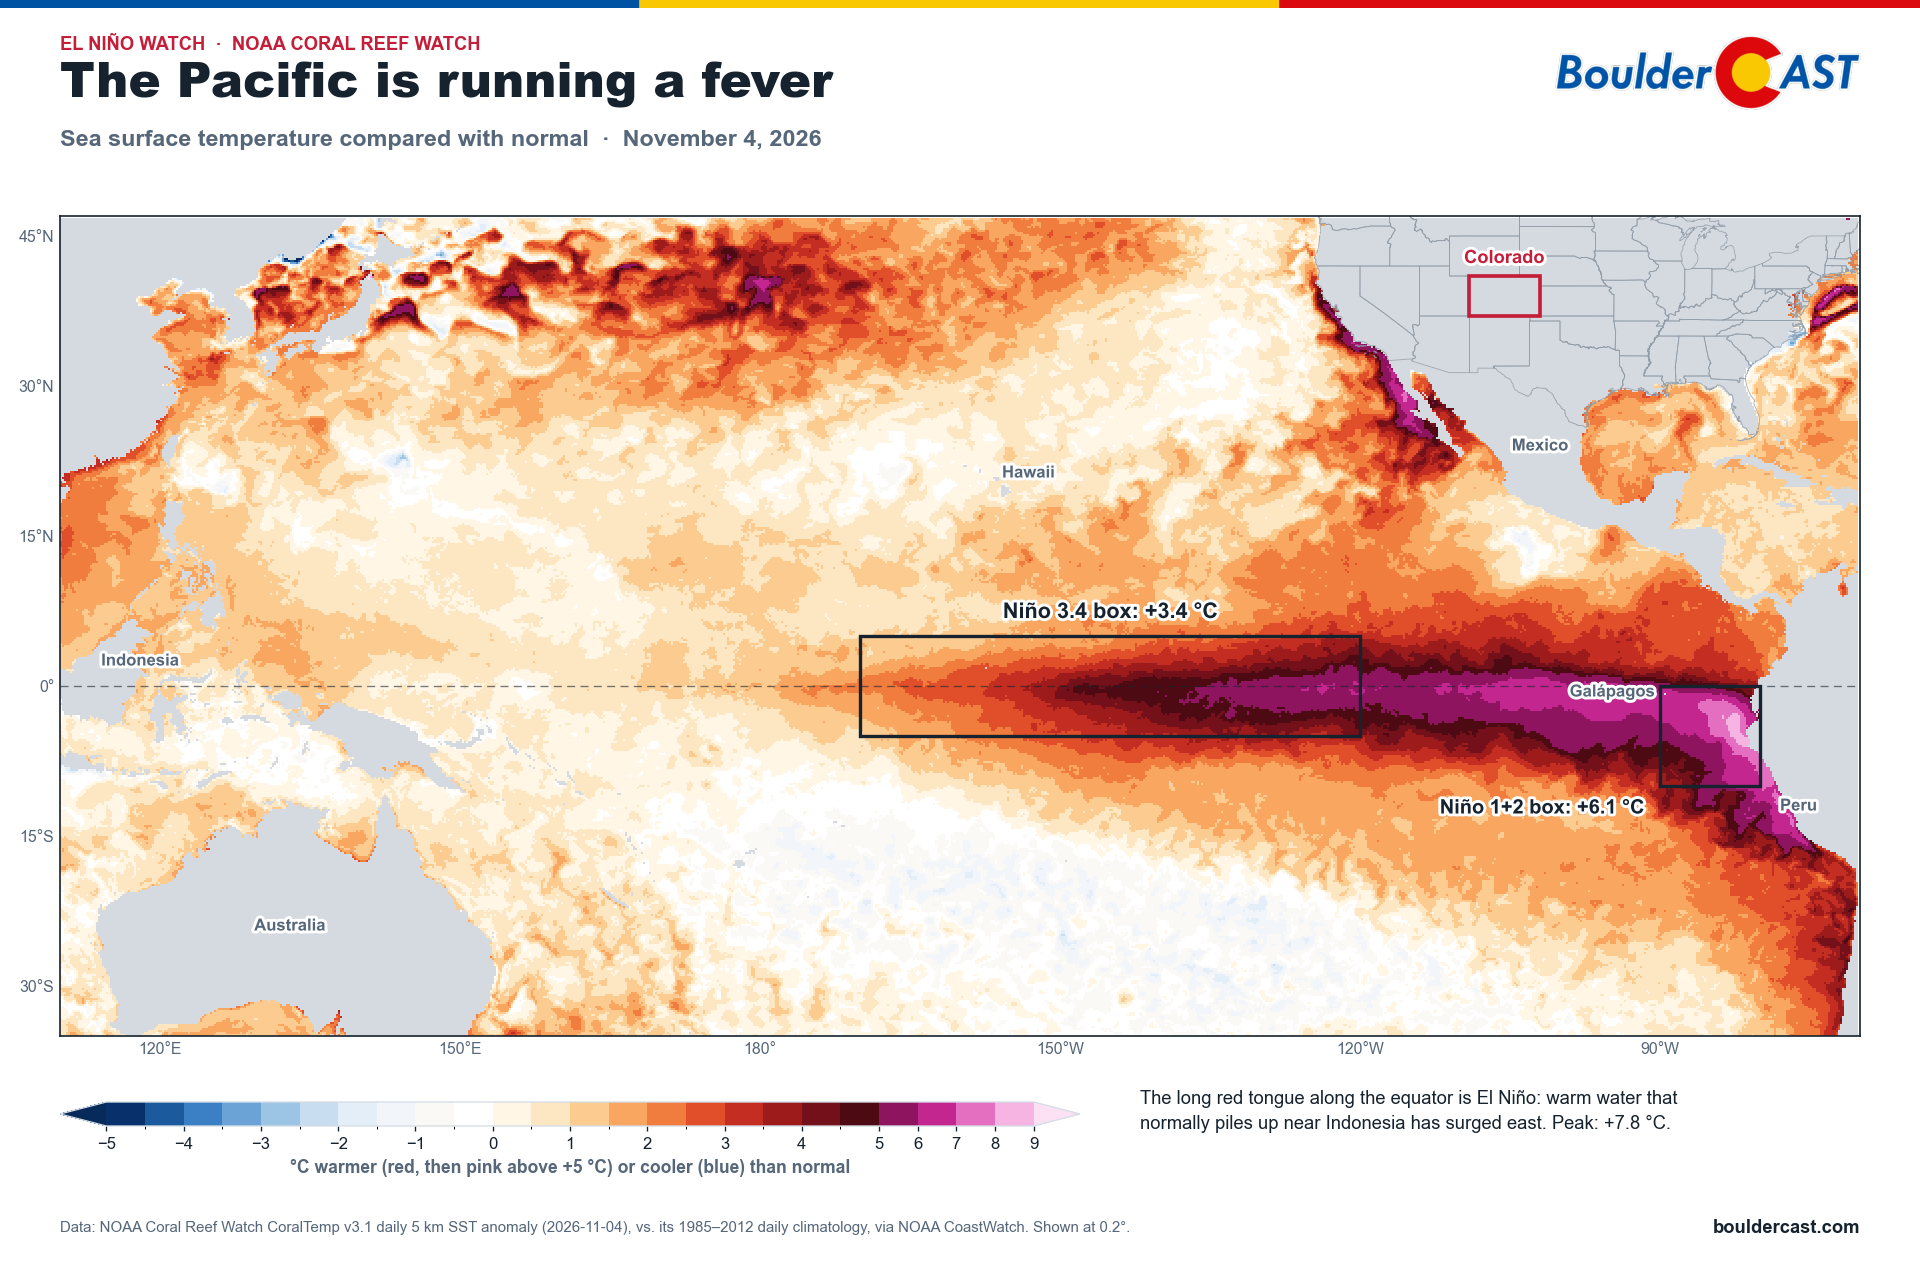
That long red tongue along the equator is El Niño. Warm water that normally piles up near Indonesia has surged east toward South America. The pink shades mark water more than 5 °C (9 °F) warmer than normal. Off the coast of Peru and Ecuador, the ocean is running about 6 °C (11 °F) warmer than normal, with spots near 8 °C. (The warm water hugging the coast of California and Mexico is the marine heatwave we’ll get to below.) Notice that the warmest water hugs South America: that’s the “east-based” pattern Swain describes.
The numbers on this map look bigger than the +1.97 °C above, and that’s expected. This is a single day rather than a 3-month average, and it uses a simpler yardstick that doesn’t subtract the warming of the whole tropics.
How strong will it get?
To answer that, we pulled the brand-new November 1 forecast from the ECMWF SEAS5 model, the European seasonal system, and calculated its Niño 3.4 forecast the same “relative” way NOAA does:
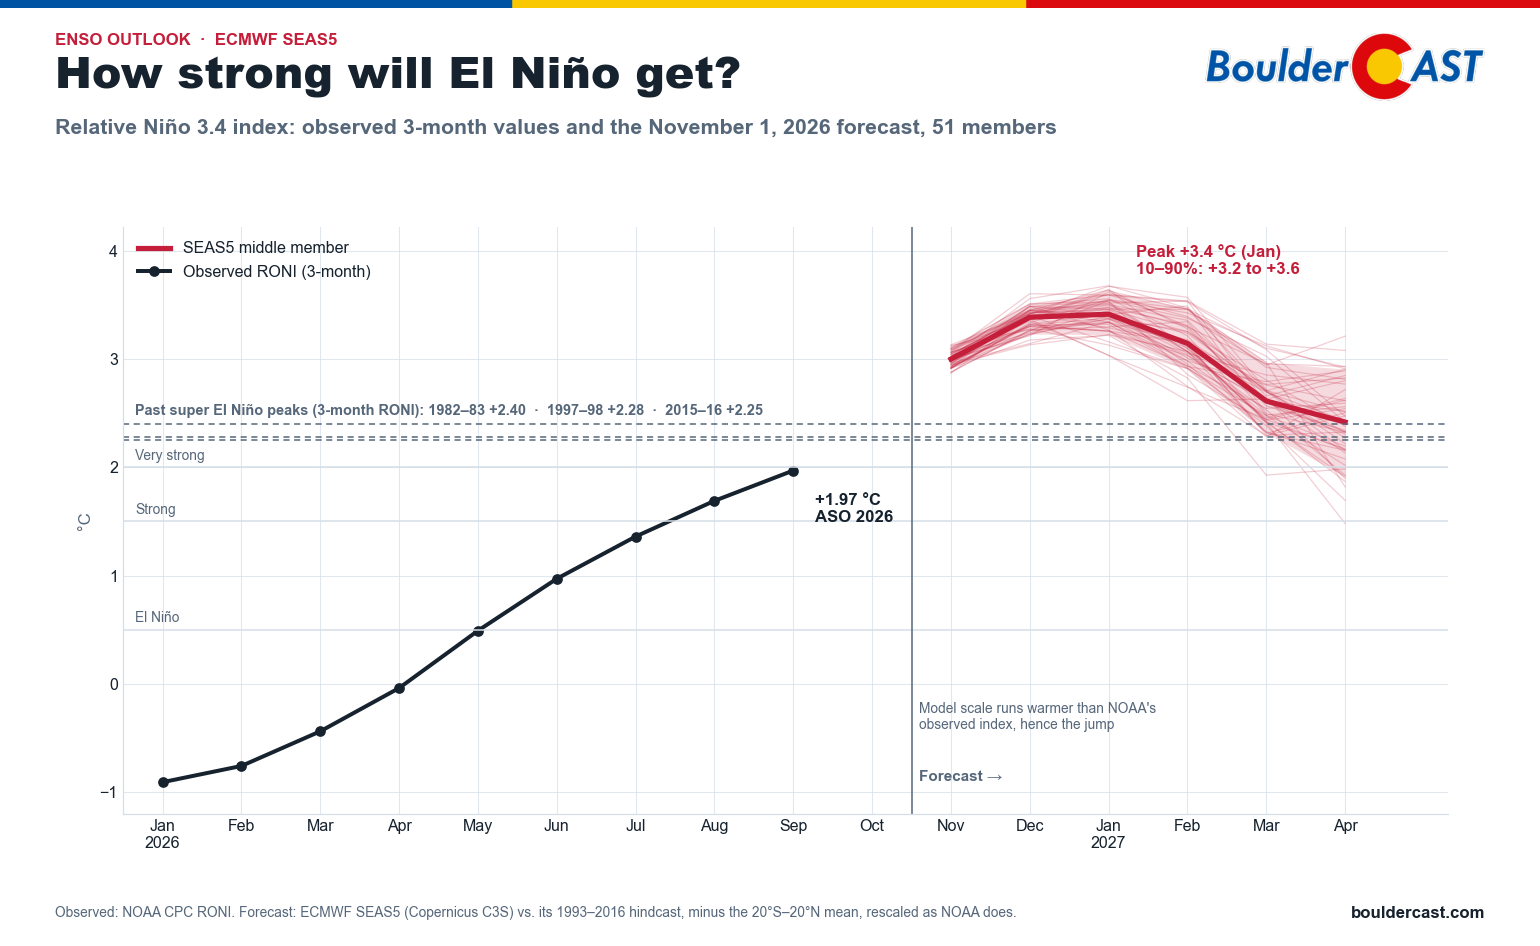
ECMWF SEAS5 forecast of the relative Niño 3.4 index through April 2027
The model’s 51 members are remarkably tightly clustered:
- The peak comes in December–January, with the middle member at about +3.4 °C in both months. Nearly all members land between +3.2 and +3.6 °C.
- For November–January, the 3-month window NOAA uses to rate strength, the middle member works out to +3.3 °C. All 51 members clear NOAA’s +2.5 °C “historic” threshold and beat the 1982–83 record of +2.40 °C, most of them by a wide margin.
- It fades through spring. El Niño weakens to about +2.6 °C by March and +2.4 °C by April. That’s still a very strong event, but clearly past its peak.
A word of caution. Don’t read the model’s numbers too literally. Notice the jump between the last observed value (+1.97 °C) and the first forecast month (+3.0 °C). Part of that is the event strengthening fast, but much of it is a difference in yardsticks. The model measures warmth against its own 1993–2016 climate, which runs warmer than NOAA’s observed index. ECMWF’s own version of this chart shows the same kind of gap. Seasonal models are also known to be overconfident: their members tend to bunch together more tightly than reality does. So the useful message is the comparison, not the exact number: the model has this event well beyond every El Niño since 1950. NOAA’s own odds of a “historic” event (70–83%) are a more honest measure of the uncertainty than the model’s 51 out of 51. Either way, this El Niño is very likely to peak this winter as one of the strongest, if not the strongest, on record.
The West: an El Niño winter for the record books?
When El Niño is this strong, the effects on the West can be dramatic. The warm tropical Pacific energizes and extends the Pacific jet stream, stretching it east and shifting it south toward California. Think of it as holding the storm door open for the southern half of the West, sometimes for weeks at a time.
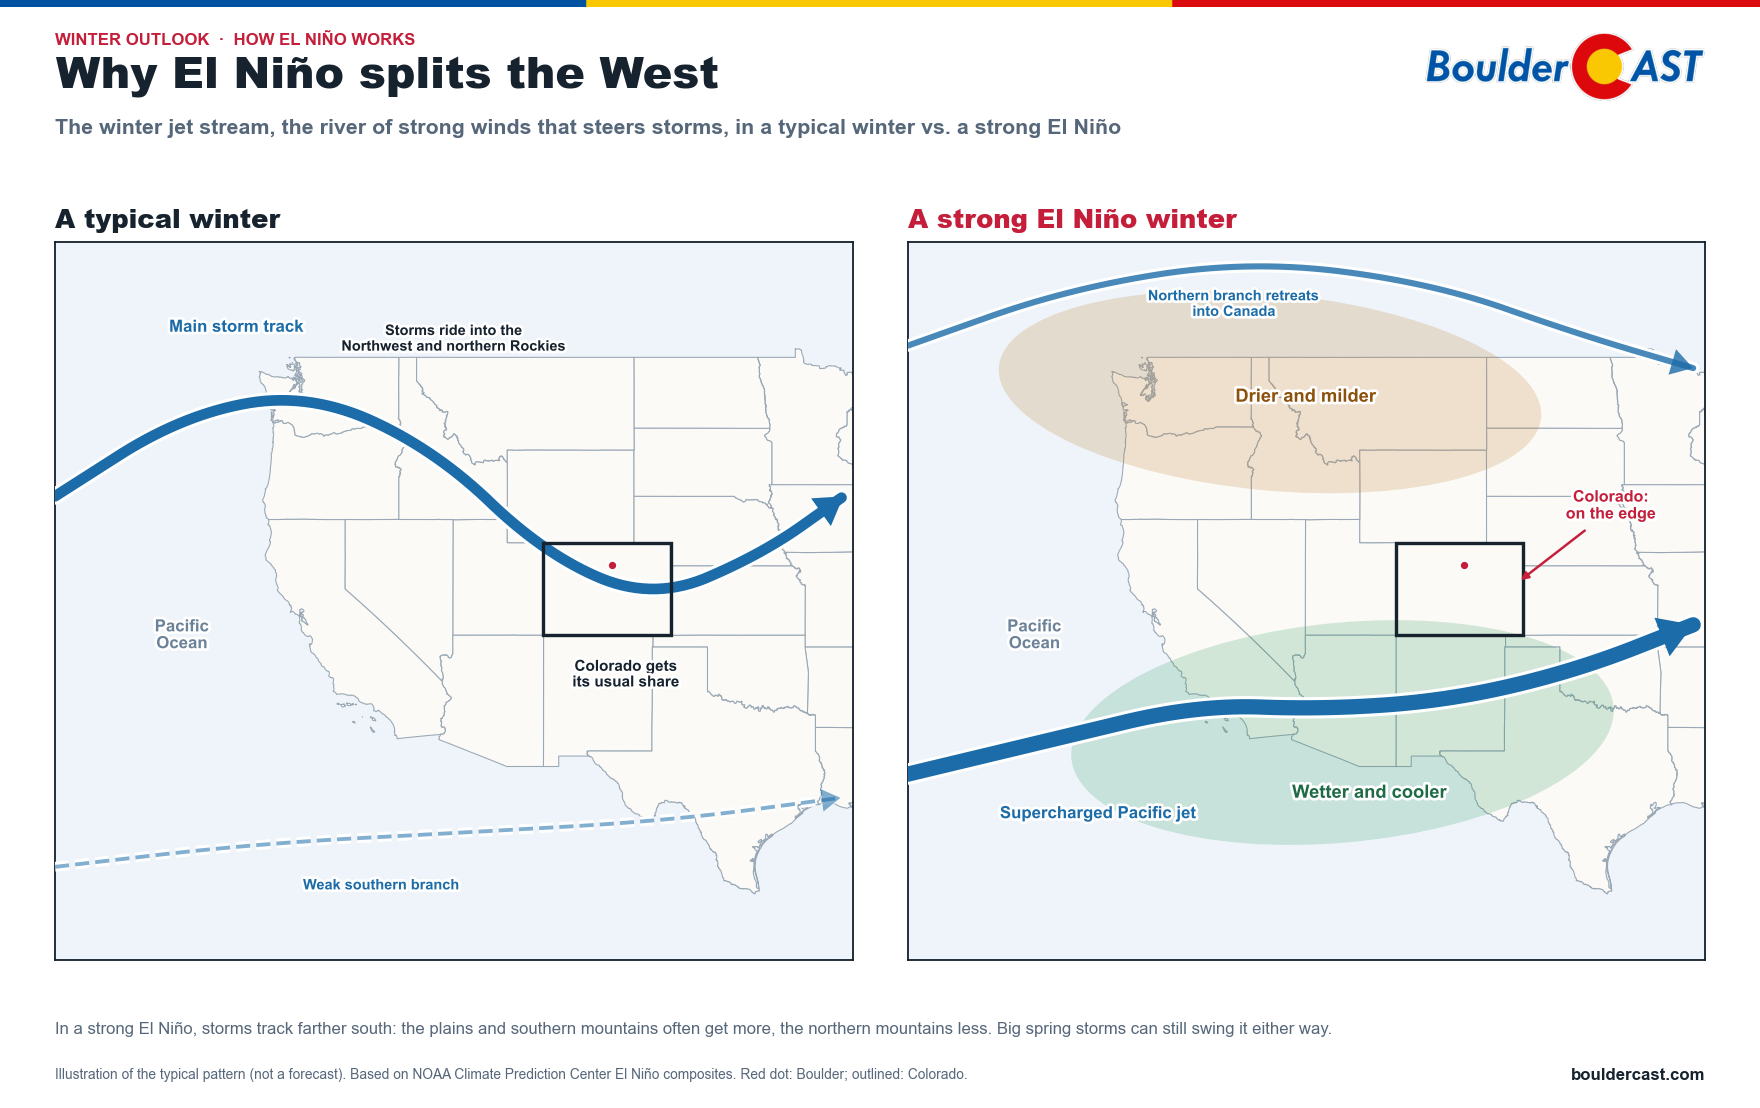
How the winter jet stream typically shifts in a strong El Niño, compared with a typical winter
In a typical winter, the main storm track comes ashore in the Pacific Northwest and dips across the Rockies. In a strong El Niño, that northern branch tends to retreat into Canada while a supercharged southern branch takes over. That leaves the northern tier drier and milder and the Southwest wetter and cooler. Colorado sits right on the edge, which is why our outlook is so split.
Here’s what the ECMWF SEAS5 forecast shows for December–February precipitation:
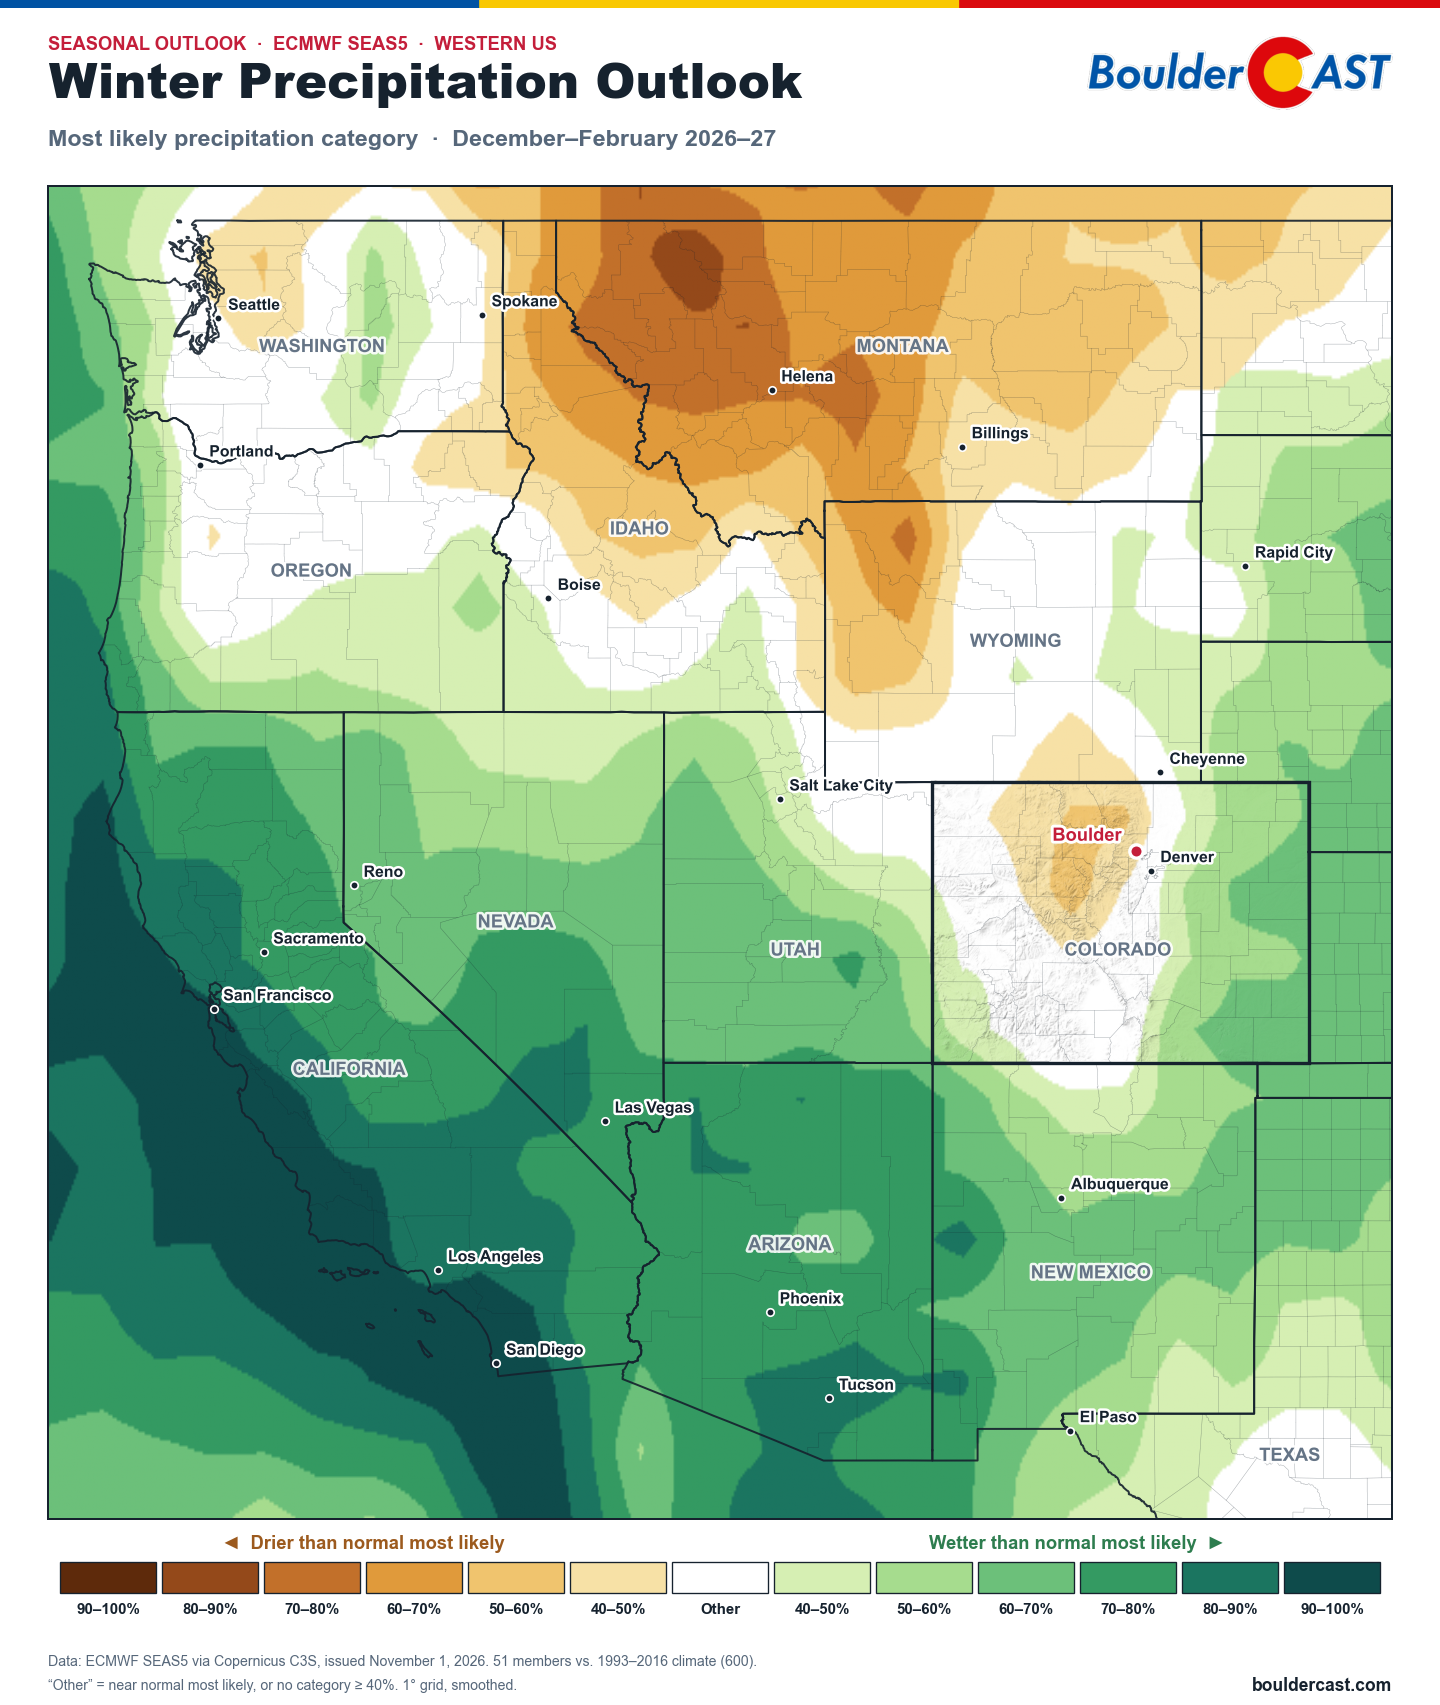
ECMWF SEAS5 most likely precipitation category, December–February, western US
The pattern is classic strong El Niño, turned up to eleven:
- California, Nevada, Arizona and New Mexico are deep in the wet shades. Large areas have 70–100% odds of a wetter-than-normal winter.
- Idaho, Montana and western Wyoming lean dry. The jet stream sags south, and the northern tier gets left out.
- Colorado sits right on the boundary between the two. That’s the story for us, and we’ll come back to it below.
This lines up closely with Swain’s findings for California. Some highlights from his post:
- Statewide odds of a wetter-than-normal winter are above 90%. Southern and central California have the strongest signal.
- Odds of at least one extremely wet month are very high. That means a month above 200% of normal, at roughly 90% for Southern California in the ECMWF ensemble.
- All 10 major seasonal models show a wet California winter. NCEP’s CFSv2 is the driest of the bunch, and the Canadian models are among the wettest.
- The record-warm ocean off the coast is a wildcard. It feeds storms more moisture and raises coastal flooding risk, especially during the winter king tides. It also means many storms will be warm, with high snow levels. We may end up feeling some of these effects here in the Front Range, with some of our would-be snowstorms being a chilly rain instead.
We ran the same comparison ourselves using all 10 models in the European Copernicus (C3S) system. Here’s January–March from each model’s October 1 forecast, along with the 10-model average:
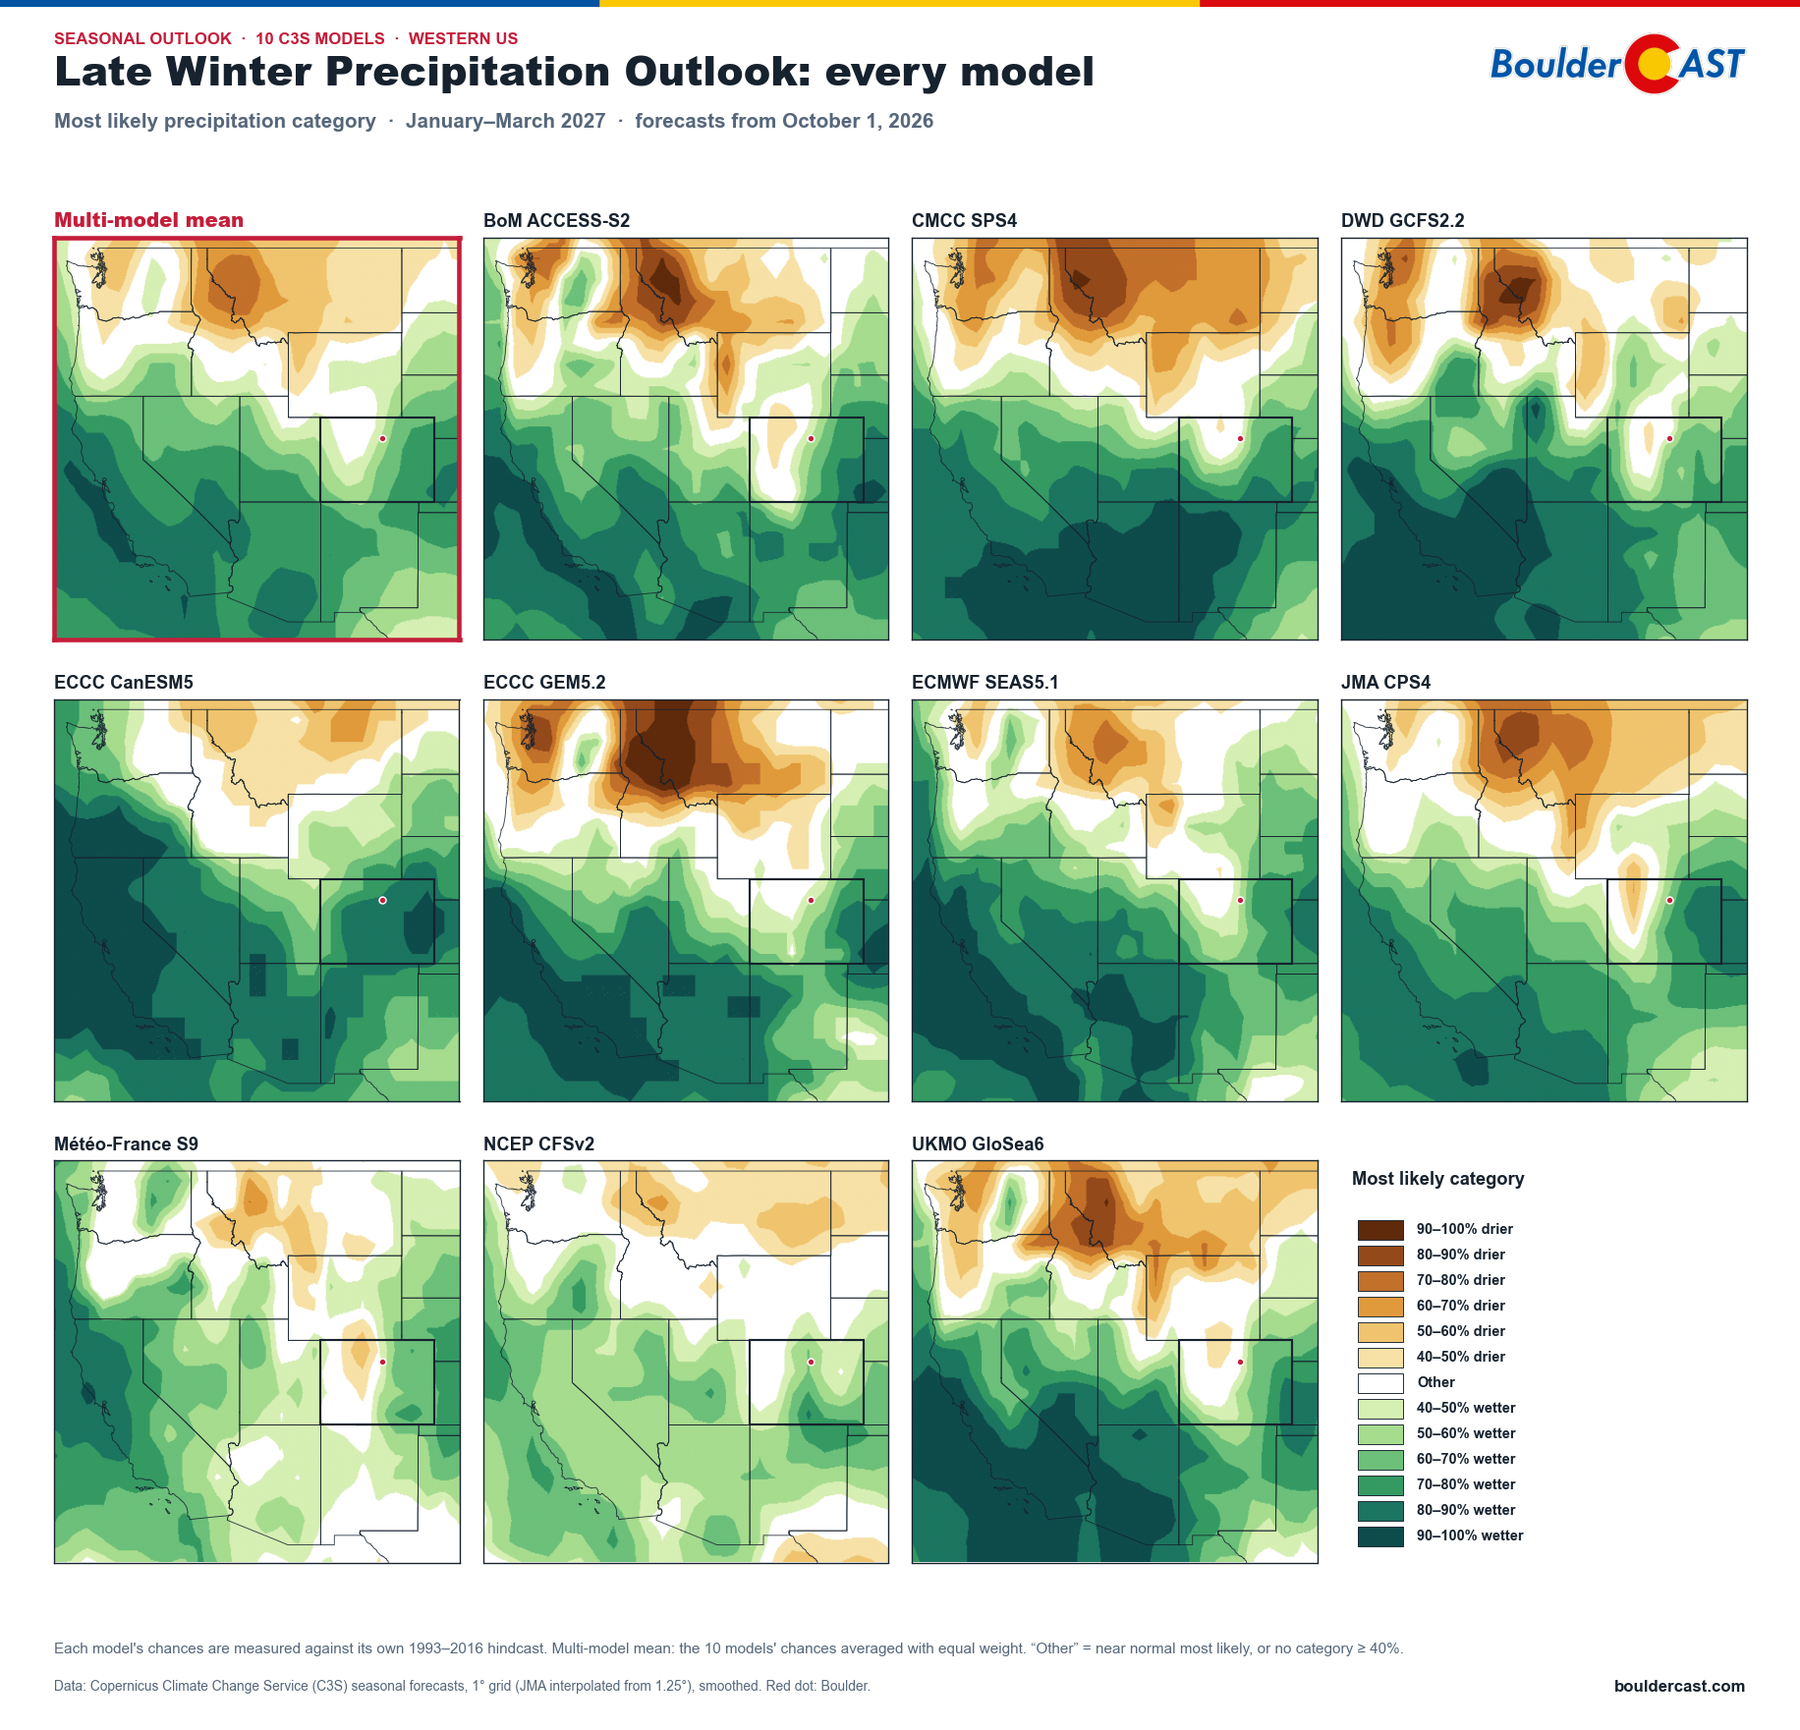
January–March 2027 most likely precipitation category from 10 C3S models and their average
The Southwest is wet in every single model. The dry northern Rockies show up in nearly all of them too. Where they disagree is exactly where we live: how far south that dry zone reaches into Colorado’s mountains. Some models are more aggressively south than others.
Temperature: warm north, cool south
On the temperature side, the December–February outlook is a near-mirror image:
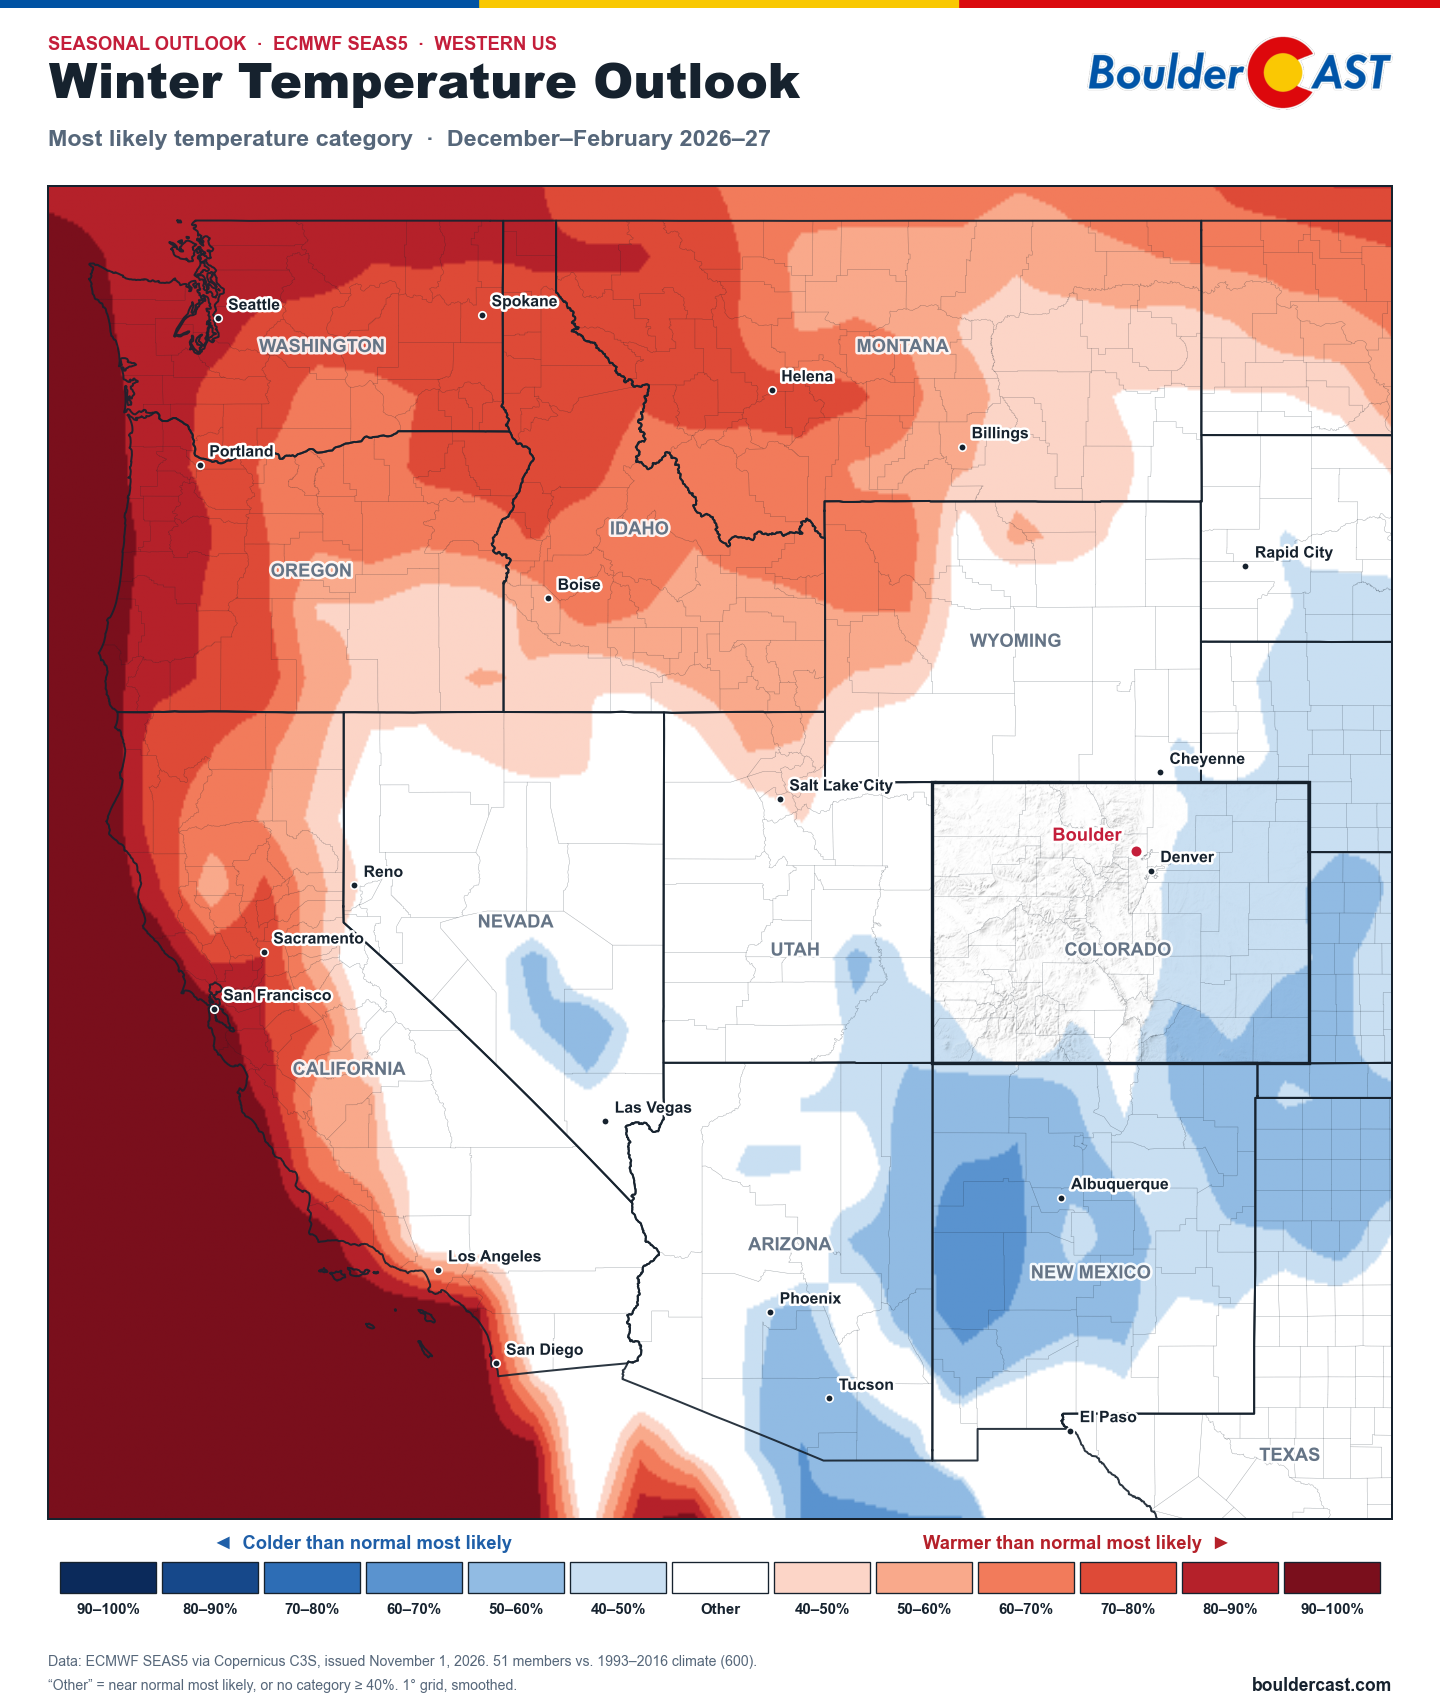
ECMWF SEAS5 most likely temperature category, December–February, western US
The Pacific Northwest, the northern Rockies and especially coastal California lean warmer. The coastal warmth comes largely from that extreme marine heatwave sitting just offshore. Meanwhile New Mexico, southern Arizona and southeast Colorado lean cooler, under a stormier, cloudier pattern.
Colorado: a state divided
Zooming in on Colorado, here’s the SEAS5 outlook for December–February:
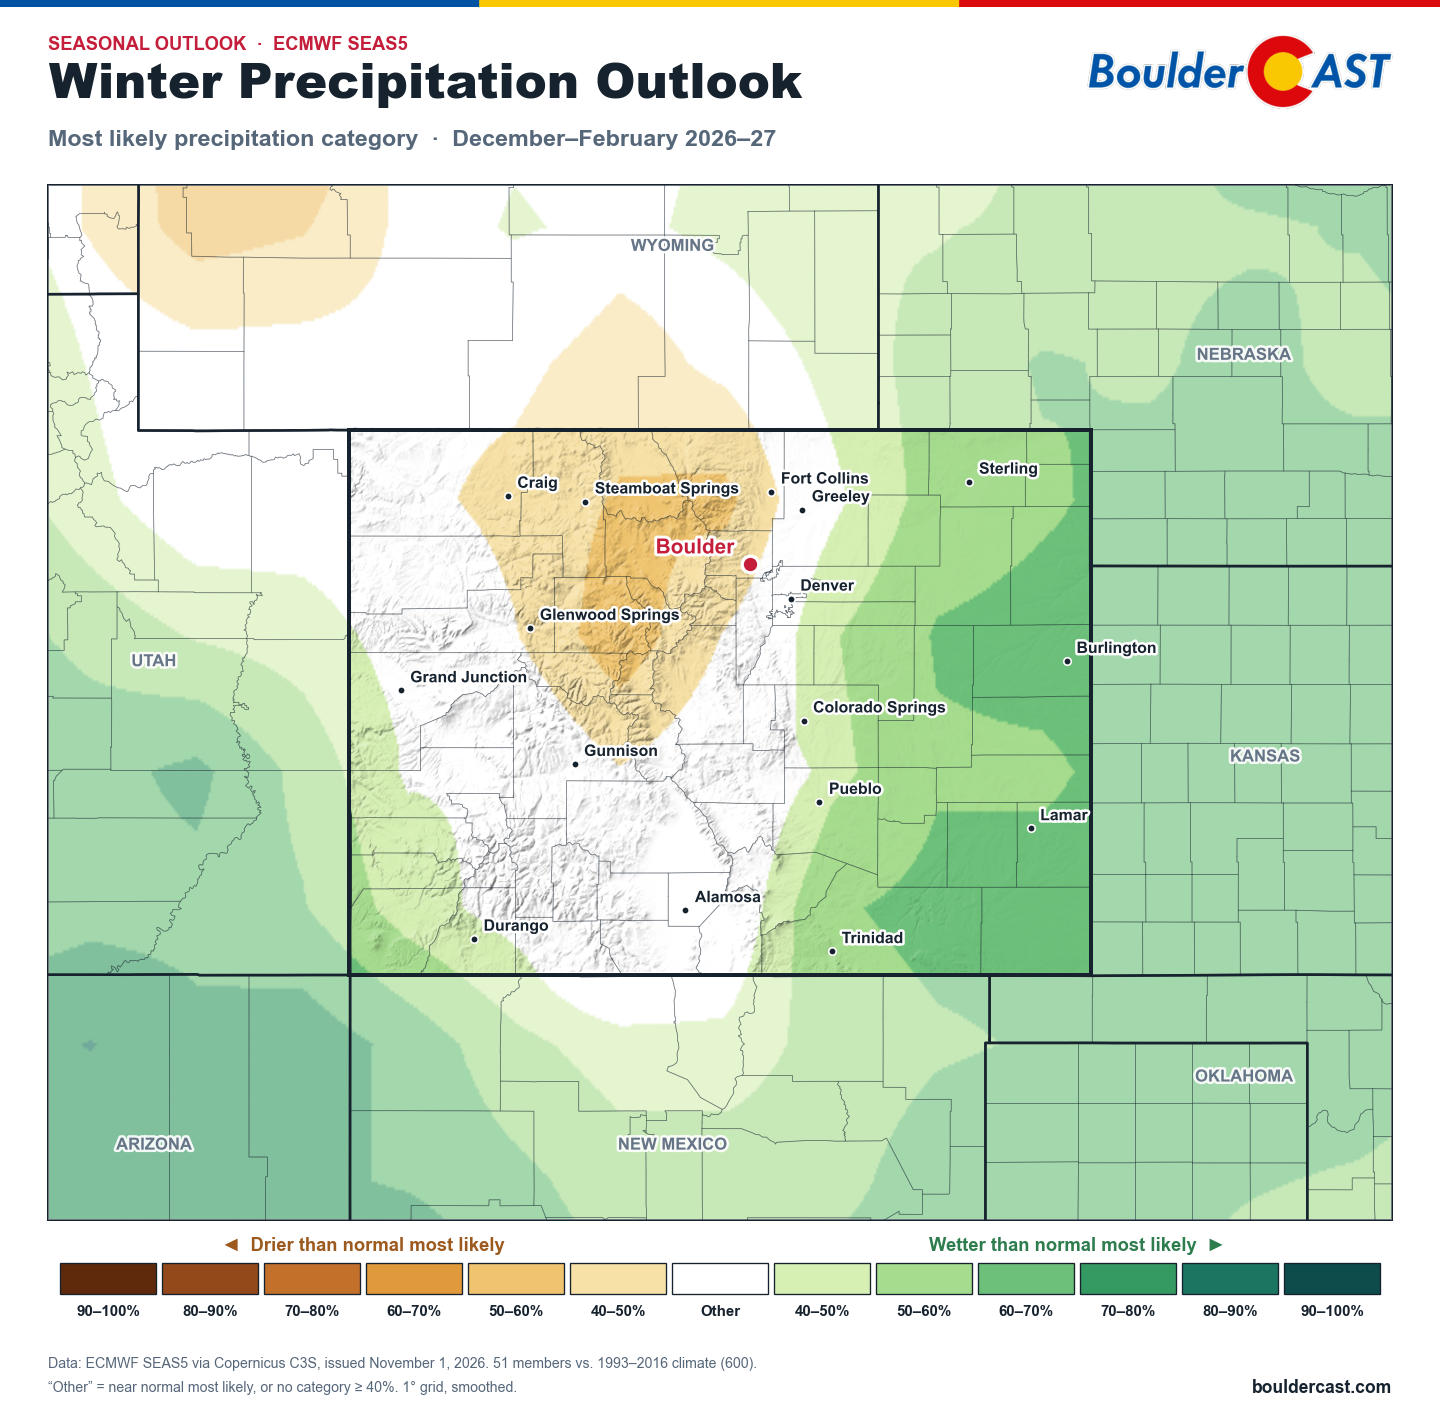
ECMWF SEAS5 most likely precipitation category, December–February, Colorado
And for January–March:
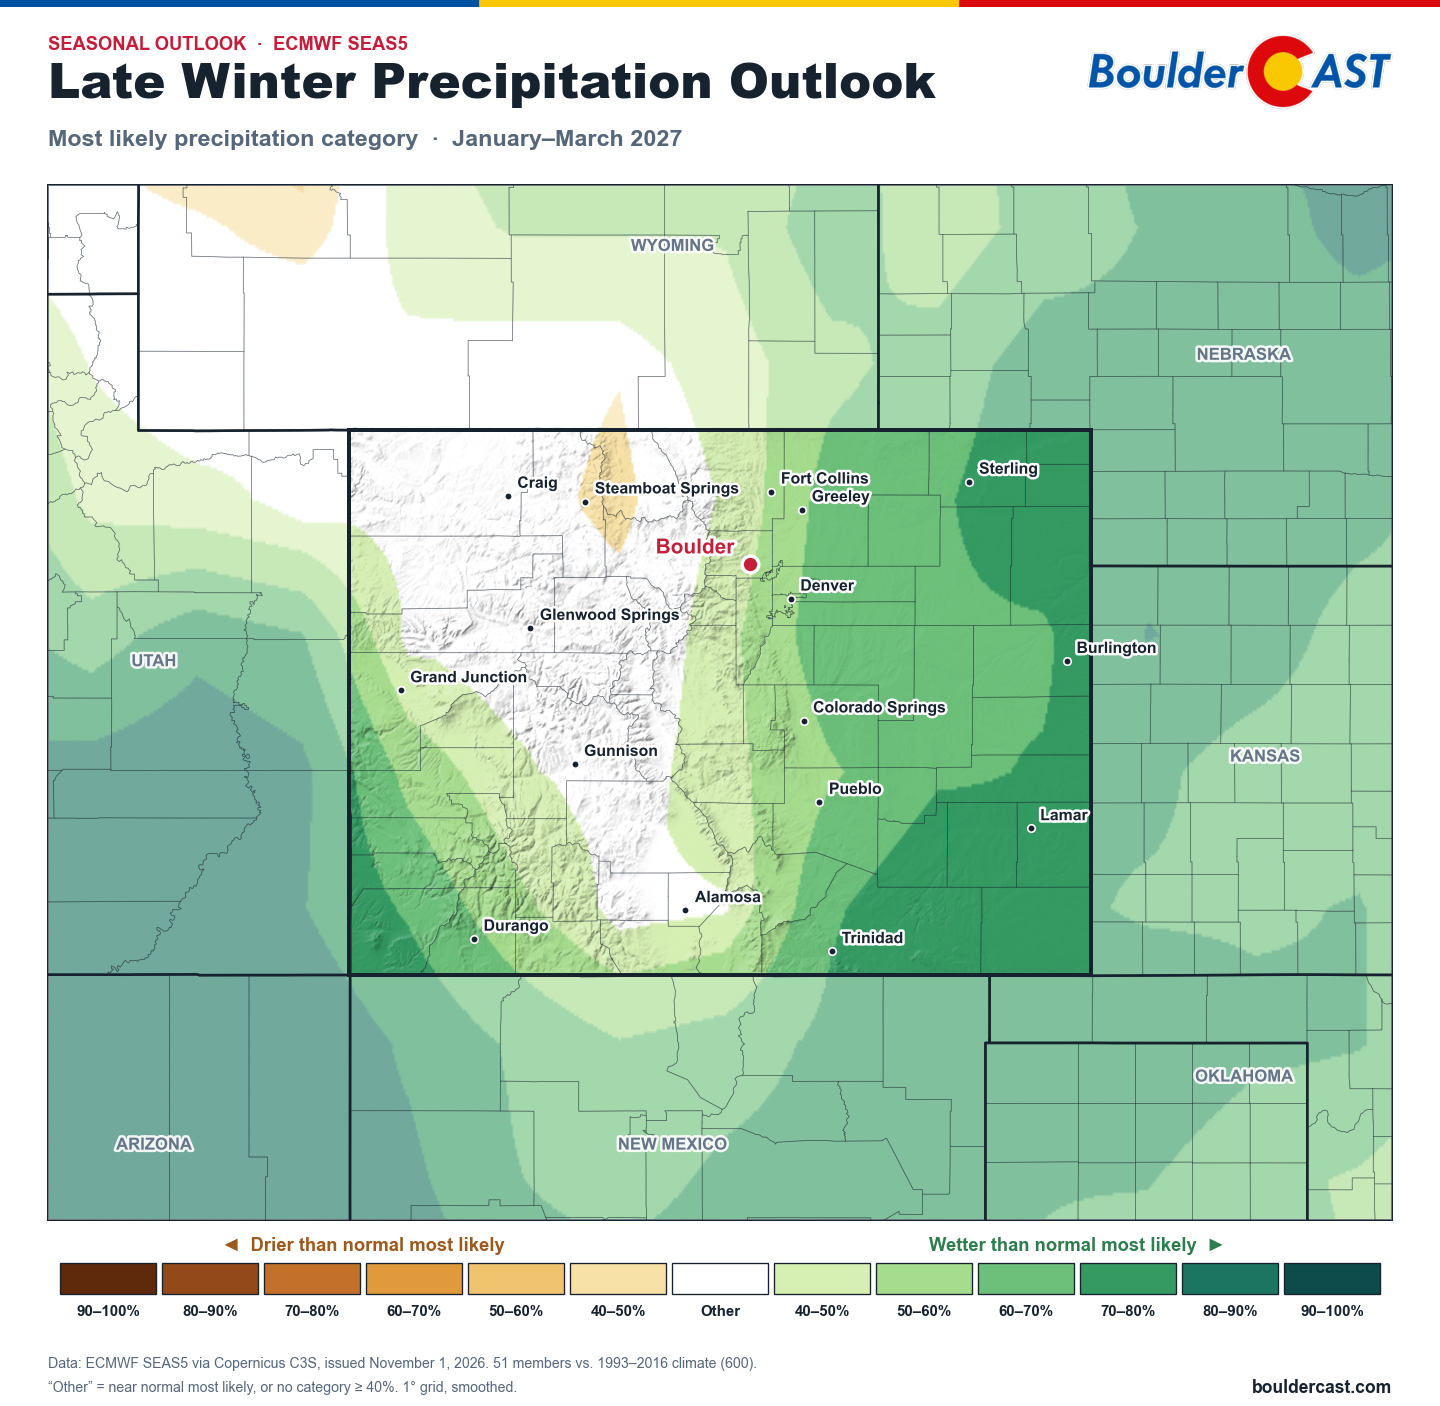
ECMWF SEAS5 most likely precipitation category, January–March, Colorado
A few things jump out:
- The eastern plains lean wet in both periods. Odds reach 70% or more in the southeast by January–March, the classic El Niño setup of storms tracking across the southern Rockies and wrapping moisture back into the plains.
- The San Juans and southwest Colorado lean wet, especially later in the winter. Fresh off this fall’s record tropical floods in southwest Colorado, that’s notable.
- The northern and central mountains lean dry or show no signal. In December–February there’s even a drier-leaning area over the northern mountains, close to Steamboat and the I-70 high country.
- By January–March, the wet signal spreads across more of the state. The central and northern high country, roughly from Steamboat south through Gunnison, stays neutral.
Month by month
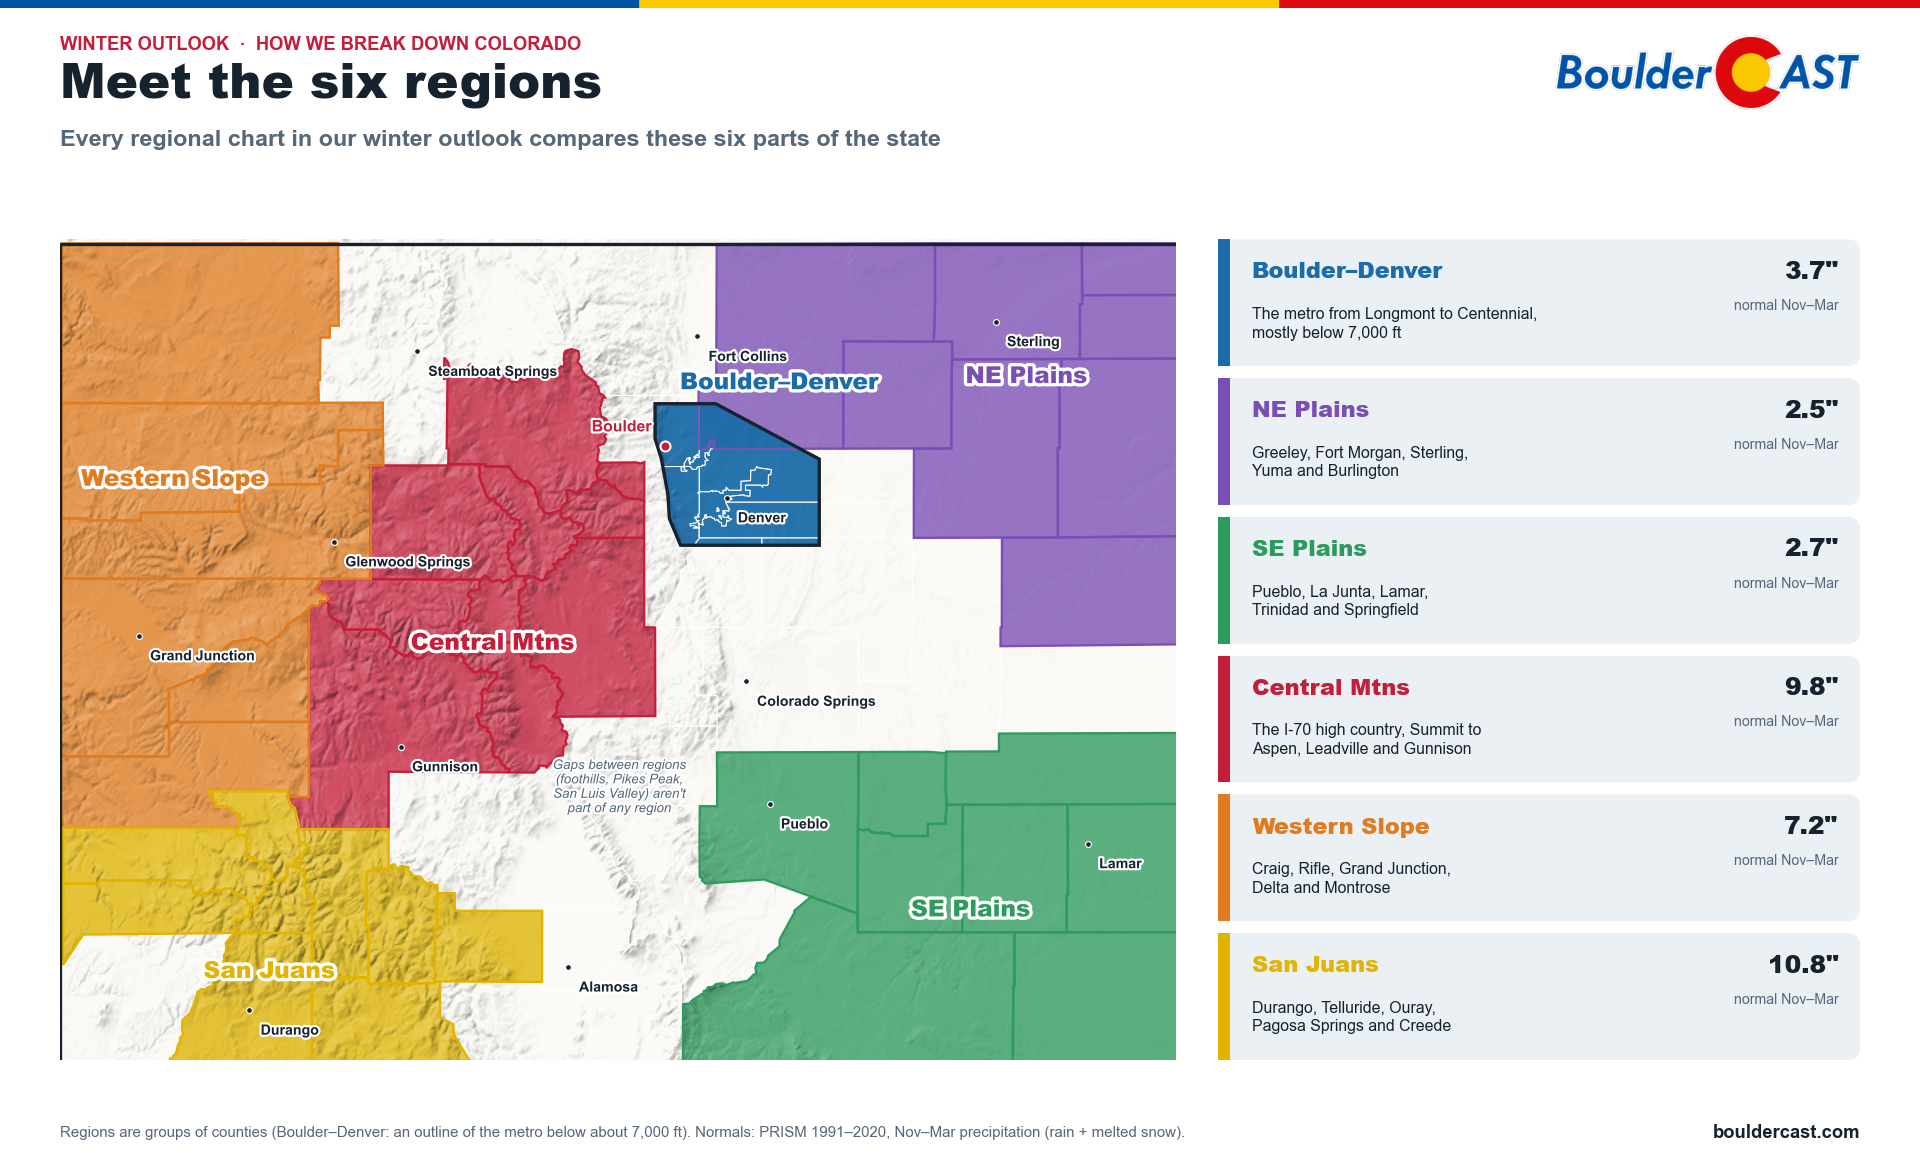
Here’s how those odds play out month by month for six regions of the state: Boulder–Denver Metro area, the Northeast and Southeast Plains, the Central Mountains, the Western Slope and the San Juans.
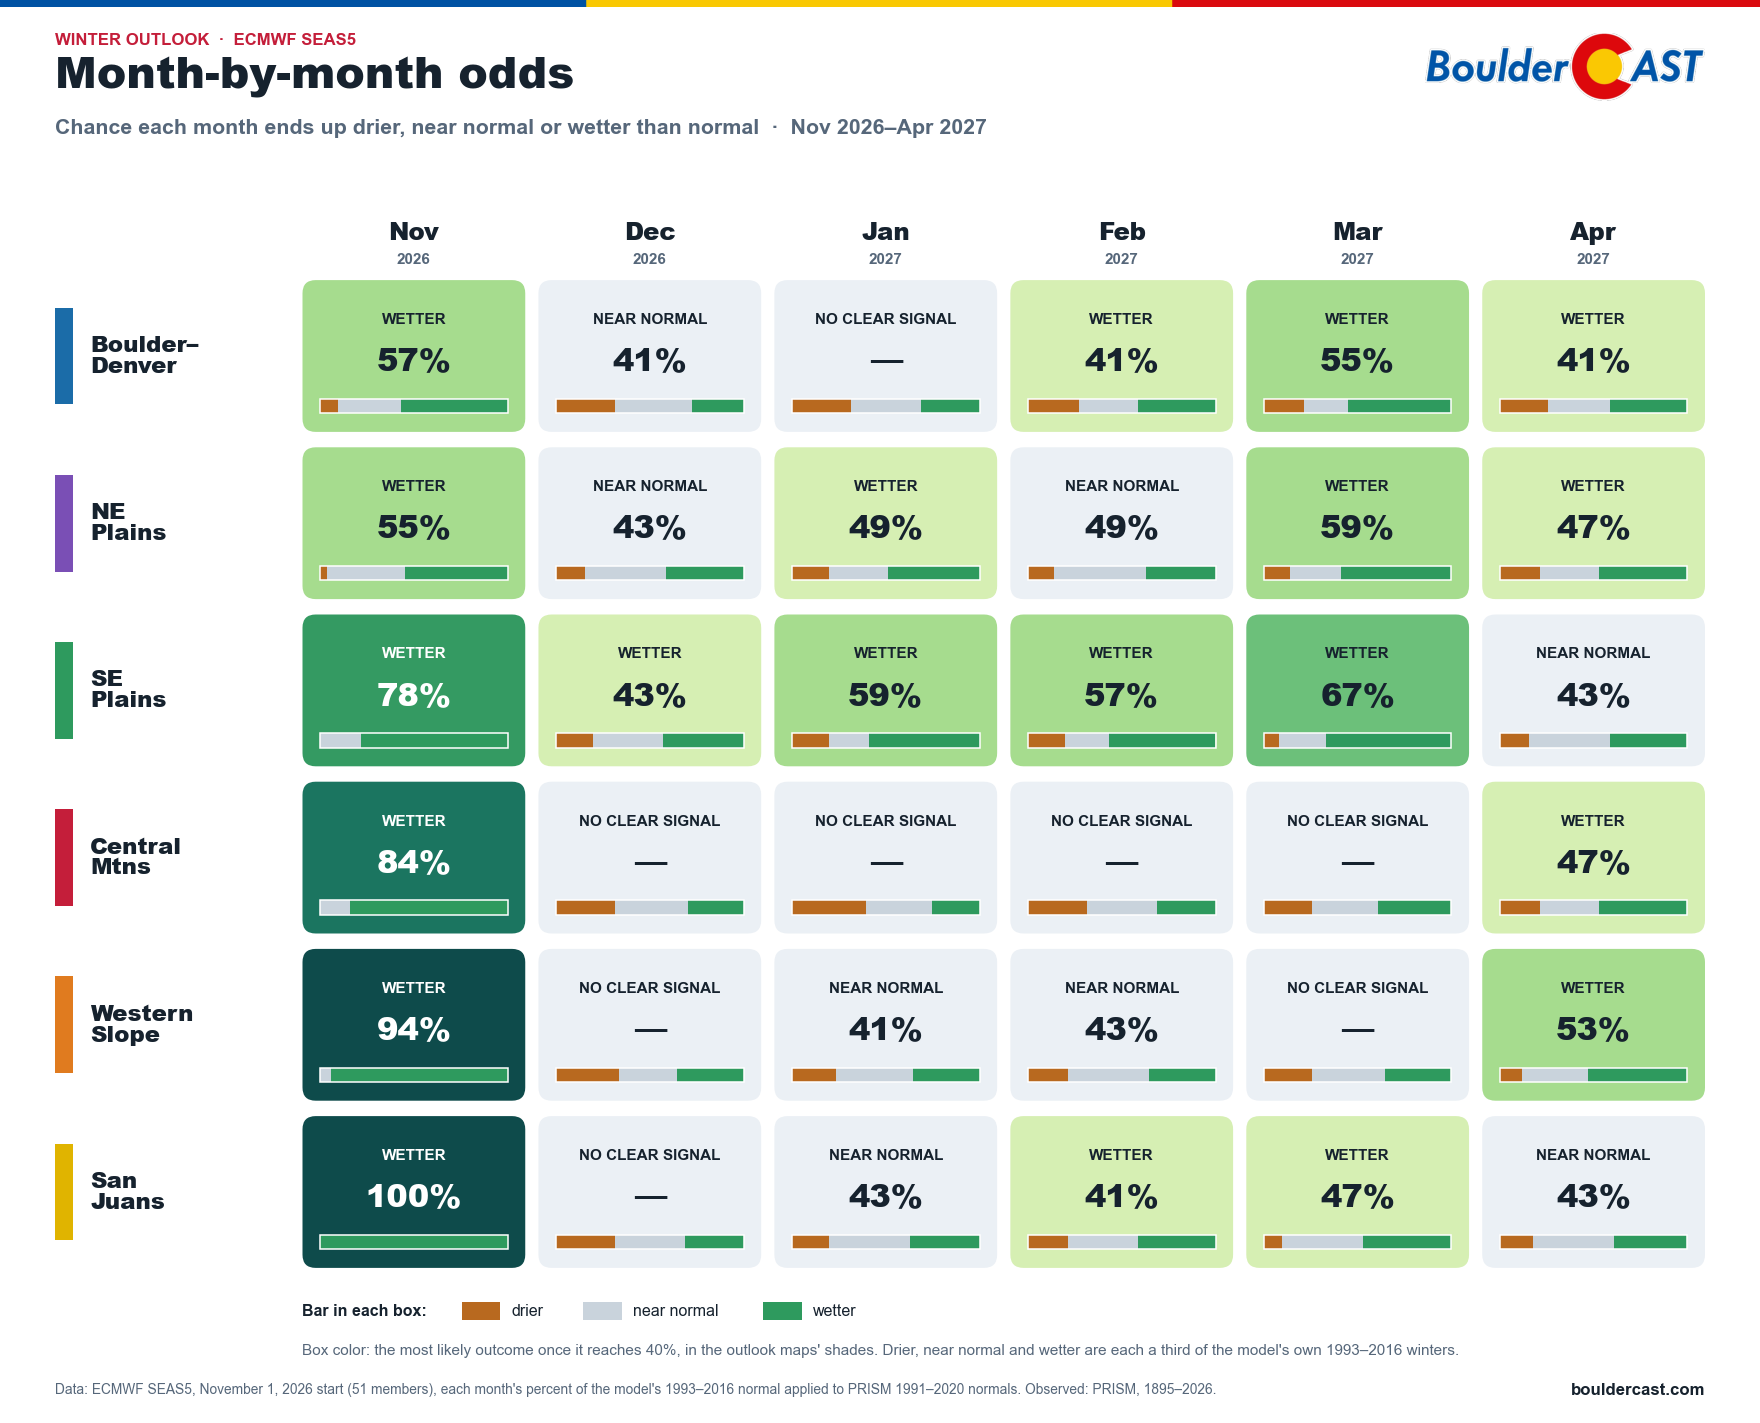
ECMWF SEAS5 month-by-month precipitation odds for six Colorado regions
For Boulder–Denver, the European model leans wetter in November (57%) and March (55%), with a smaller tilt in February and April. December and January are near normal or show no clear signal. The Southeast Plains lean wetter in every month from November through March, with the highest odds in November (78%) and March (67%). In the mountains, the Central Mountains and Western Slope show little signal between a wet November and a wetter April, while the San Juans lean wet again by February.
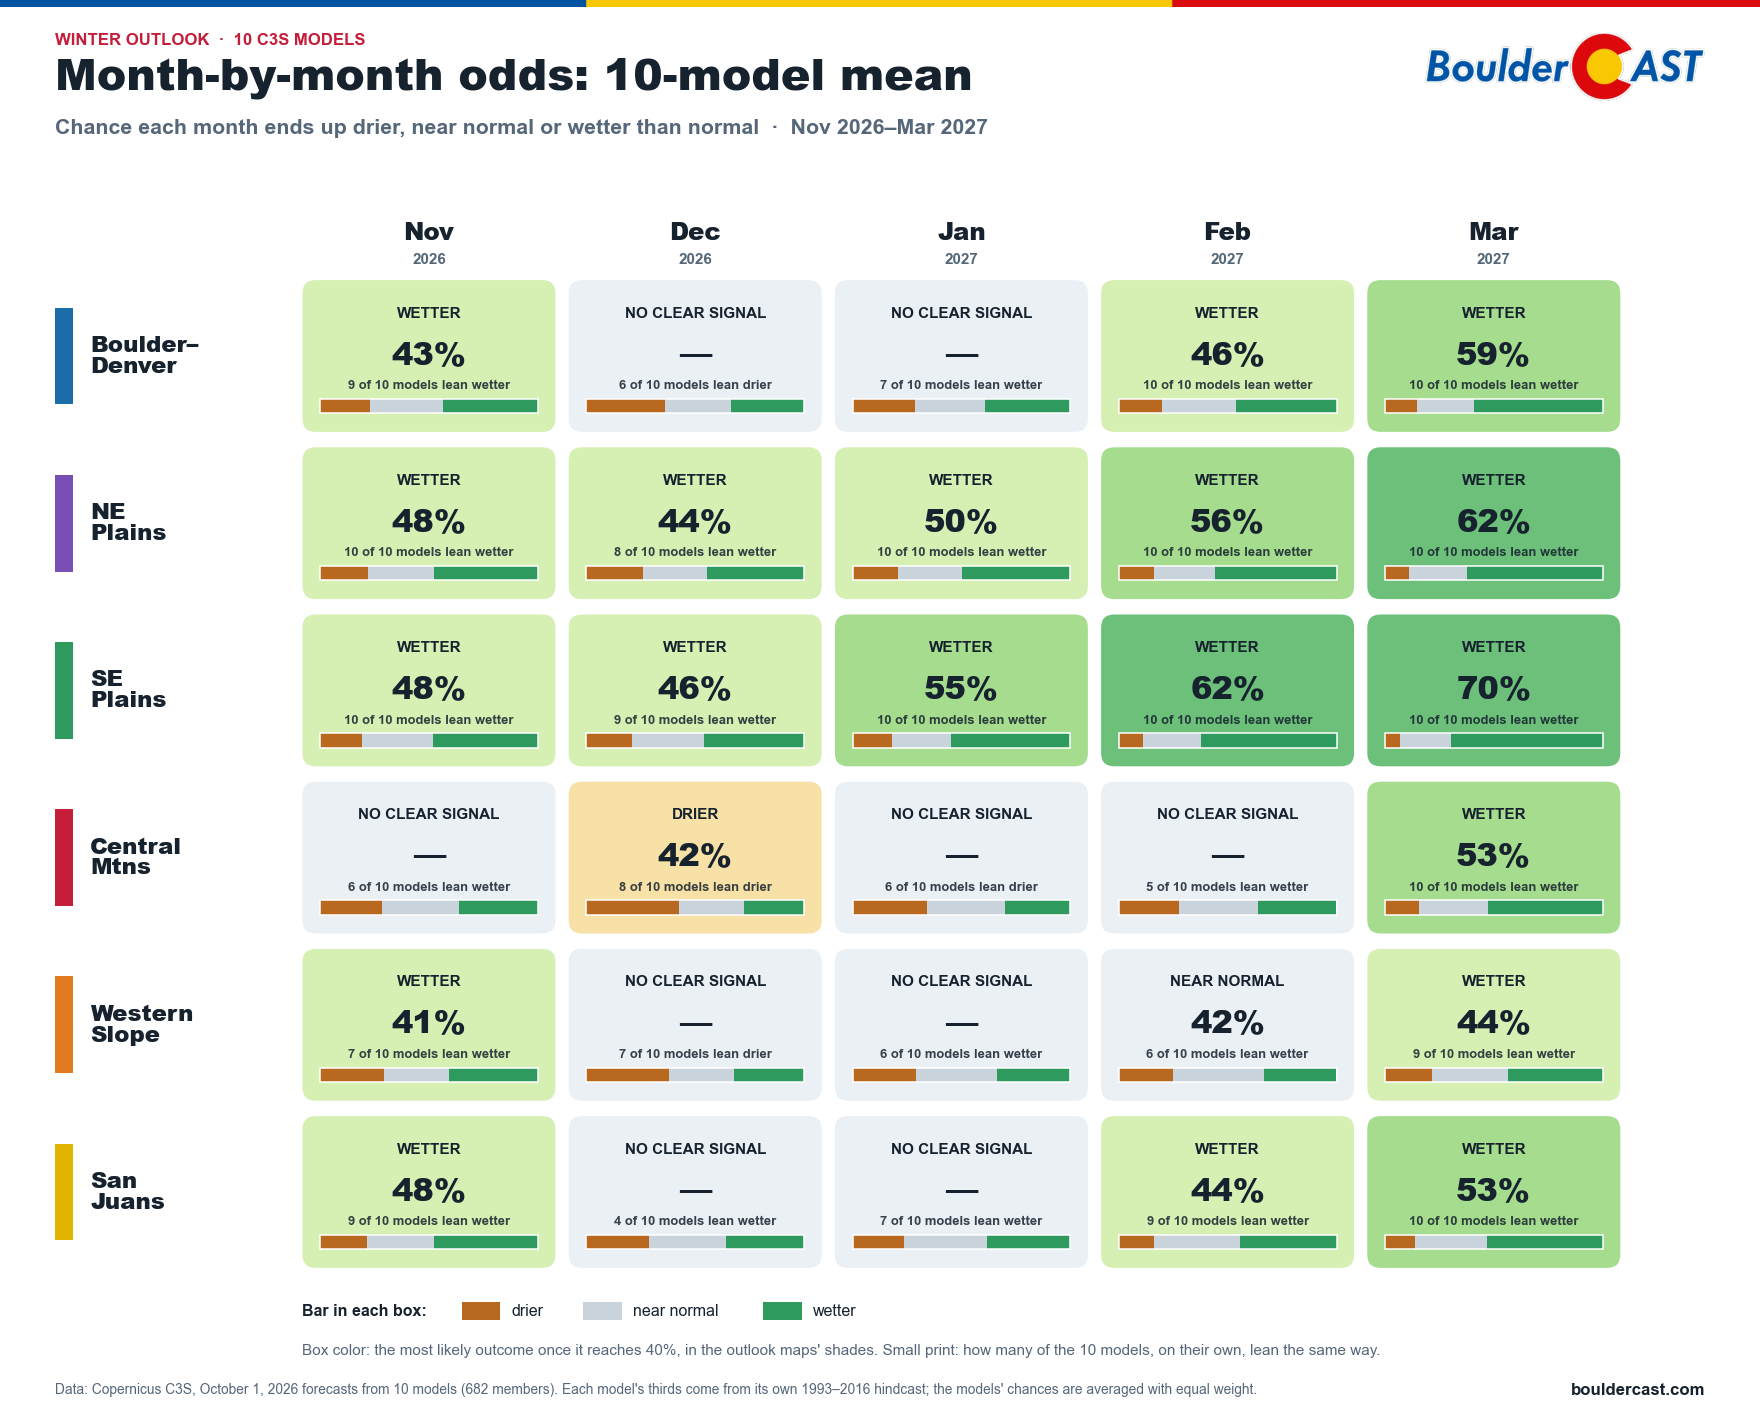
That late-winter wet tilt shows up even more clearly in the 10-model average. By March, all six regions lean wetter, and at least 9 of the 10 models agree in every one:
10-model forecast of November–March precipitation in inches (left) and as a percent of normal (right)
How big could it be?
Seasonal outlooks speak in odds, but it helps to see them in inches. So we took the 10-model average and laid it over PRISM’s detailed map of a normal winter. That turns “wetter than normal” into actual amounts of rain and melted snow from November through March:
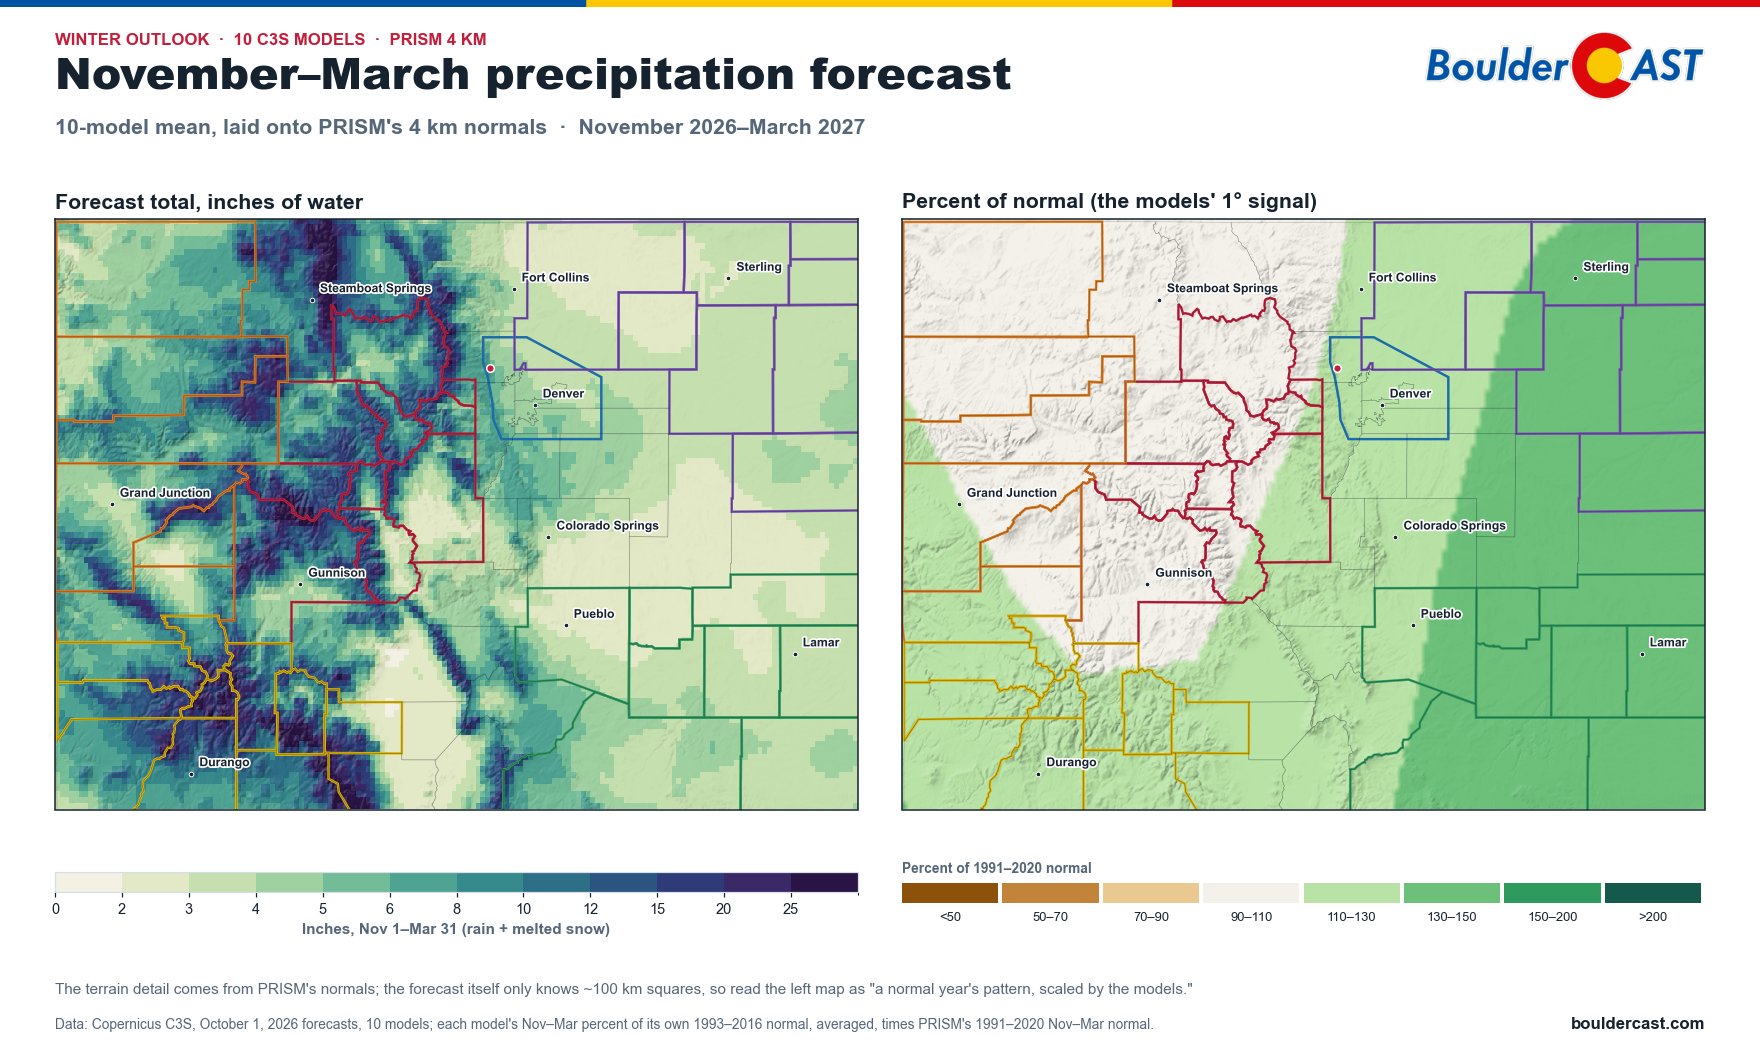
10-model forecast of November–March precipitation in inches (left) and as a percent of normal (right)
The mountains still get by far the most moisture. They always do, so the left map mostly looks like a normal winter. The right map shows where the models think this winter beats normal: the eastern plains most of all, then southwest Colorado and the Front Range. The central high country sits right around normal.
How likely are the bigger totals? Here are the odds of topping each amount by the end of March, from all 682 runs of the 10 models, next to how often a typical winter gets there:
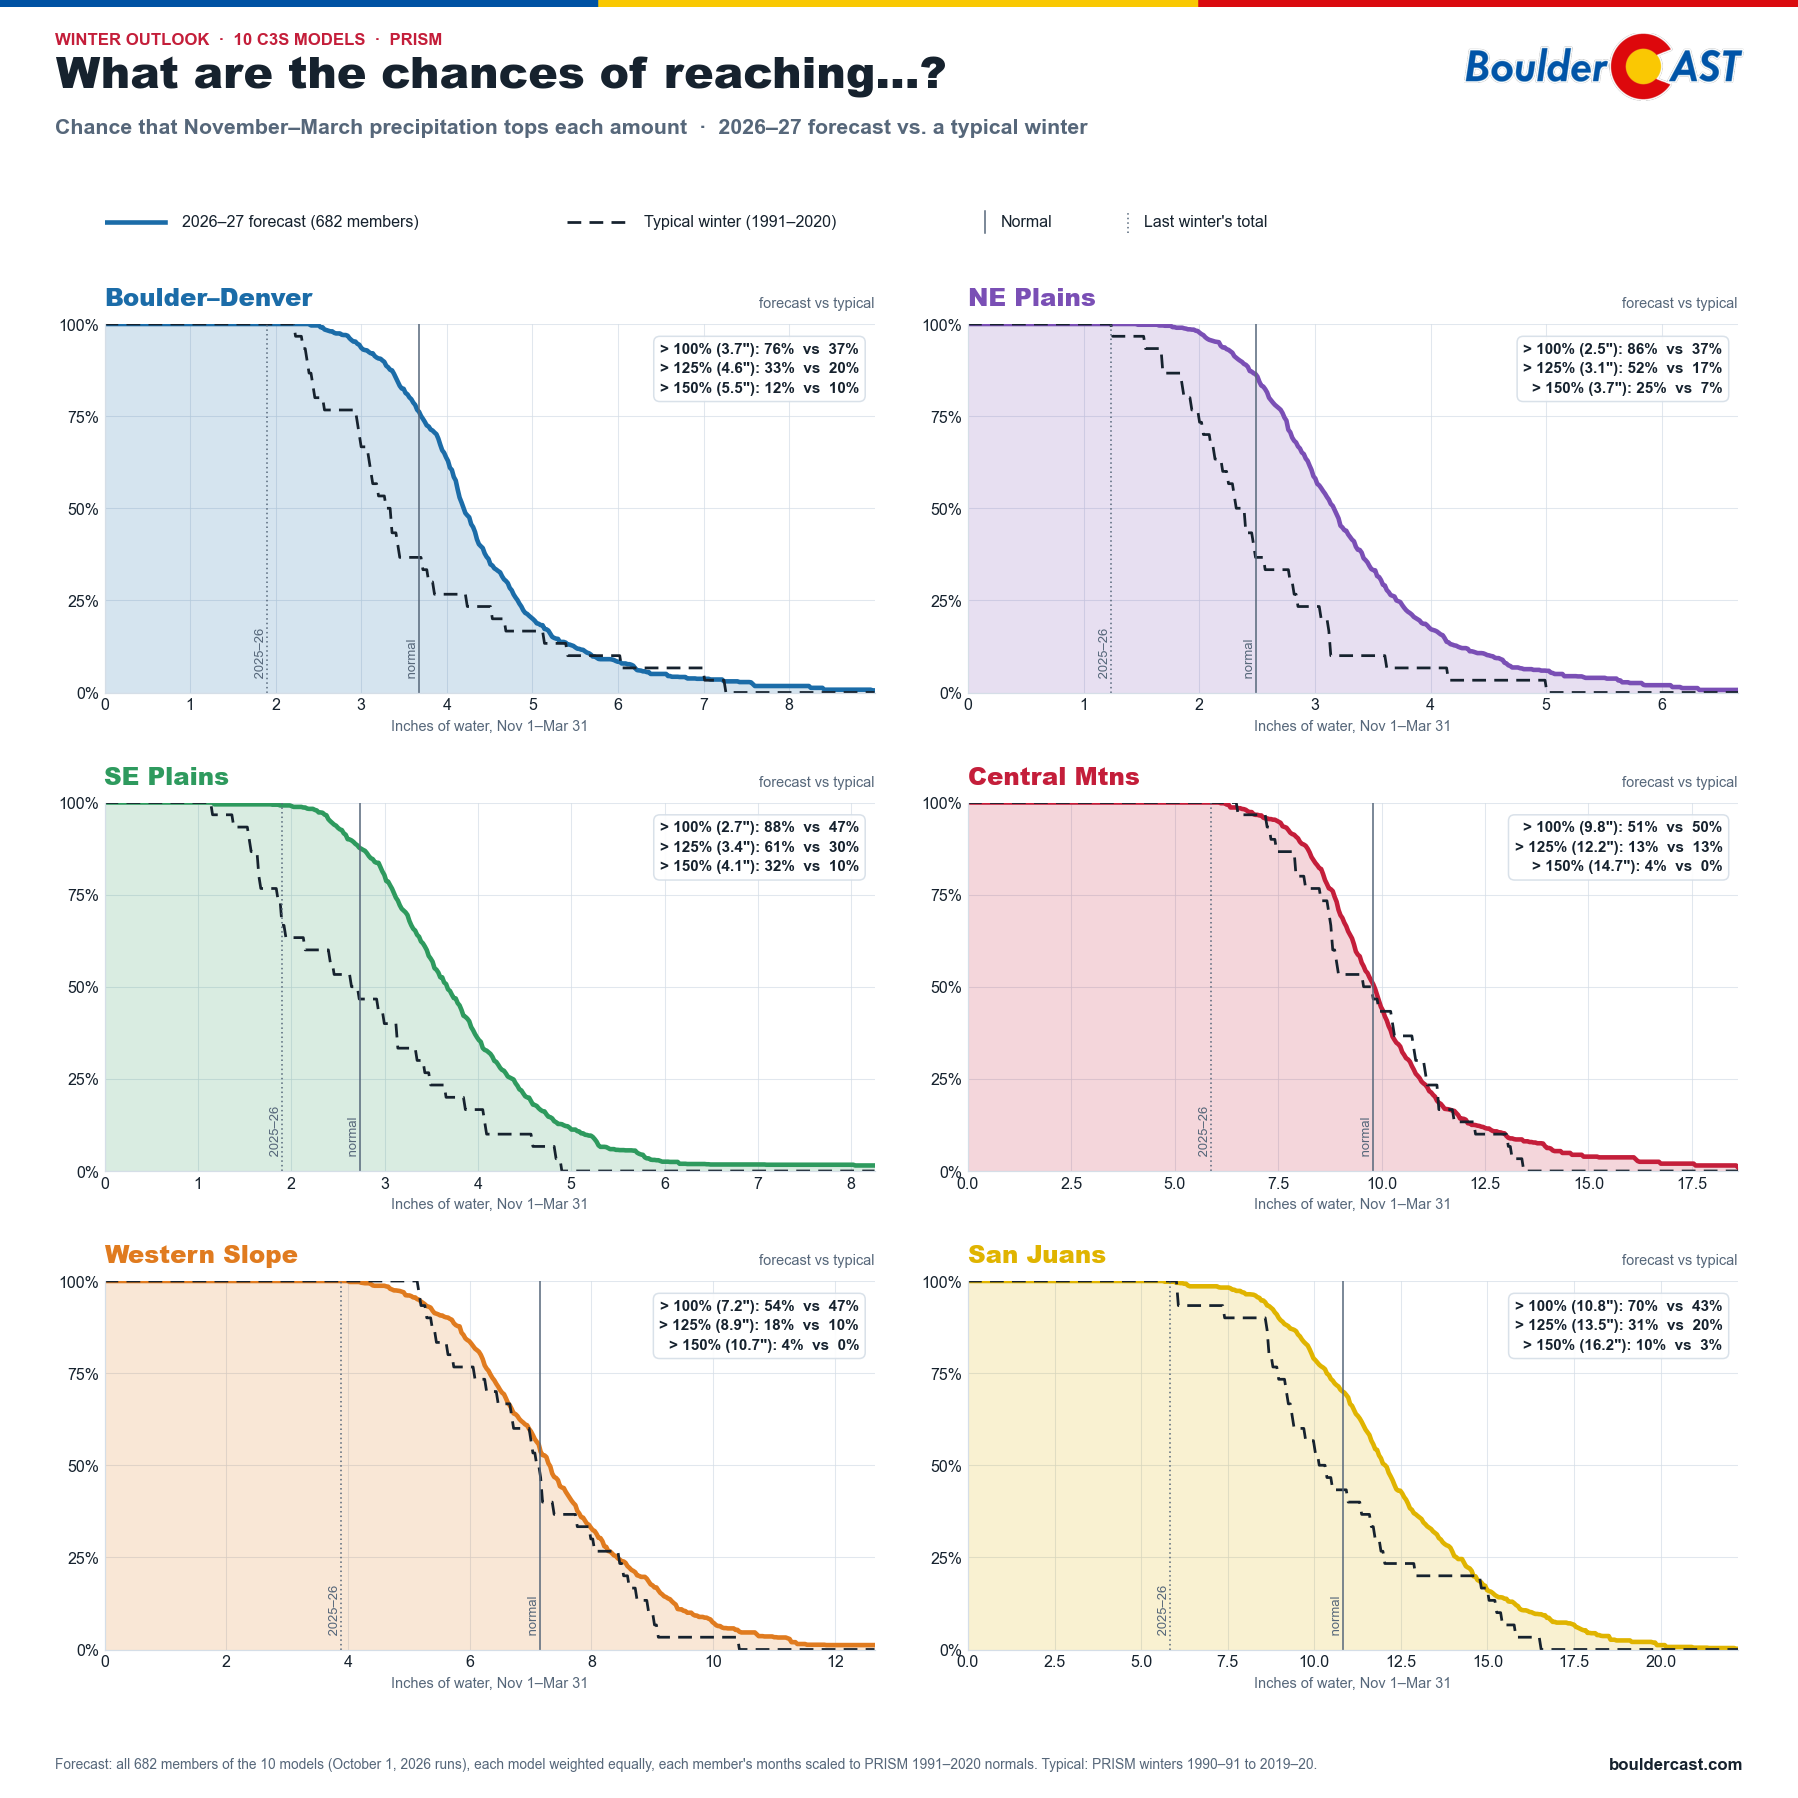
Chance that November–March precipitation tops each amount, 2026–27 forecast vs. a typical winter, six Colorado regions
- Boulder–Denver: about a 3-in-4 chance (76%) of a wetter-than-normal November–March, which works out to about 3.7″ of water. In a typical winter, only about 37% of years get there.
- The plains: the strongest odds in the state, at 86% in the northeast and 88% in the southeast.
- San Juans: 70%, up from 43% in a typical winter.
- Central Mountains and Western Slope: basically a coin flip (51–54%), just like any other year.
There’s good news in every panel, too. Nearly all of the 682 model runs end up wetter than last winter in all six regions. After last winter’s dismal 41 inches of snow in Boulder (including the latest first snowfall on record and a record-warm March that melted the snowpack early) and a water year that tied for driest on record, that’s genuinely encouraging.
Mirroring Swain’s California analysis, we also counted the truly soggy months: months with more than double the normal precipitation. Here’s how many each model expects between November and March, with a typical winter at the bottom for comparison:
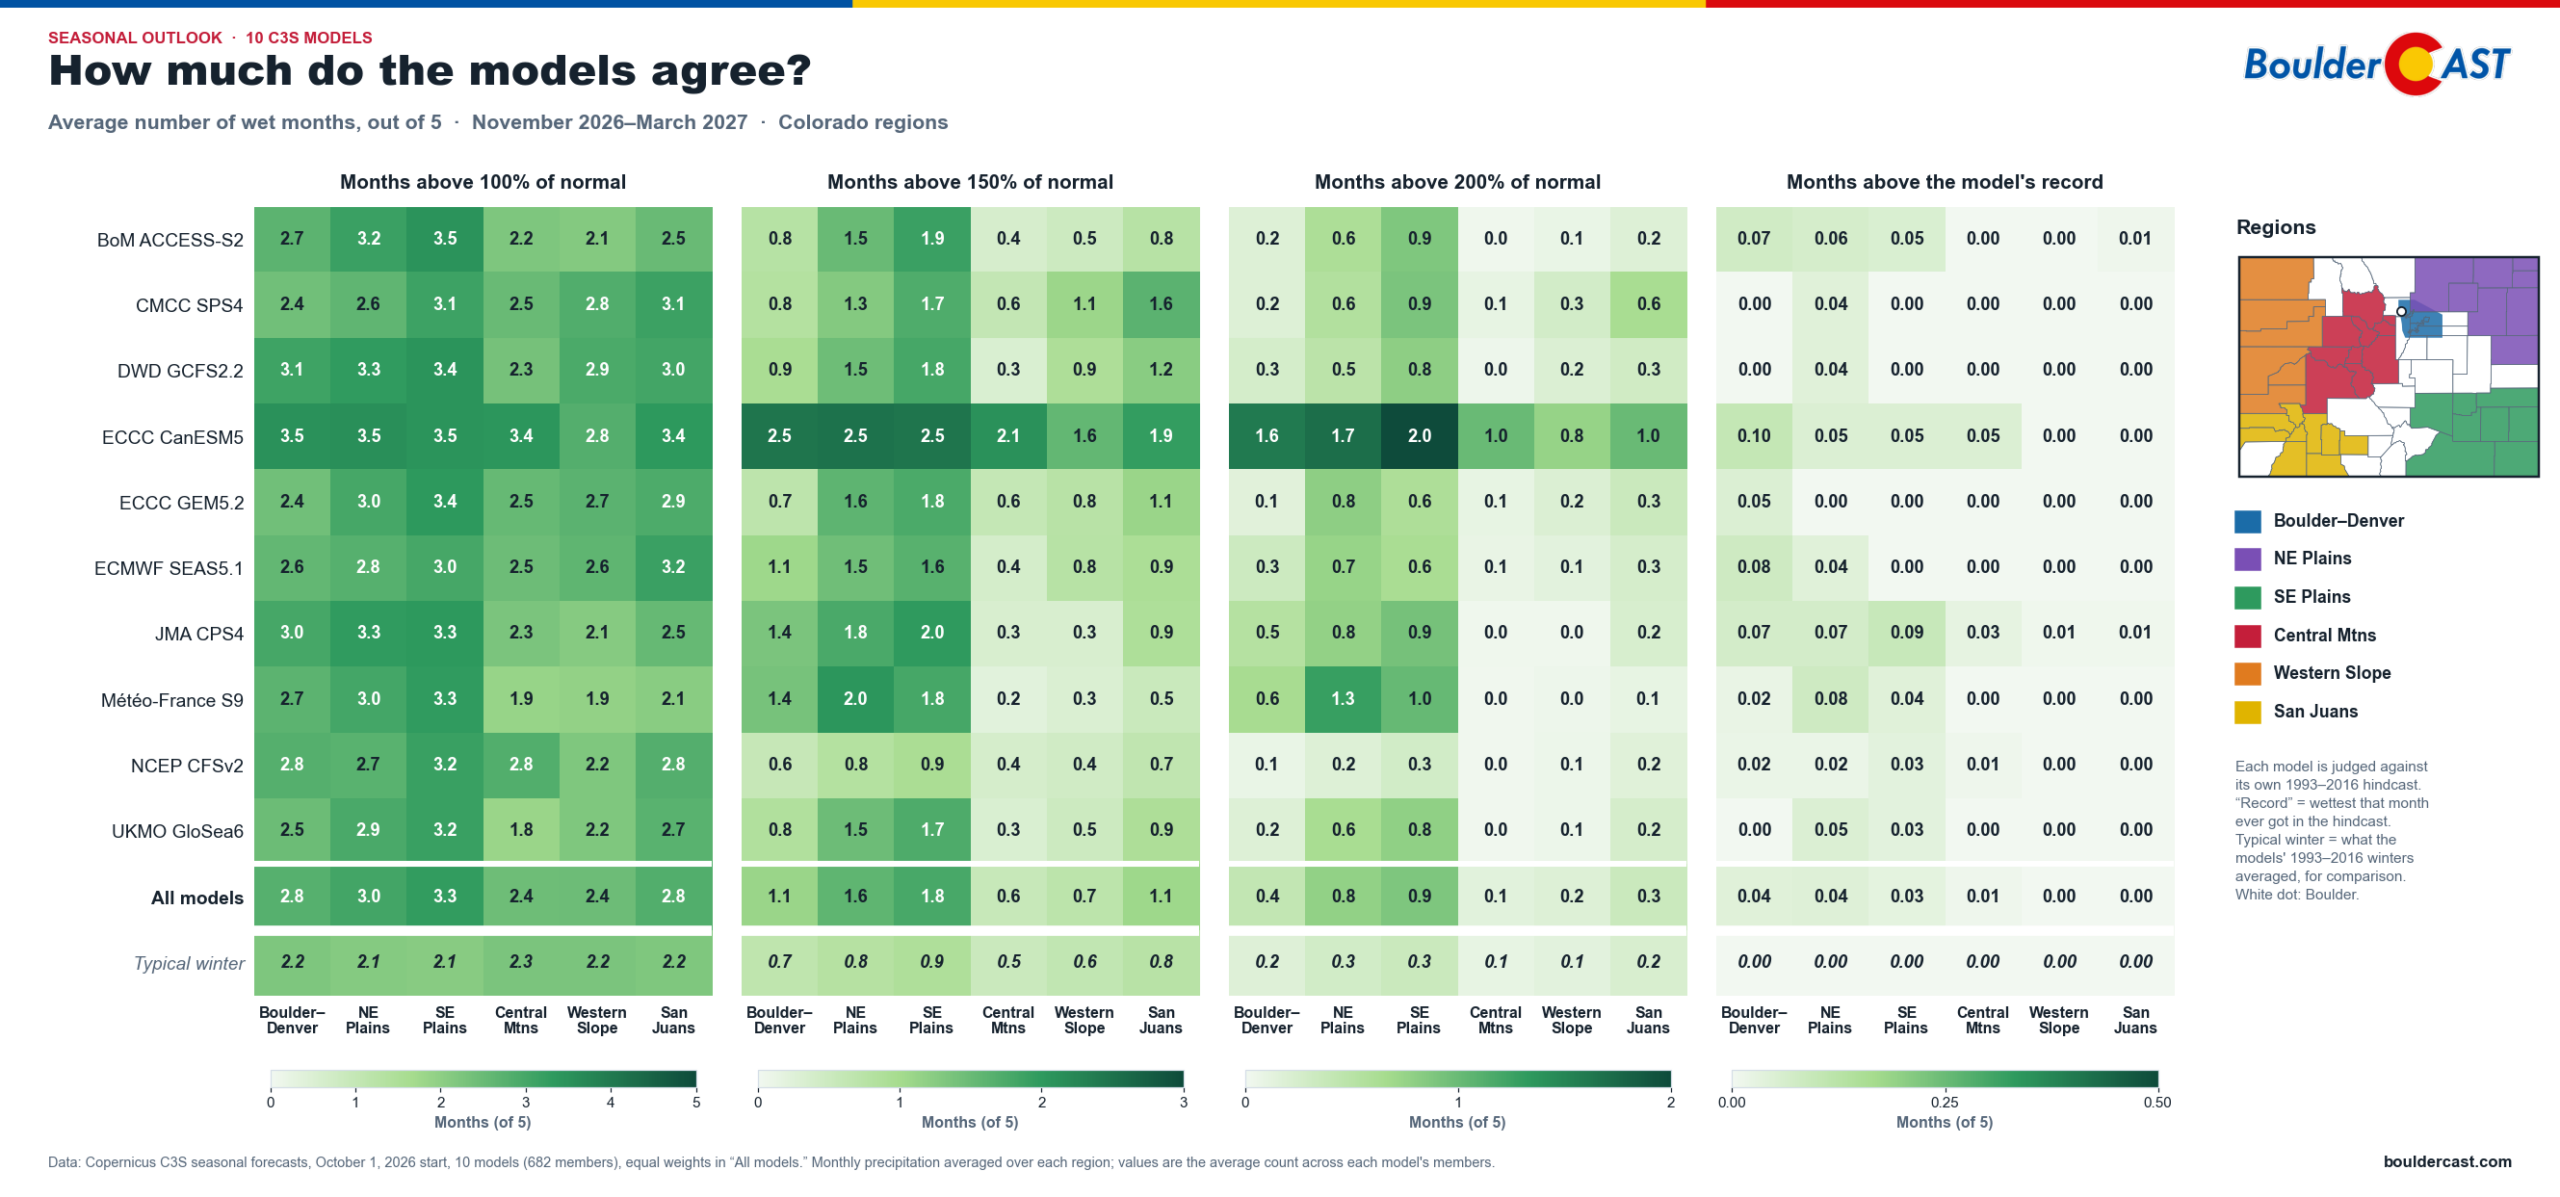
Average number of very wet months, November–March, from each of the 10 C3S models, Colorado regions. Max = 5 months.
Read the bottom two rows. On the plains, the models expect two to three times as many of those soggy months as a typical winter. Boulder–Denver roughly doubles. The high country barely budges. As in California, the Canadian CanESM5 model is by far the wettest and NCEP’s CFSv2 the driest.
Temperatures
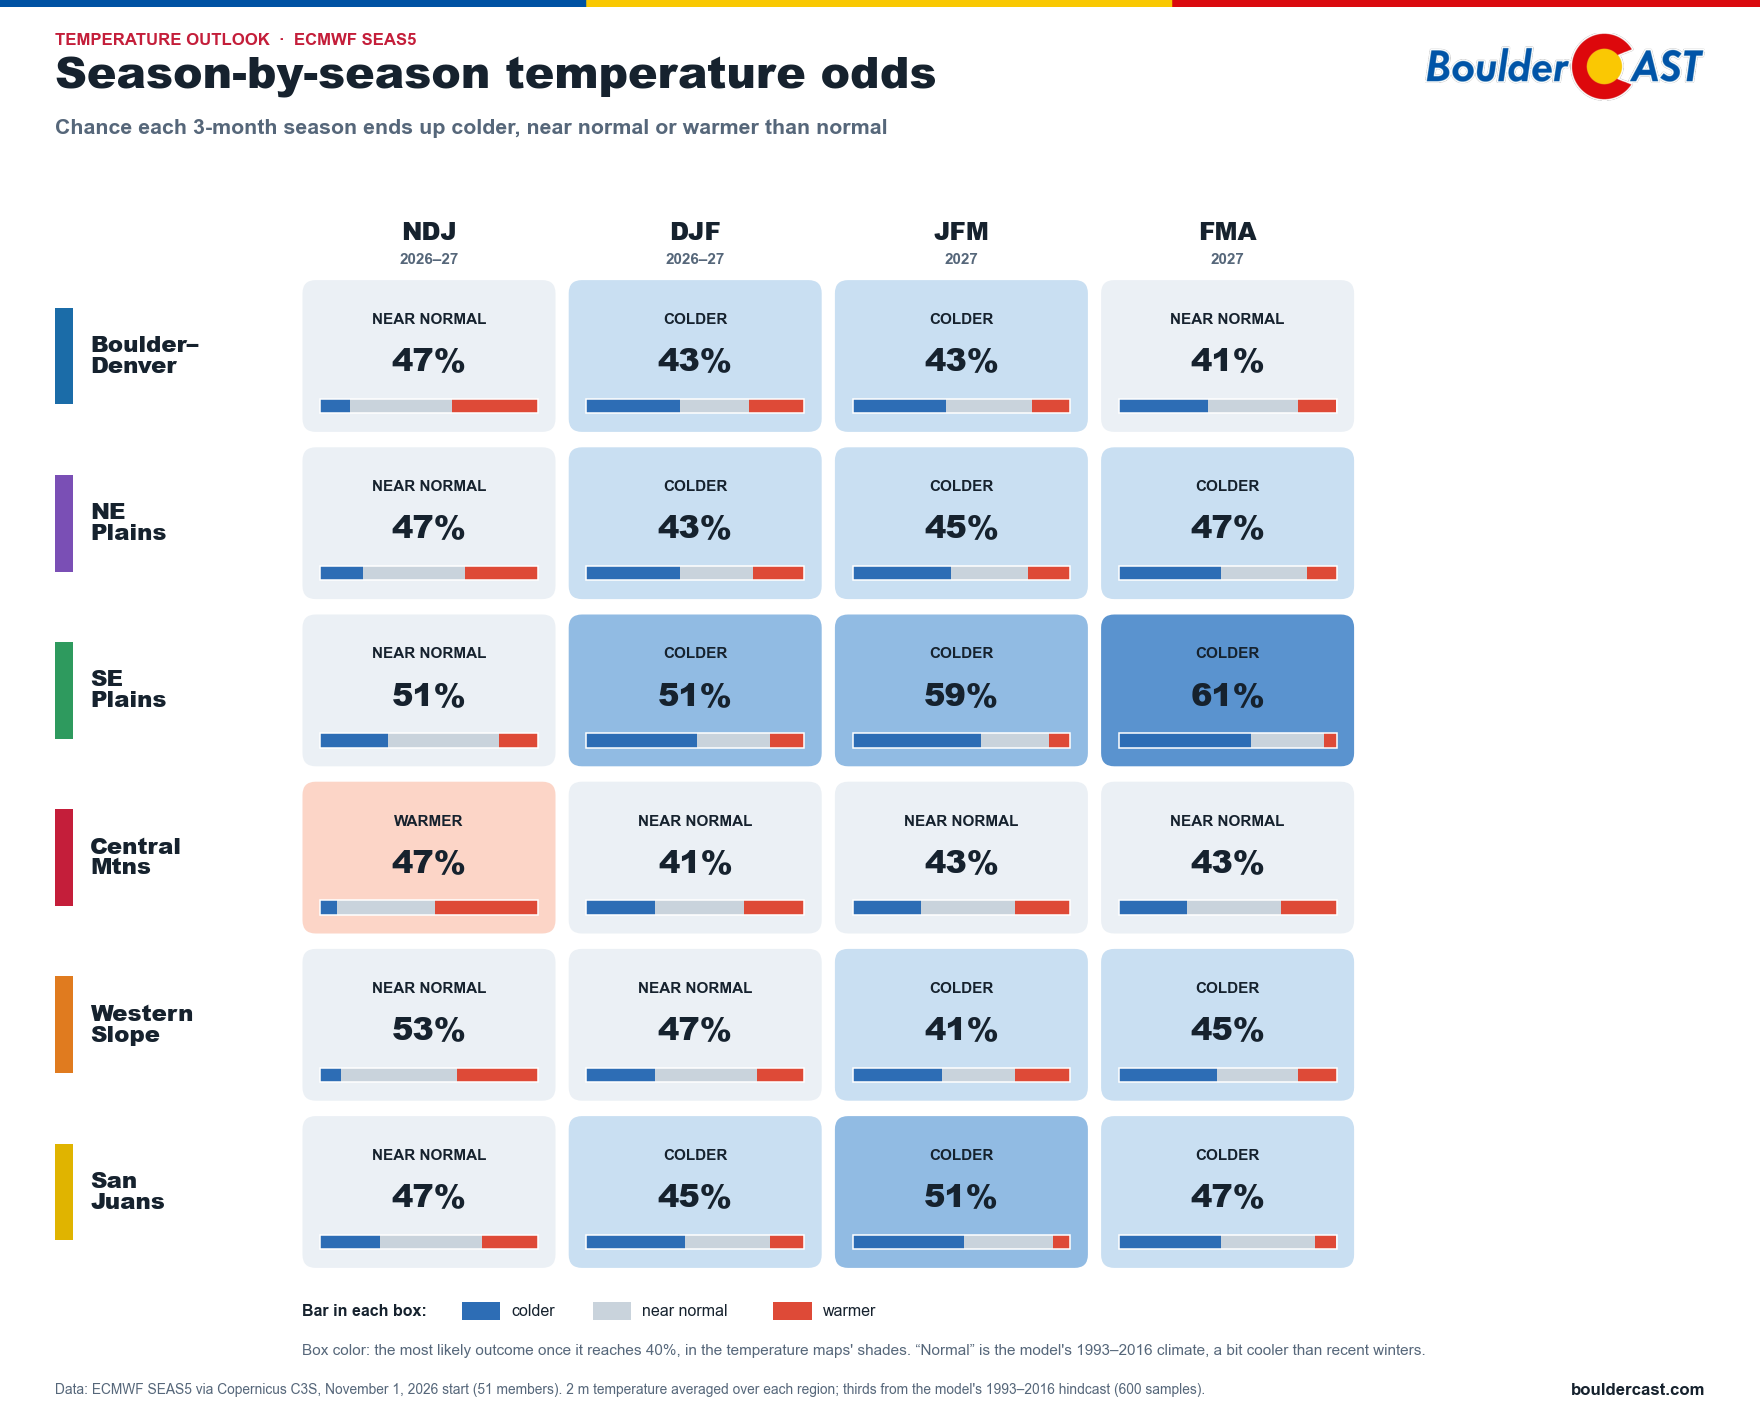
ECMWF SEAS5 season-by-season temperature odds for six Colorado regions
The temperature signal is weaker, but it fits the storm-track story:
- The Southeast Plains lean colder from December on, rising to 61% for February–April. More clouds, more storms and more snow cover would do that.
- The Northeast Plains and the San Juans also lean colder from December on, at 43–51%.
- Boulder–Denver leans slightly colder from December through March (43%) and is near normal otherwise.
- The Western Slope turns slightly colder later in the winter.
- The Central Mountains are mostly near normal, after a warmer-leaning start in November–January.
One note: “normal” here is the model’s 1993–2016 climate, which is a bit cooler than recent winters. A “near normal” winter by that yardstick would still be mild by older standards.
How much can we trust the models?
Before you take any of this to the bank, it’s fair to ask how good these models actually are at Colorado winters. So we graded them.
Each model has “forecast” every winter from 1993 to 2016 after the fact. We lined those forecasts up against what actually fell, according to PRISM, and scored how well the model’s wet and dry winters matched reality:
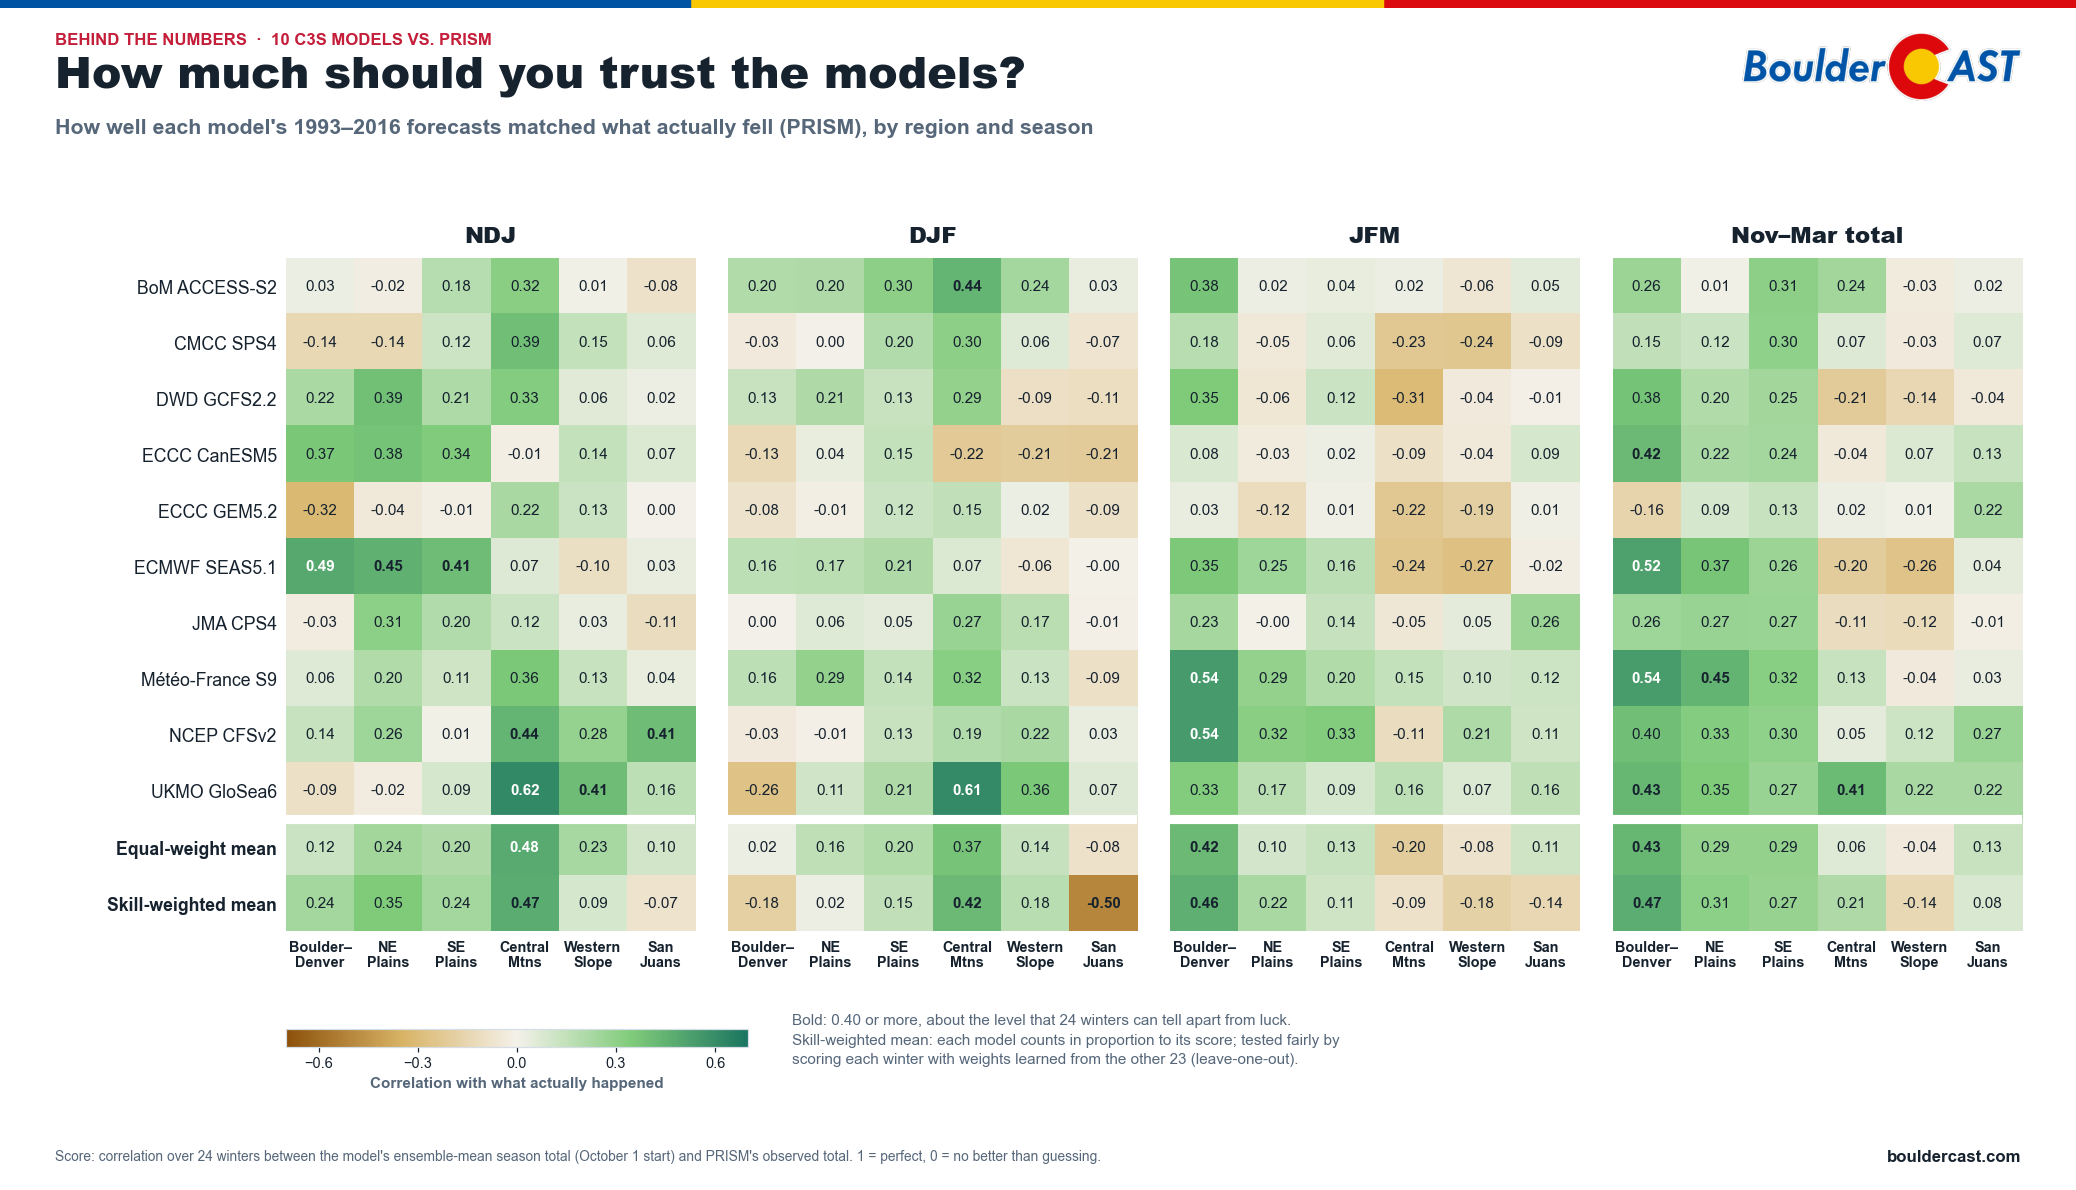
How well each model’s past forecasts matched what actually fell in Colorado, 1993–2016
Green means the model’s wet and dry winters lined up with reality. White means it did no better than a coin flip, and brown means worse which is a horrible result for any model.
- Late winter along the Front Range is one of the models’ best spots. For Boulder–Denver in January–March, the 10-model average shows modest but real skill. That’s exactly when this year’s wet signal is strongest.
- The plains and the early-winter Central Mountains also show some skill.
- The San Juans and the Western Slope are close to a coin flip, so take the outlook there with an extra grain of salt.
- No single model is best everywhere. We tried giving the better models more say, and it didn’t reliably help, so the simple 10-model average remains the safest bet.
What does history say?
Models are one thing. What actually happened in past strong El Niño winters? Our Climate Hub tracks exactly that. (For a look at the last strong event, see our outlook ahead of the 2023–24 El Niño winter.)
Strong El Niño winters across Colorado
Here’s the average November–March precipitation across Colorado for the seven strong El Niño winters since 1950: 1957–58, 1965–66, 1972–73, 1982–83, 1991–92, 1997–98 and 2015–16:
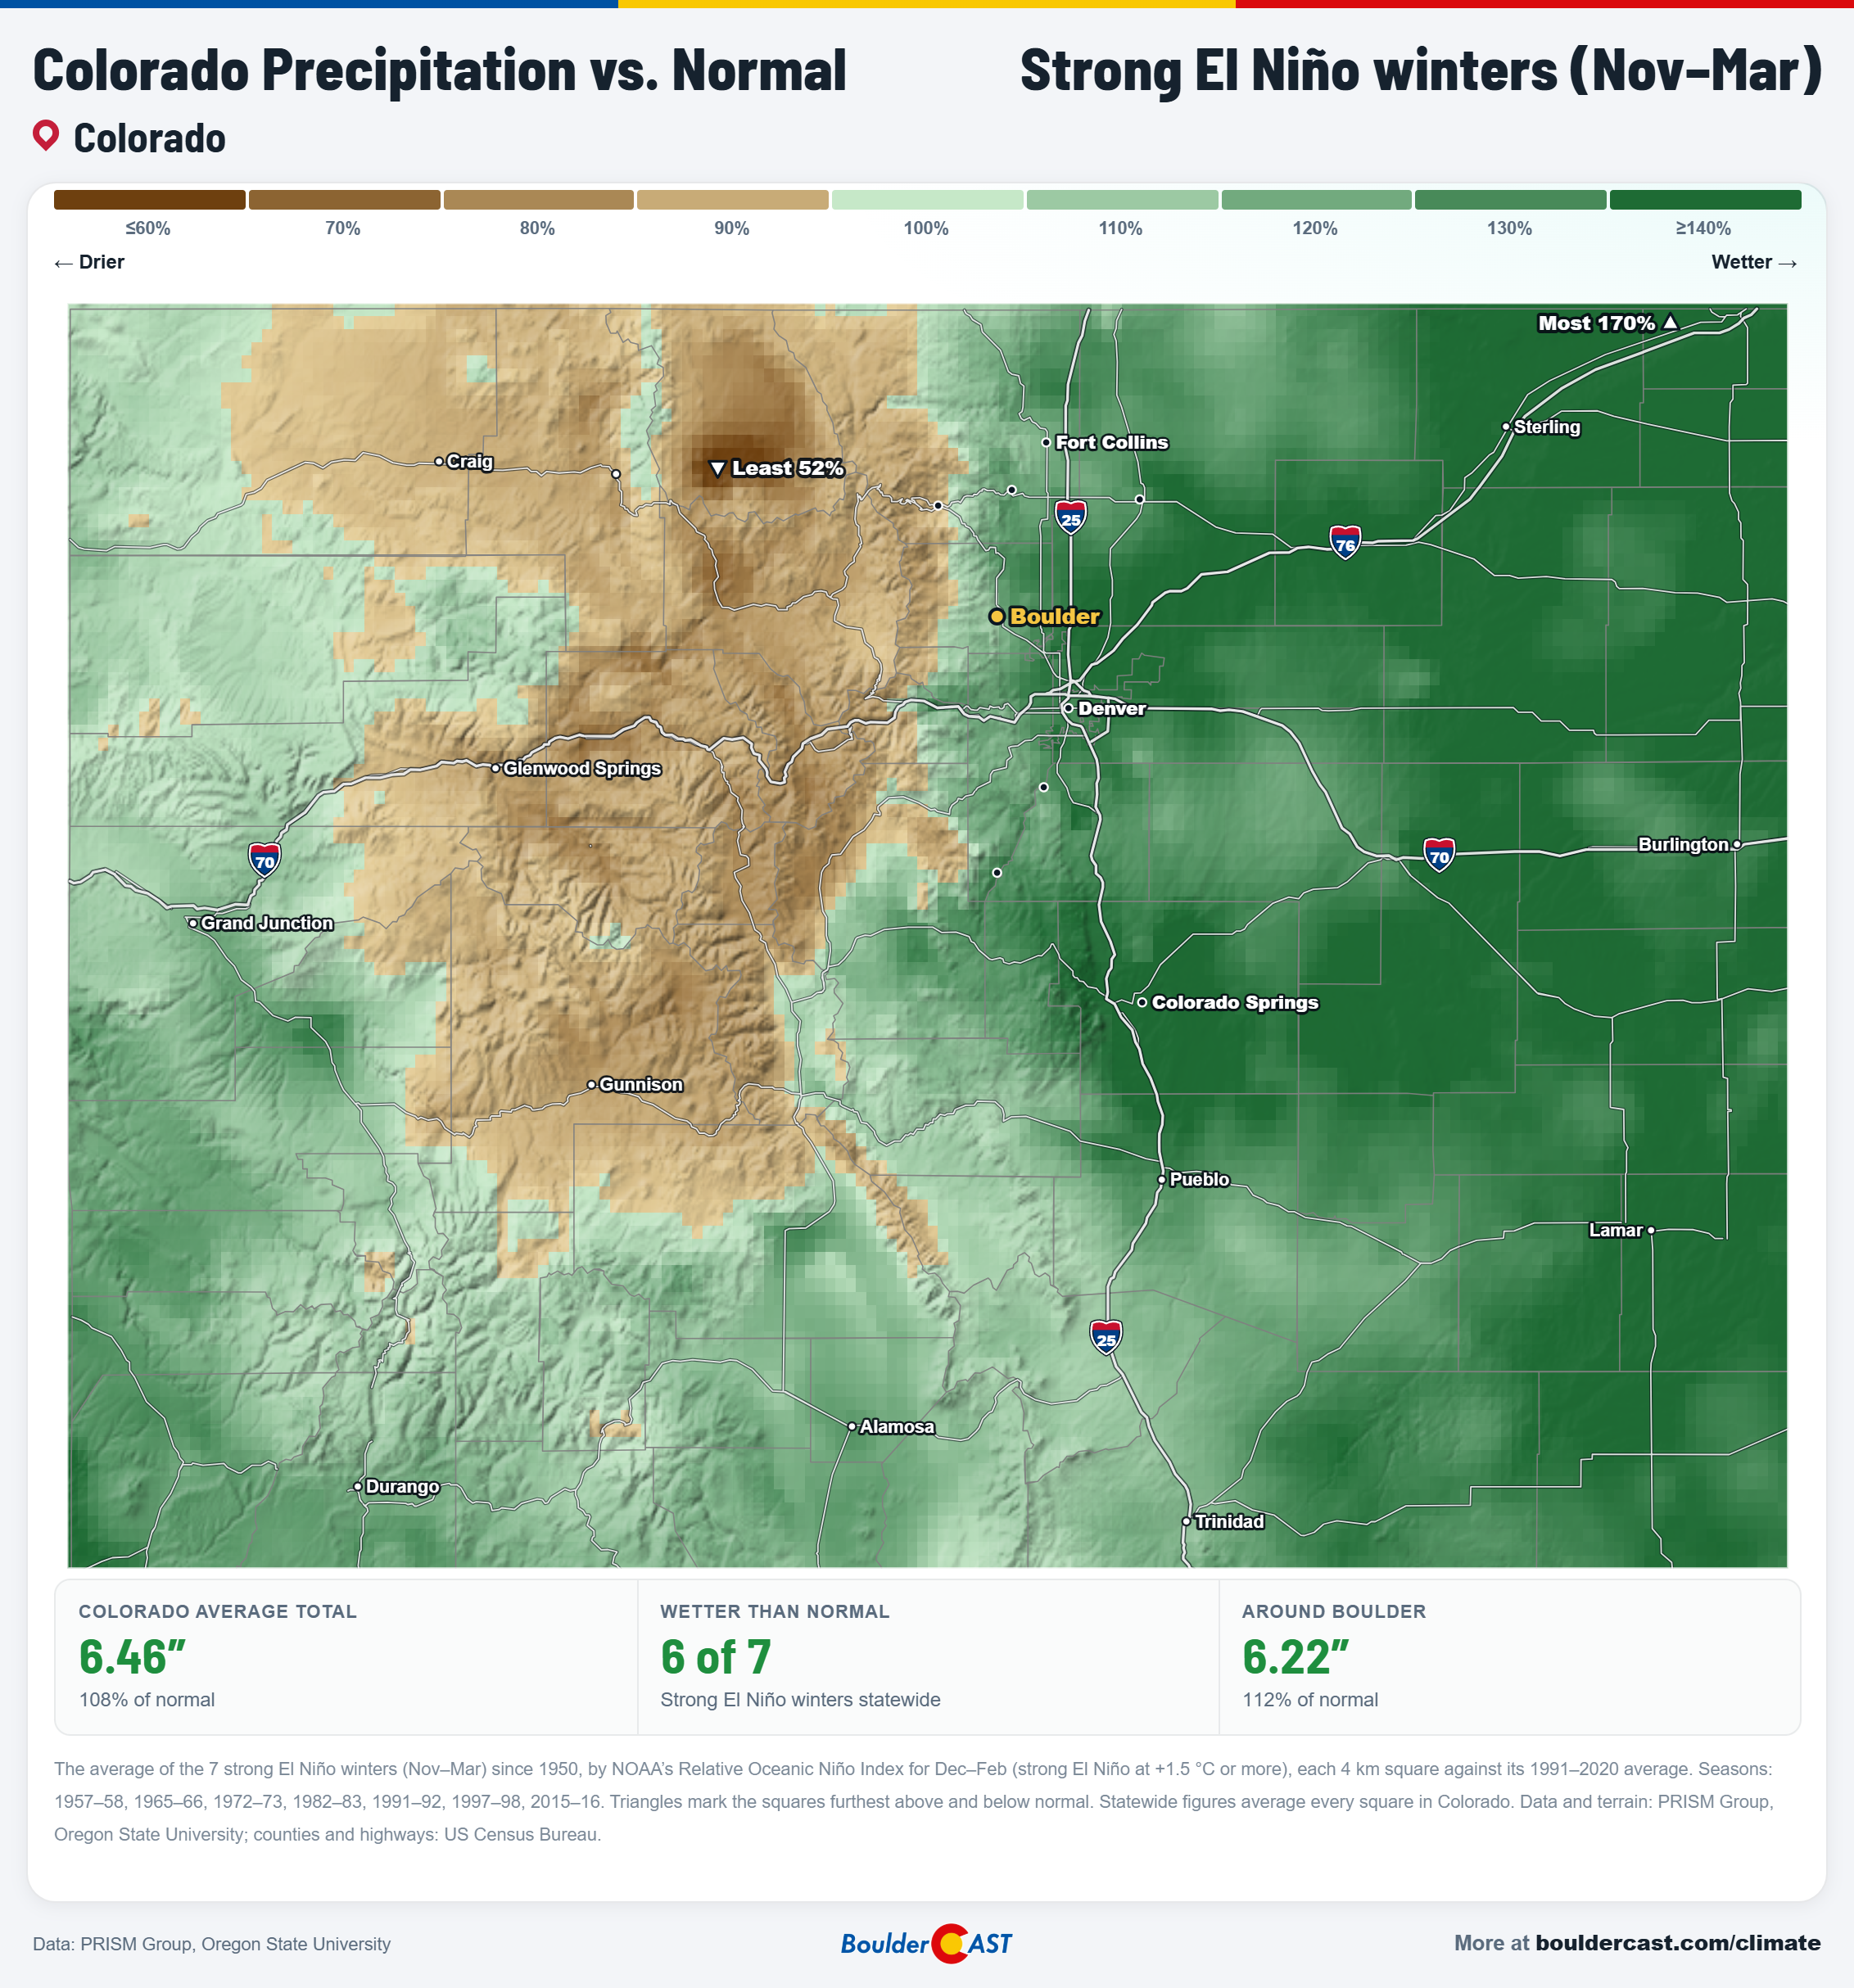
Colorado precipitation vs. normal during strong El Niño winters, November-March
The observed “state divided” pattern isn’t new at all; it’s practically the strong El Niño fingerprint:
- The eastern plains ran wet, topping 170% of normal in the northeast corner.
- Boulder and the Front Range came in a bit wetter than normal, with Boulder at about 112%.
- The northern and central mountains ran dry. The driest spot, near Steamboat, came in around 52% of normal.
- Statewide, 6 of the 7 strong El Niño winters were wetter than normal.
That’s a sobering reminder for the high country. El Niño storms often track too far south to give the northern mountains their usual fill of snow.
The timing matters, too. The heart of winter, December through February, has usually been the dry stretch along the Front Range, with Boulder near 73% of normal. November and especially March are what make up the difference. The fact that the first week of November is in the books and has been largely dry, and that the next week looks warm and dry too, doesn’t bode well.
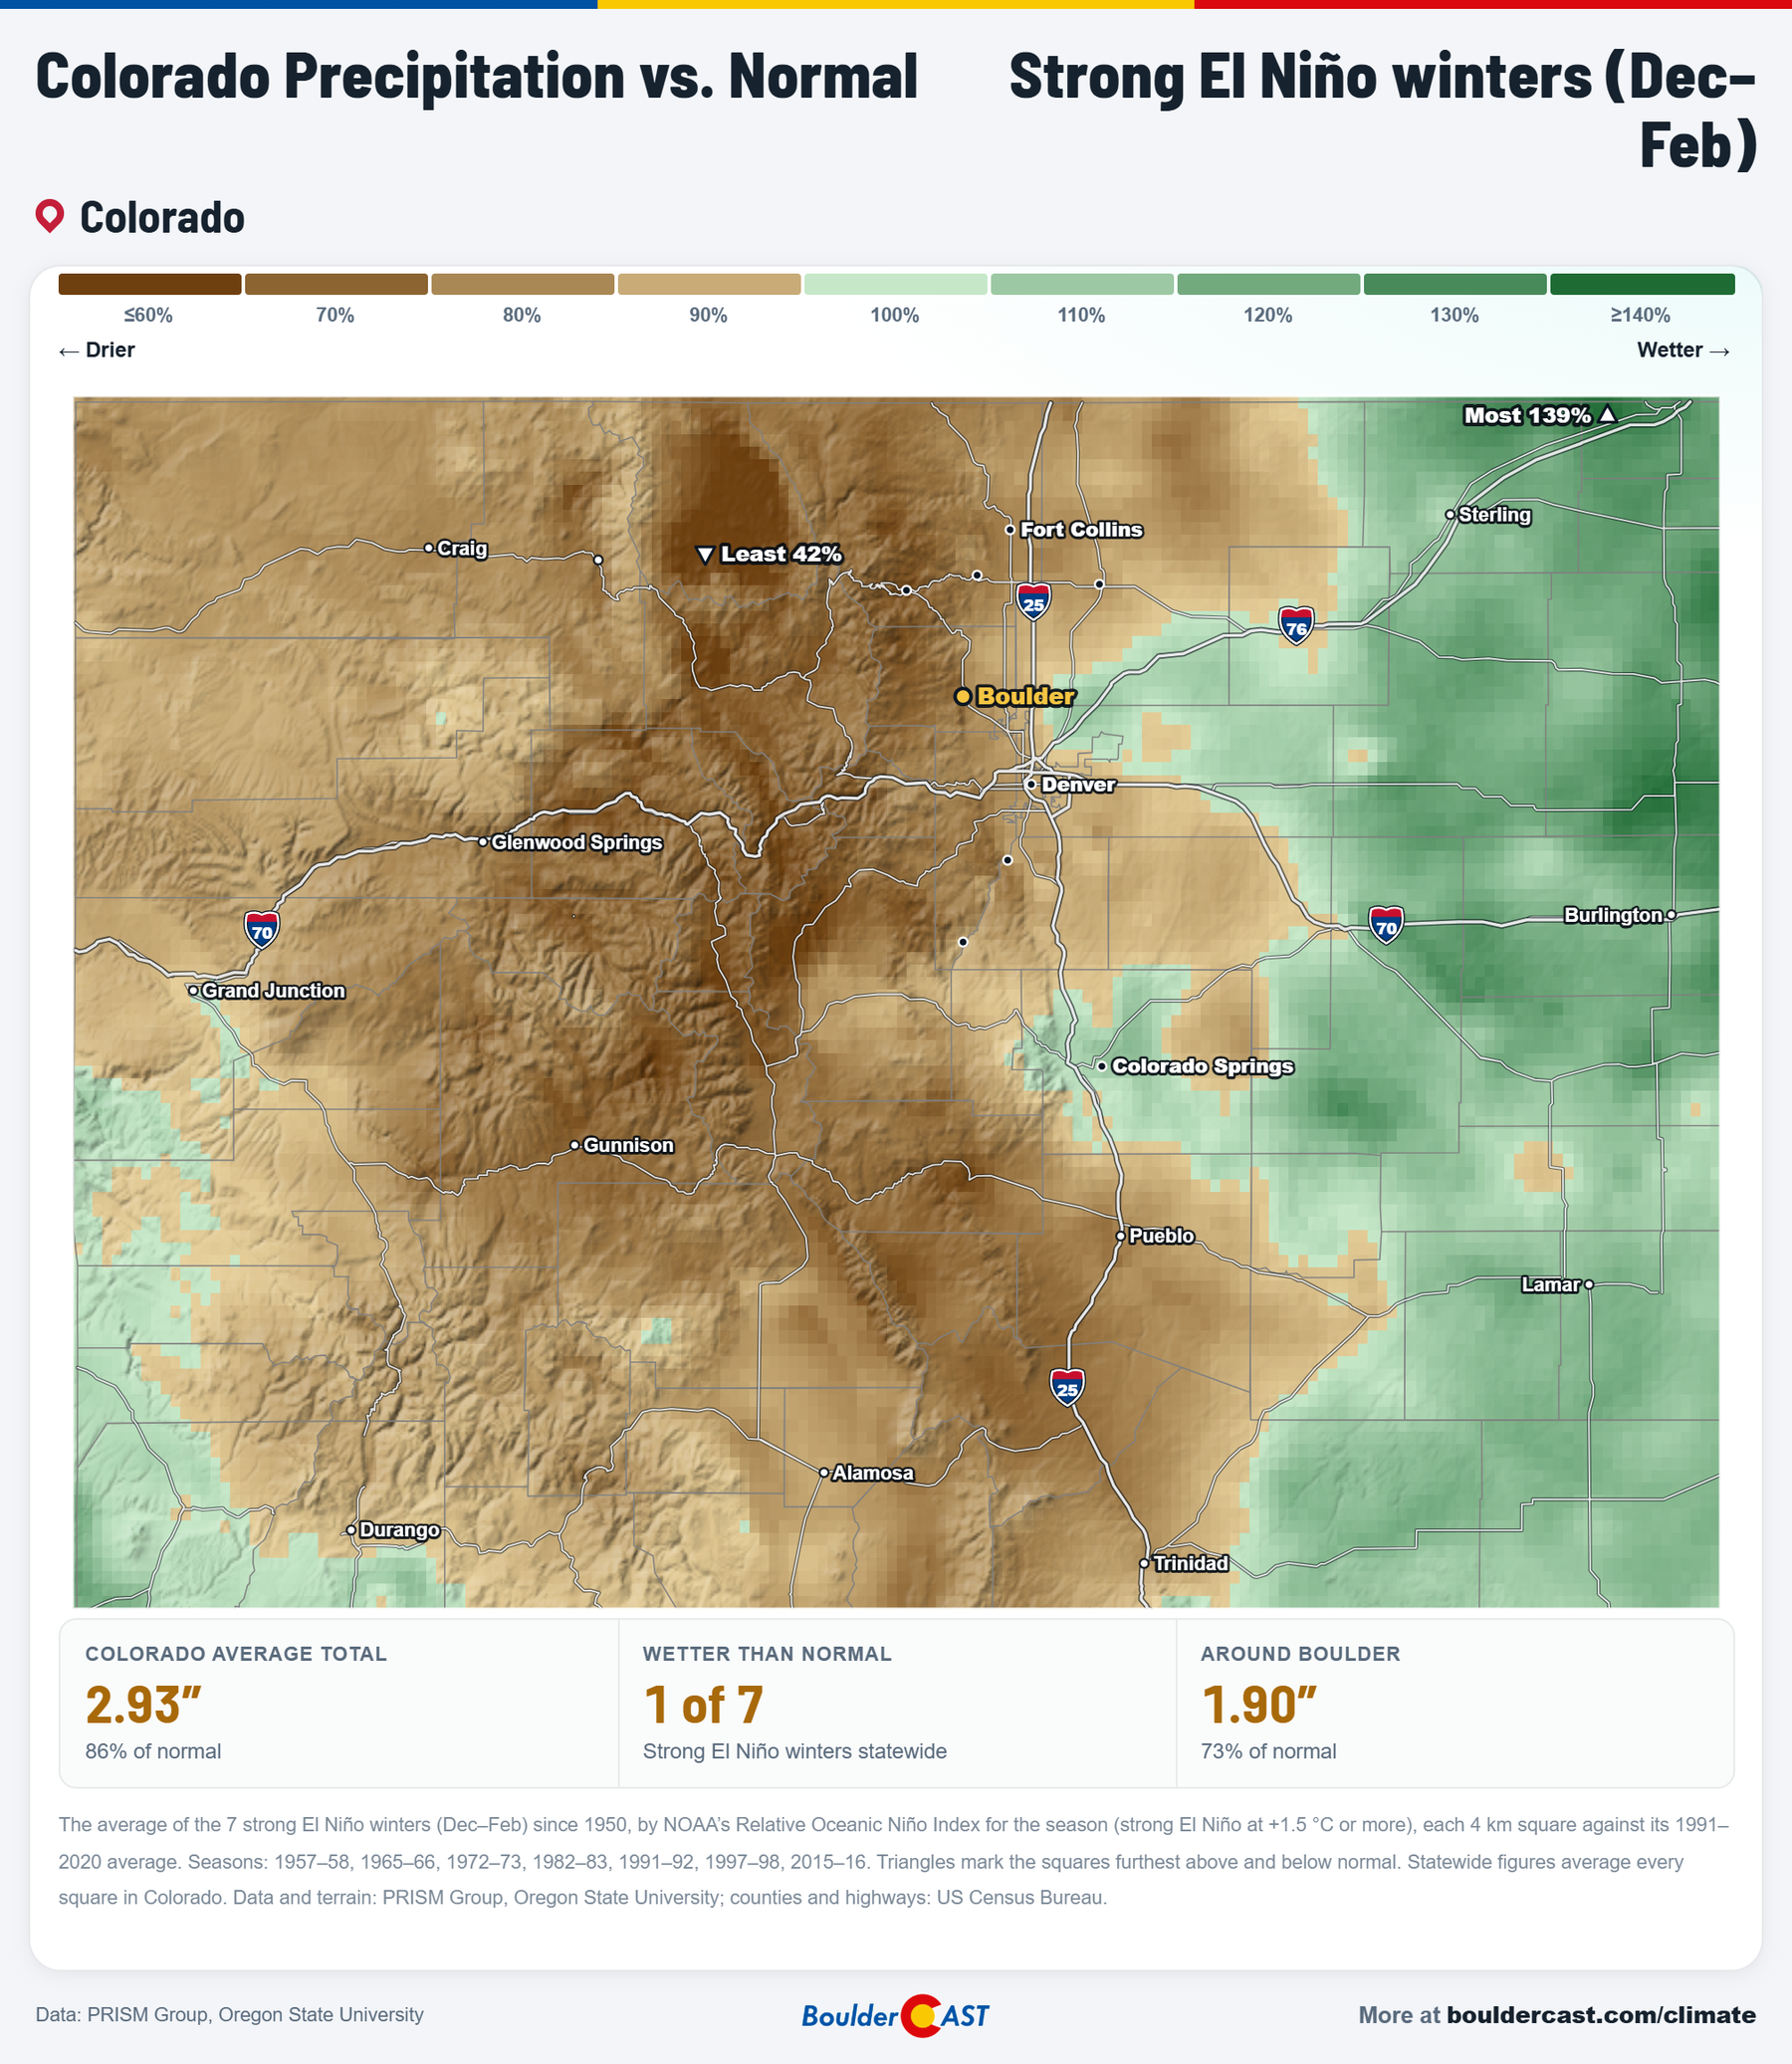
Colorado precipitation vs. normal during strong El Niño winters, December–February
Temperatures show a similar story. Strong El Niño winters ran about 1° cooler than normal statewide, and only 1 of the 7 was warmer. The chill was strongest west of the Divide and in the San Luis Valley, while Boulder came in a bit cooler than normal:
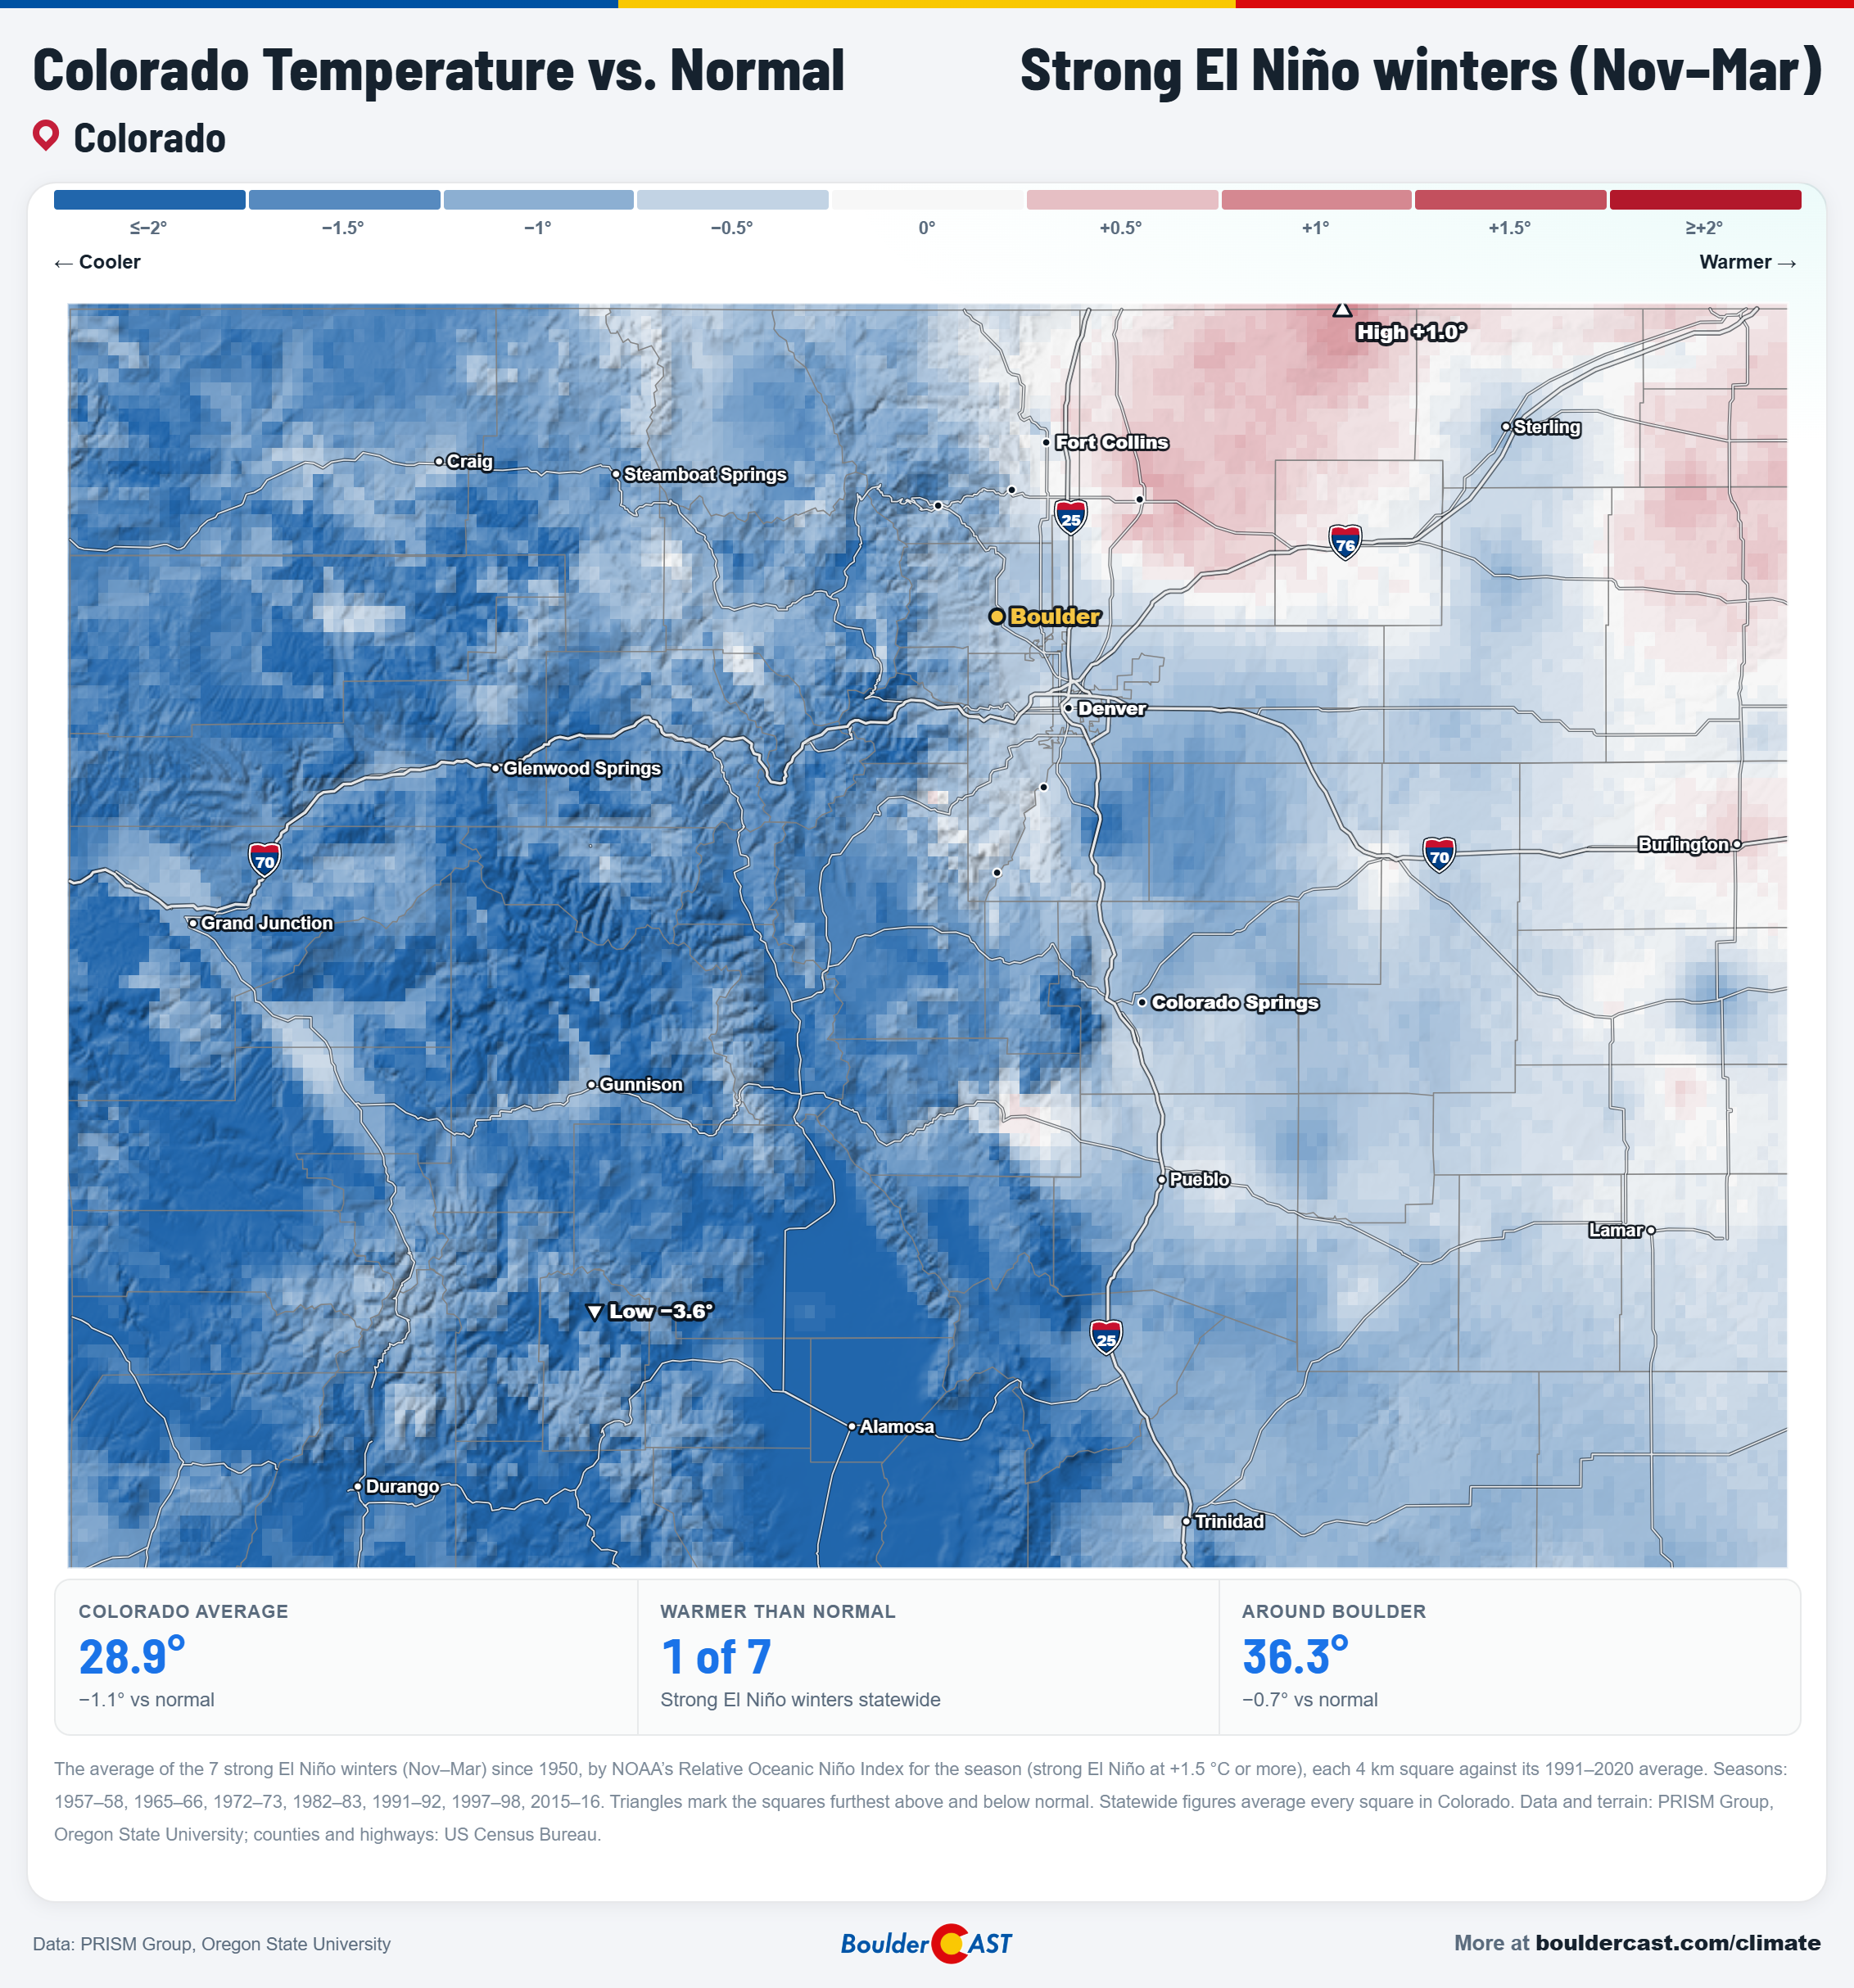
Colorado temperature vs. normal during strong El Niño winters, November-March
Boulder’s snow: feast or famine
Here’s Boulder’s seasonal snowfall plotted against each winter’s El Niño or La Niña strength:
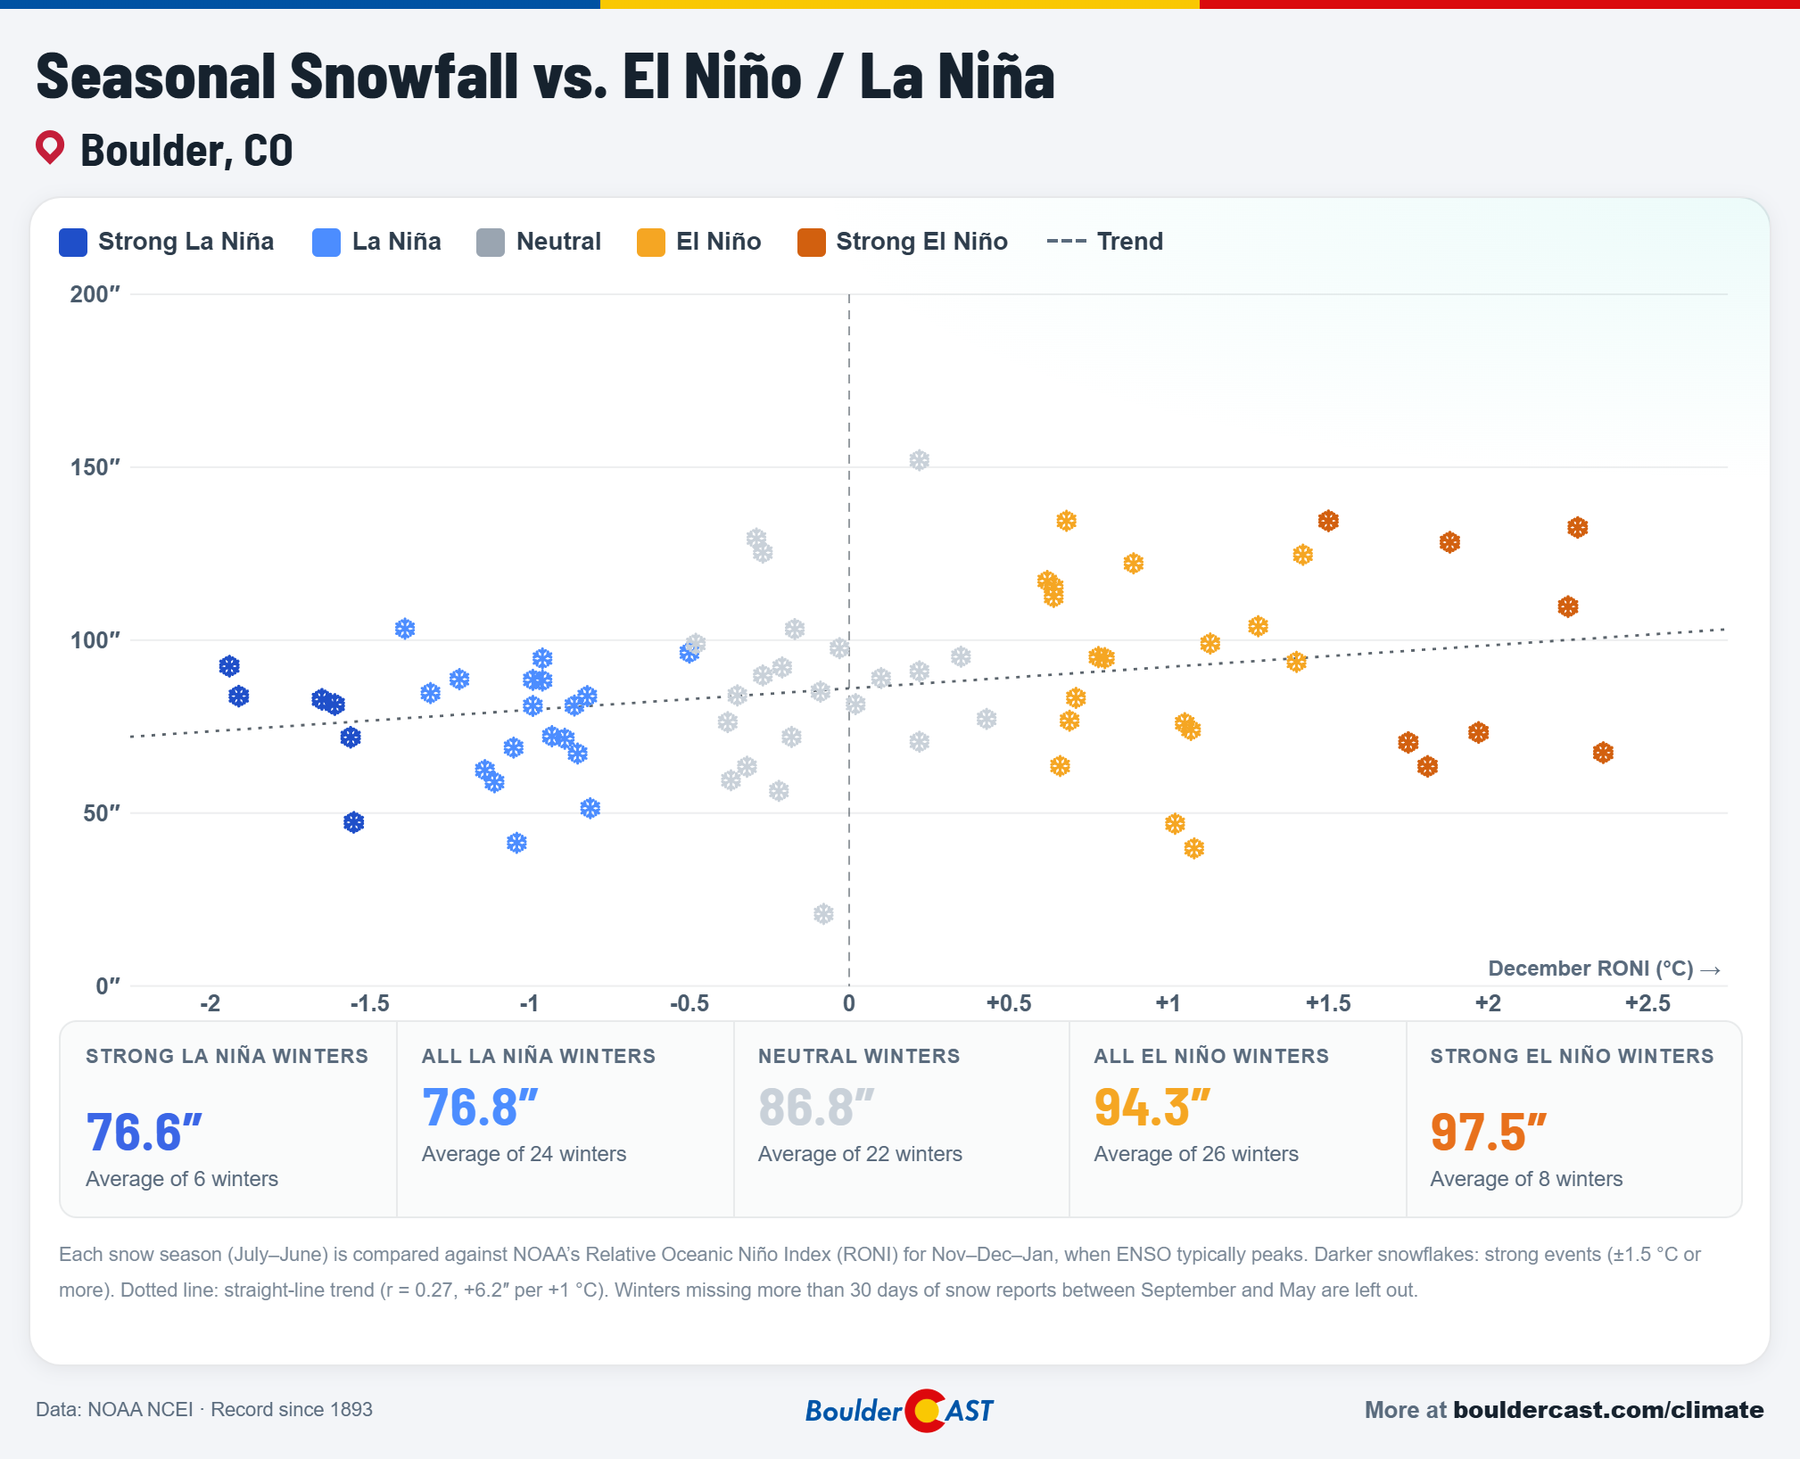
Boulder seasonal snowfall vs. El Niño and La Niña strength
On average, El Niño winters are good to Boulder: 94.3″ in all El Niño winters and 97.5″ in strong ones, compared with 76.8″ in La Niña winters. But look at the dark-orange strong El Niño snowflakes. They’re scattered all over the chart, from the 60s to the 130s.
That shows up clearly in the odds:
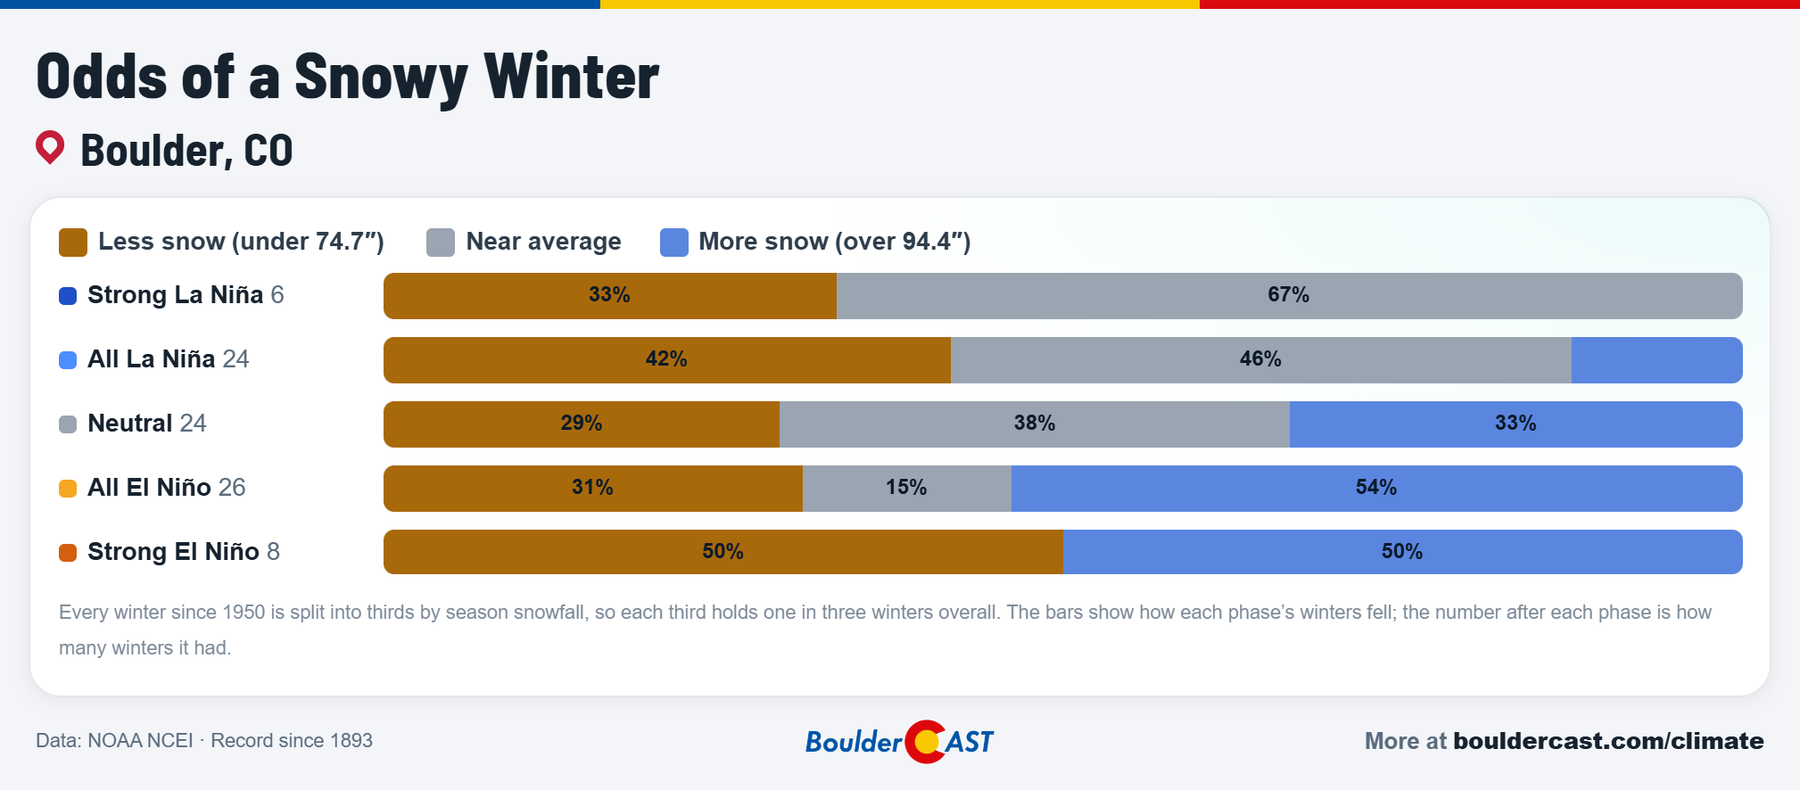
Odds of a snowy winter in Boulder by El Niño / La Niña phase
In strong El Niño winters, Boulder has landed in the least snowy third half the time and the snowiest third the other half. Not one has ended up near average. It’s truly feast or famine.
What tips the balance? Usually fall and spring. El Niño’s southern storm track is a natural fit for the big March and April upslope storms that deliver Boulder’s heaviest snow. In fact, 13 of Boulder’s 16 largest snowstorms since 1950 came in El Niño or El Niño-leaning winters. Think of the two 20-inch-plus March storms of 2021 and 2024, or the March 2016 blizzard that ended the last super El Niño winter with 16.4 inches in Boulder. That’s exactly when the models show their strongest wet signal for the Front Range this year.
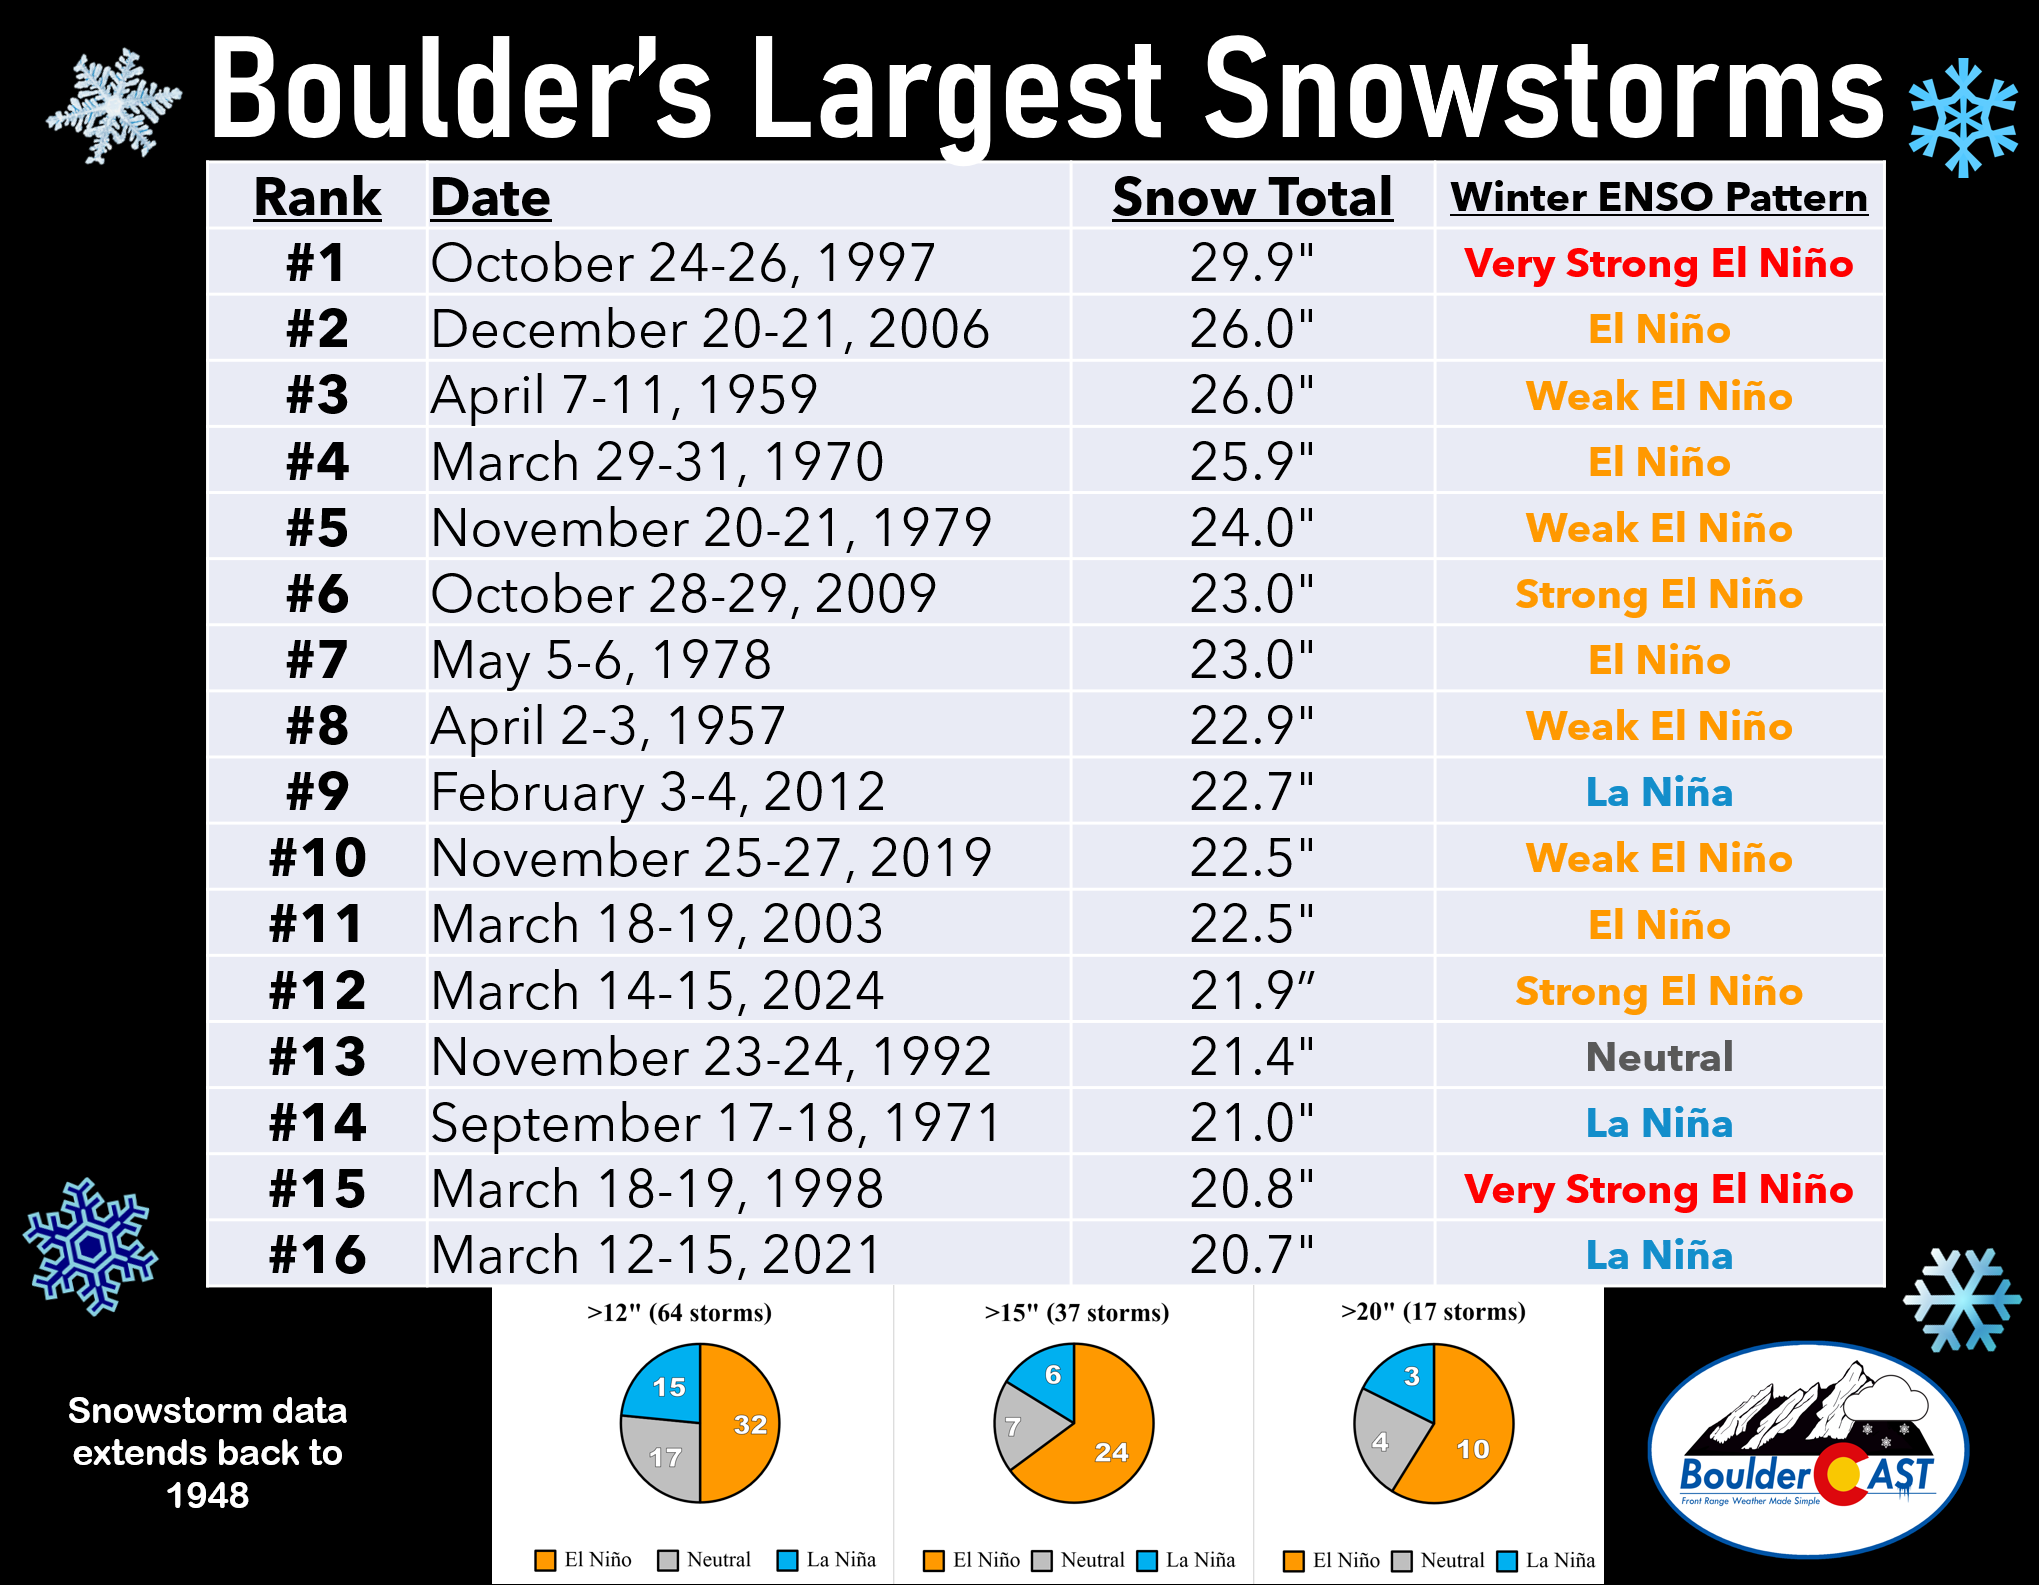
Analog winters
Finally, here are the past winters that were in the most similar spot to this one at the same time of year:
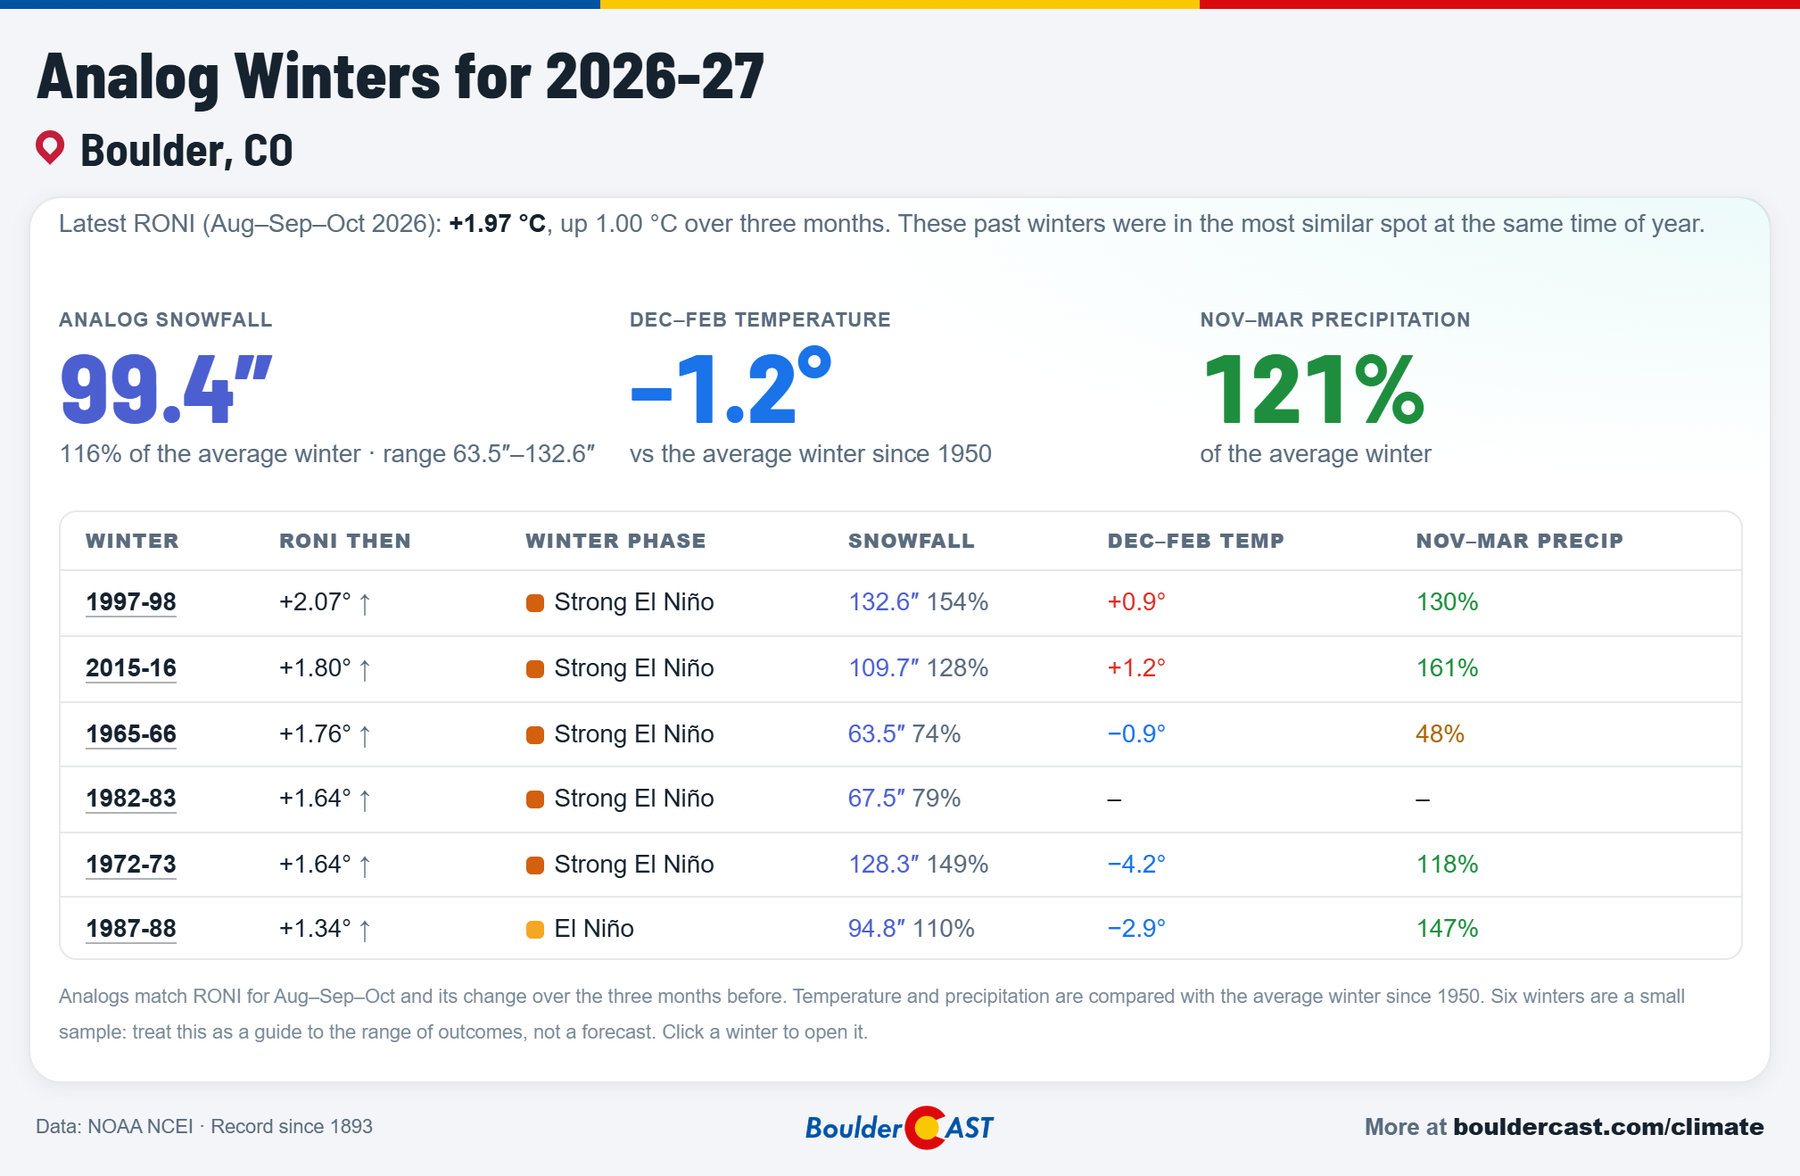
Analog winters for 2026–27 in Boulder, solely based on the RONI
The six analogs averaged 99.4″ of snow in Boulder (116% of normal) and 121% of normal November–March precipitation. The range is huge, though: 1997–98 brought 132.6″ and 1965–66 just 63.5″. As always, six winters is a small sample. Treat it as a guide to what’s possible, not a forecast.
Our official winter outlook
So what does we actually expect? To make our call, we blended the two pieces of evidence in this post: what the 10 models say and what happened in past strong El Niño winters. The models count a bit more for precipitation, where they’ve shown some skill here, and the two count equally for temperature.
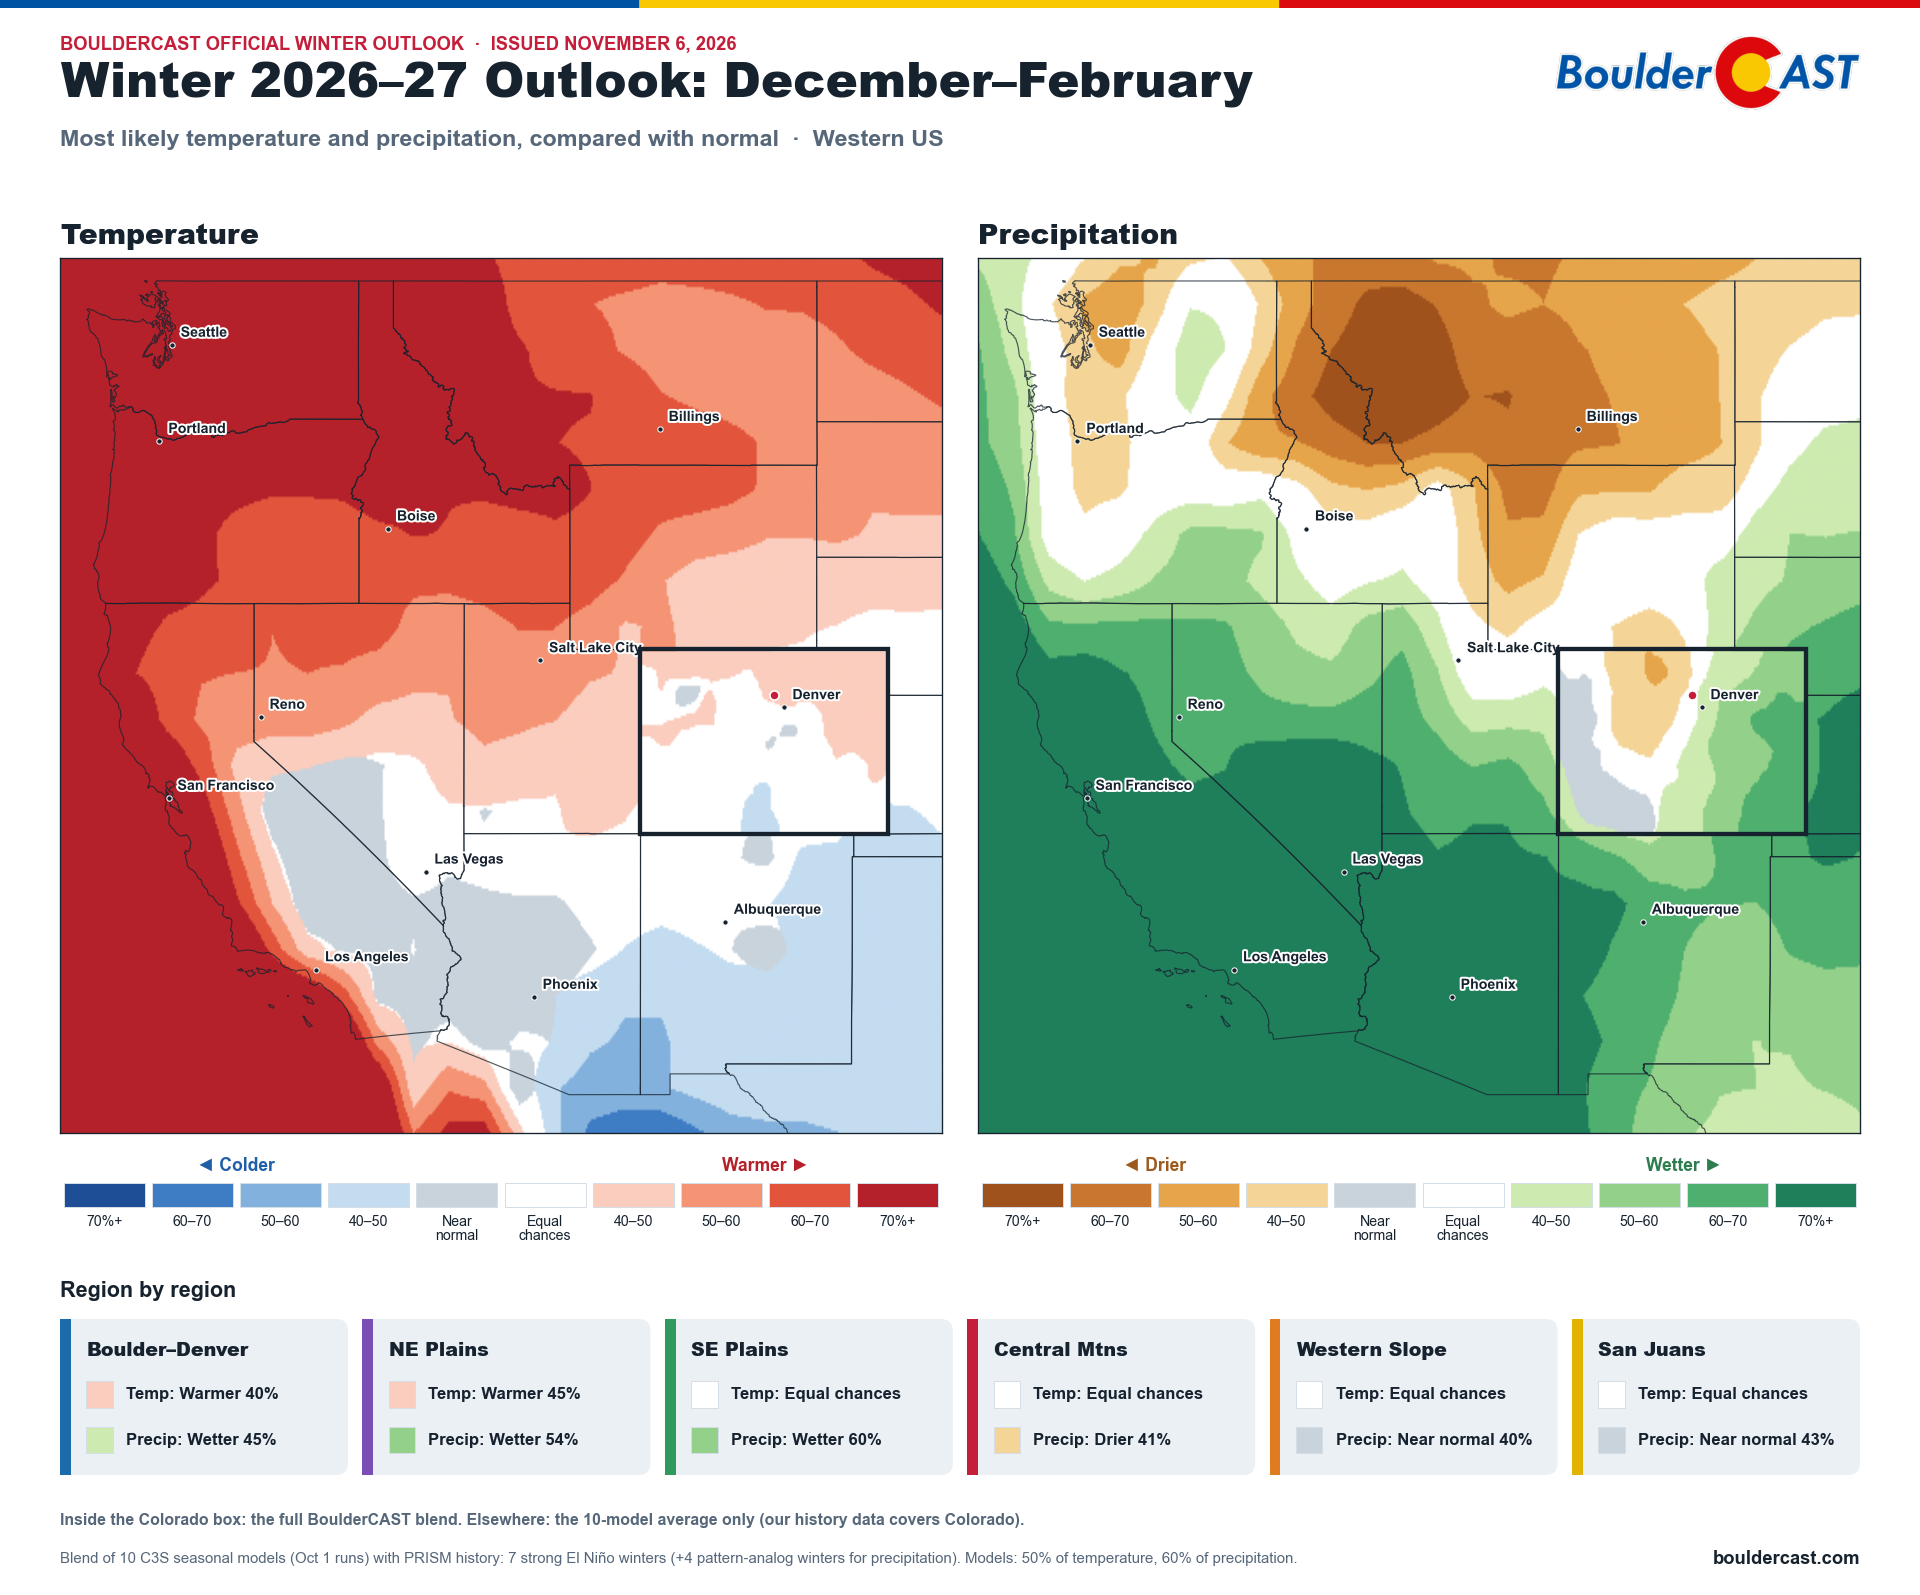
Here’s the result for the heart of winter, December–February:
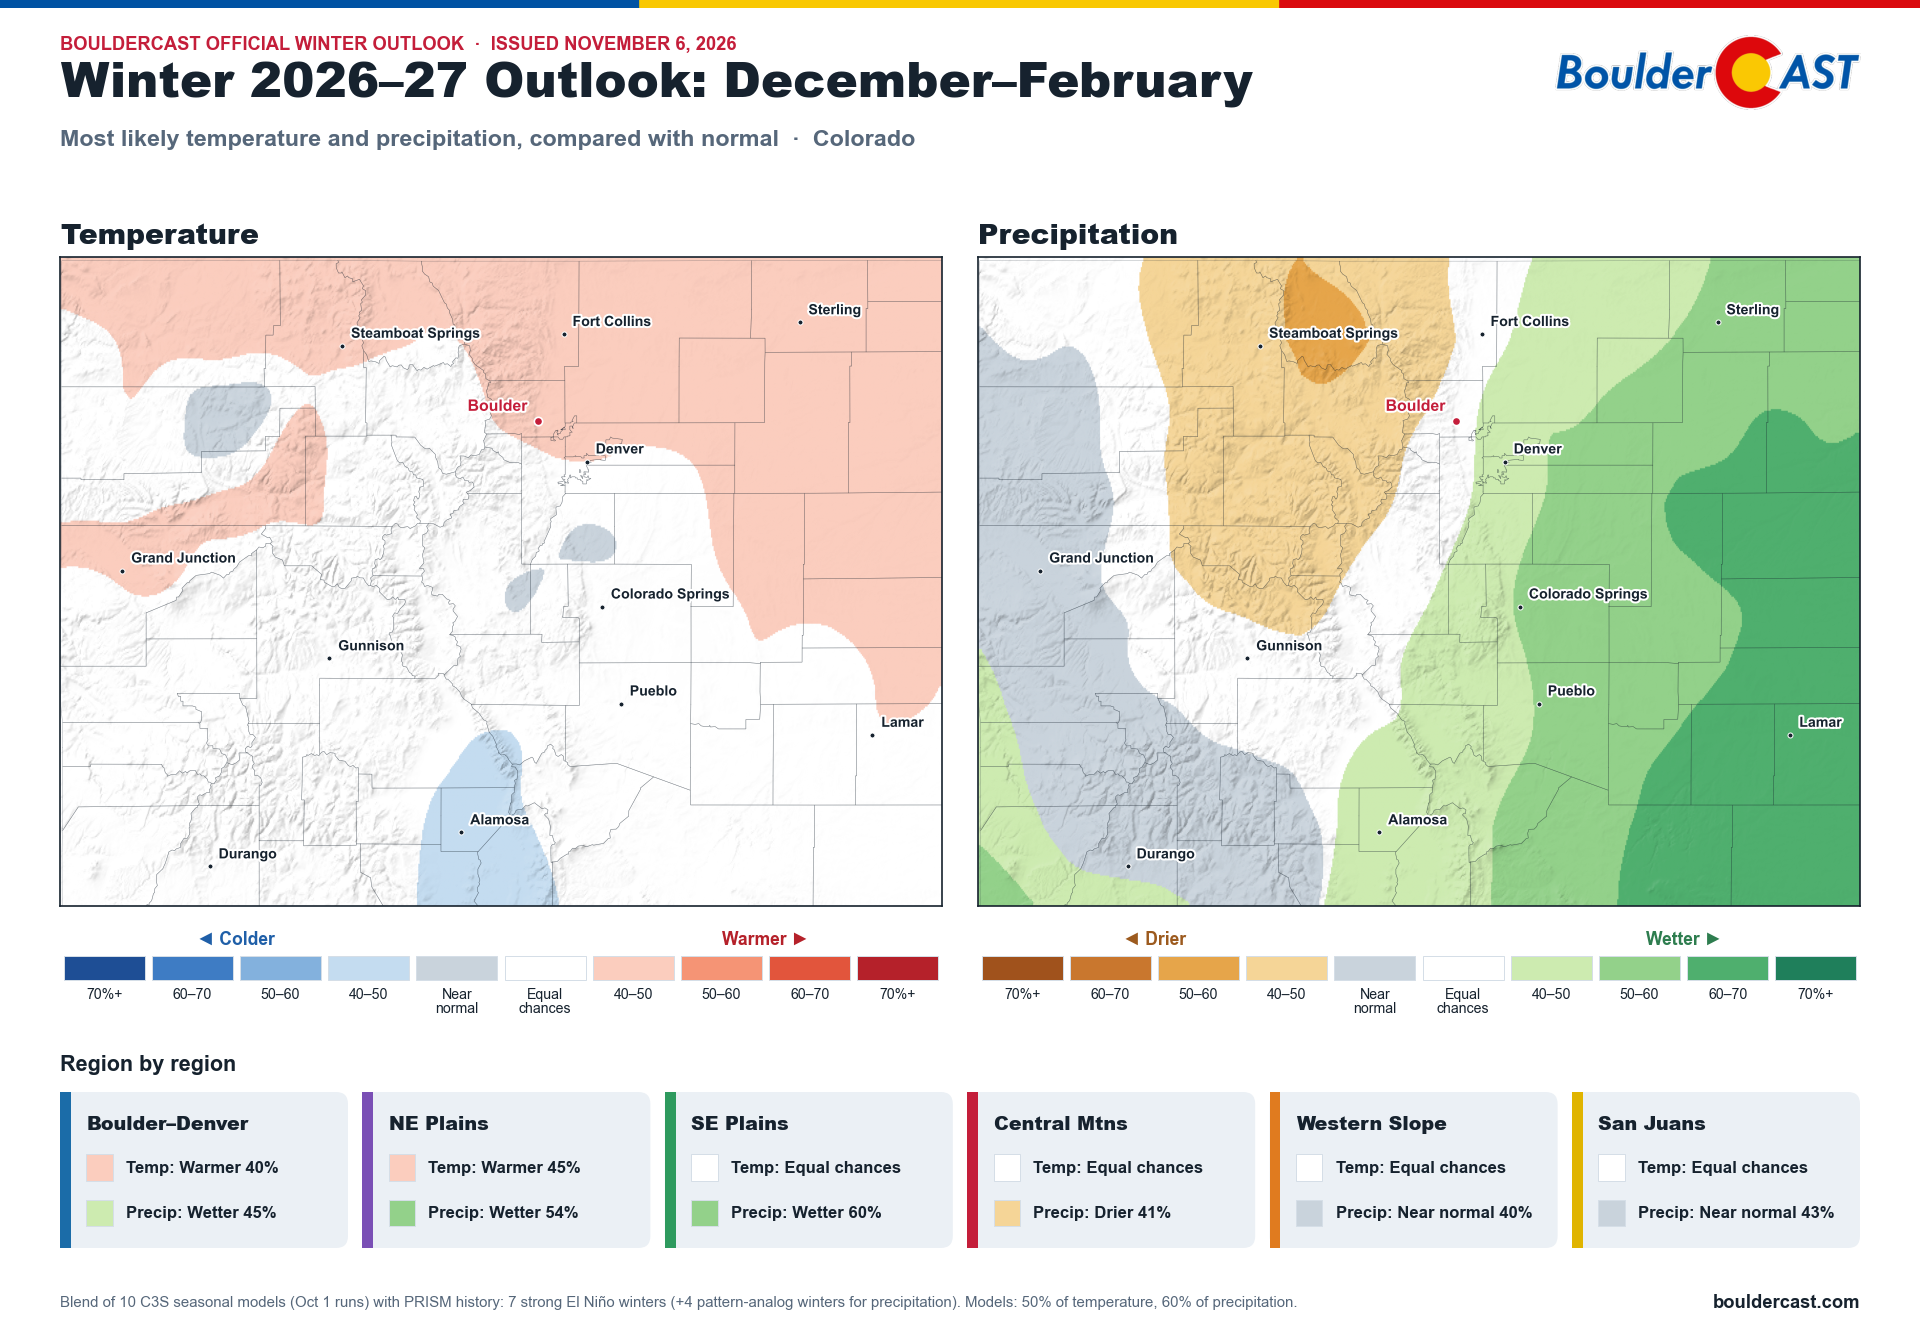
BoulderCAST official winter outlook for Colorado, December–February 2026–27: most likely temperature and precipitation
And for the full November–March season:
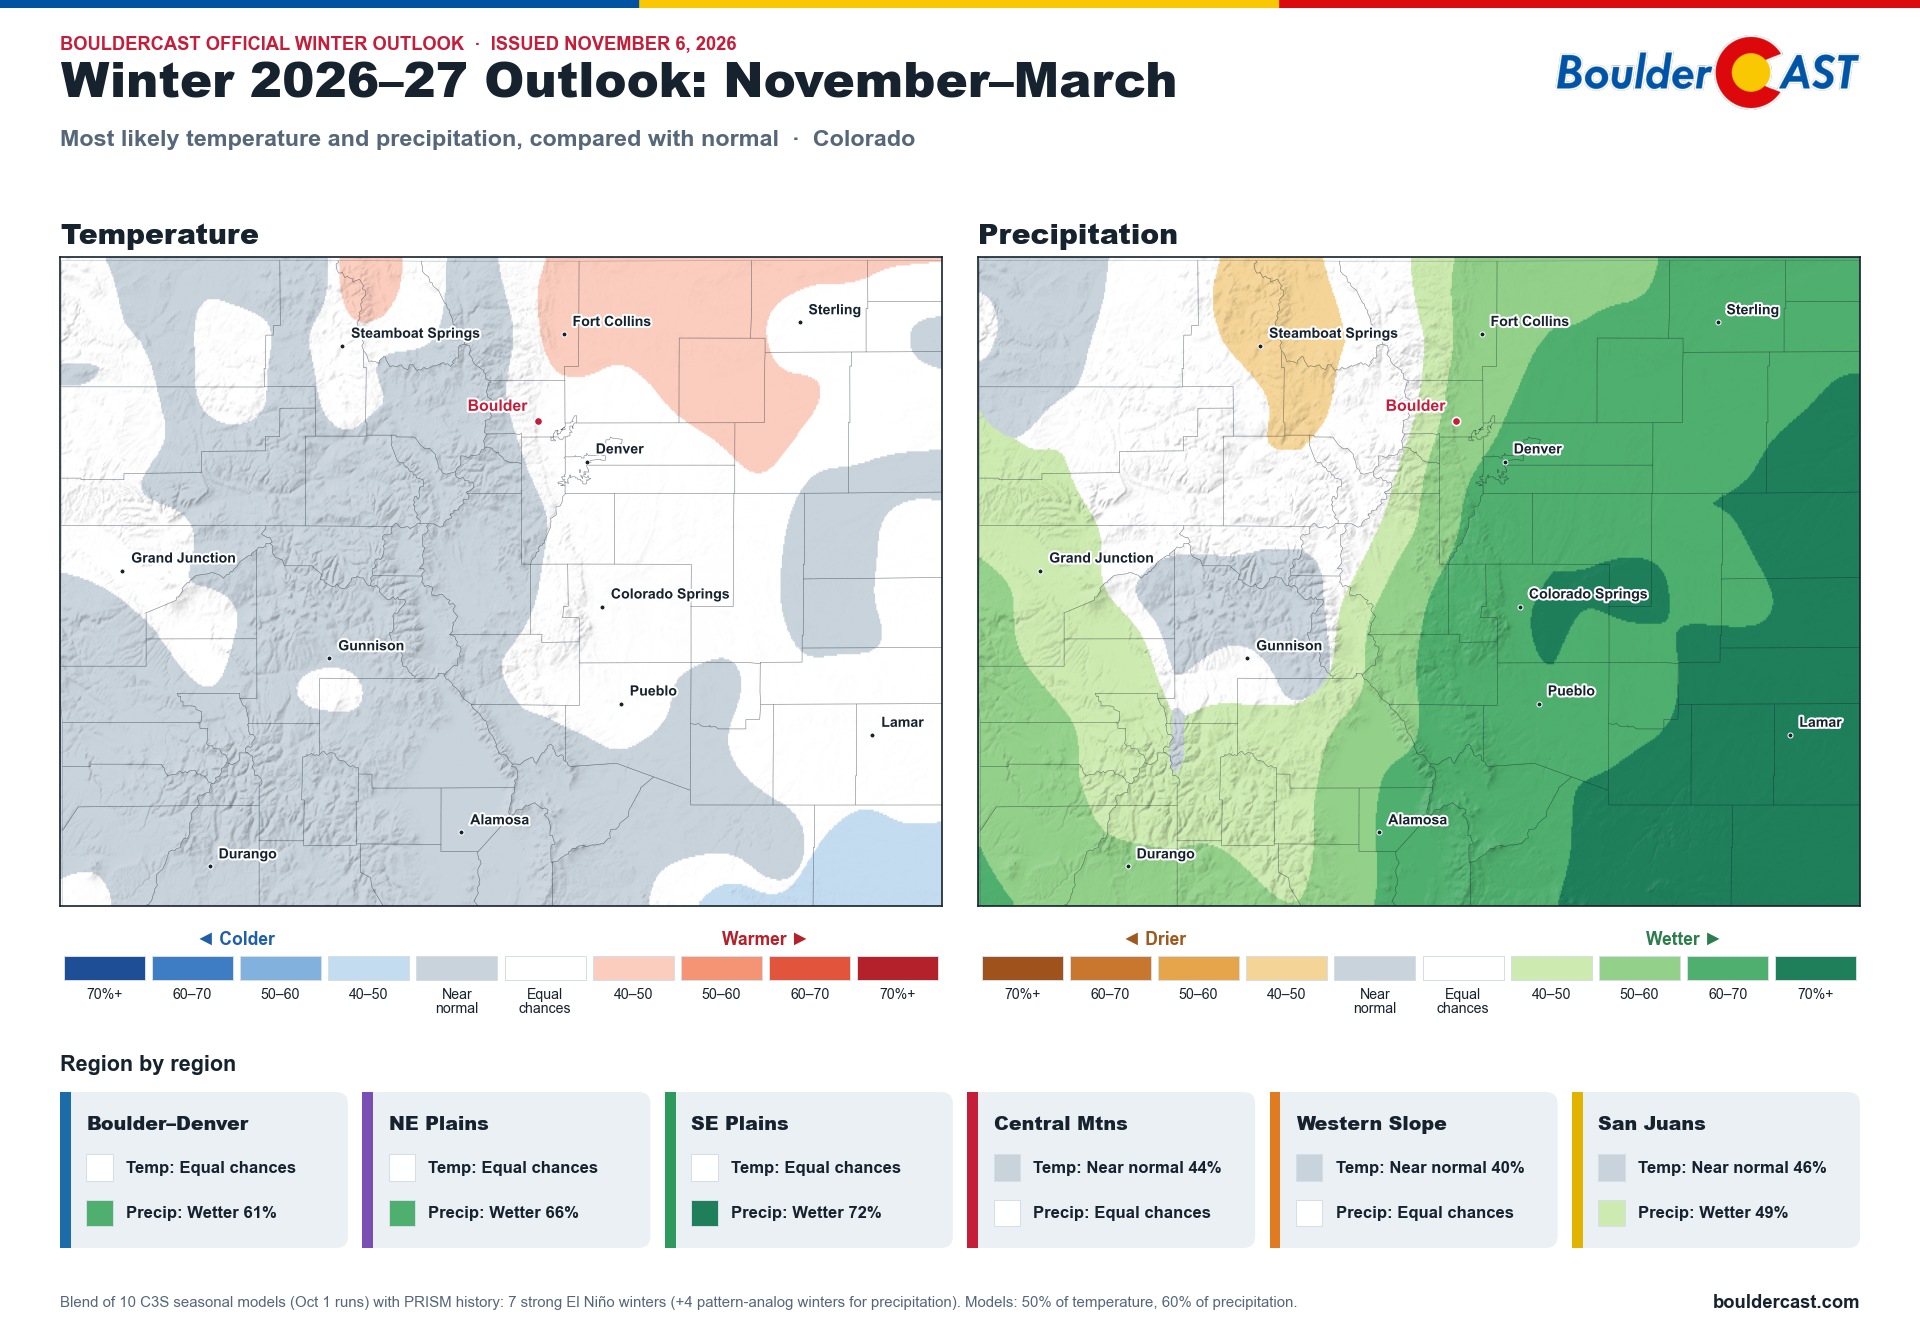
BoulderCAST official winter outlook for Colorado, November–March 2026–27: most likely temperature and precipitation
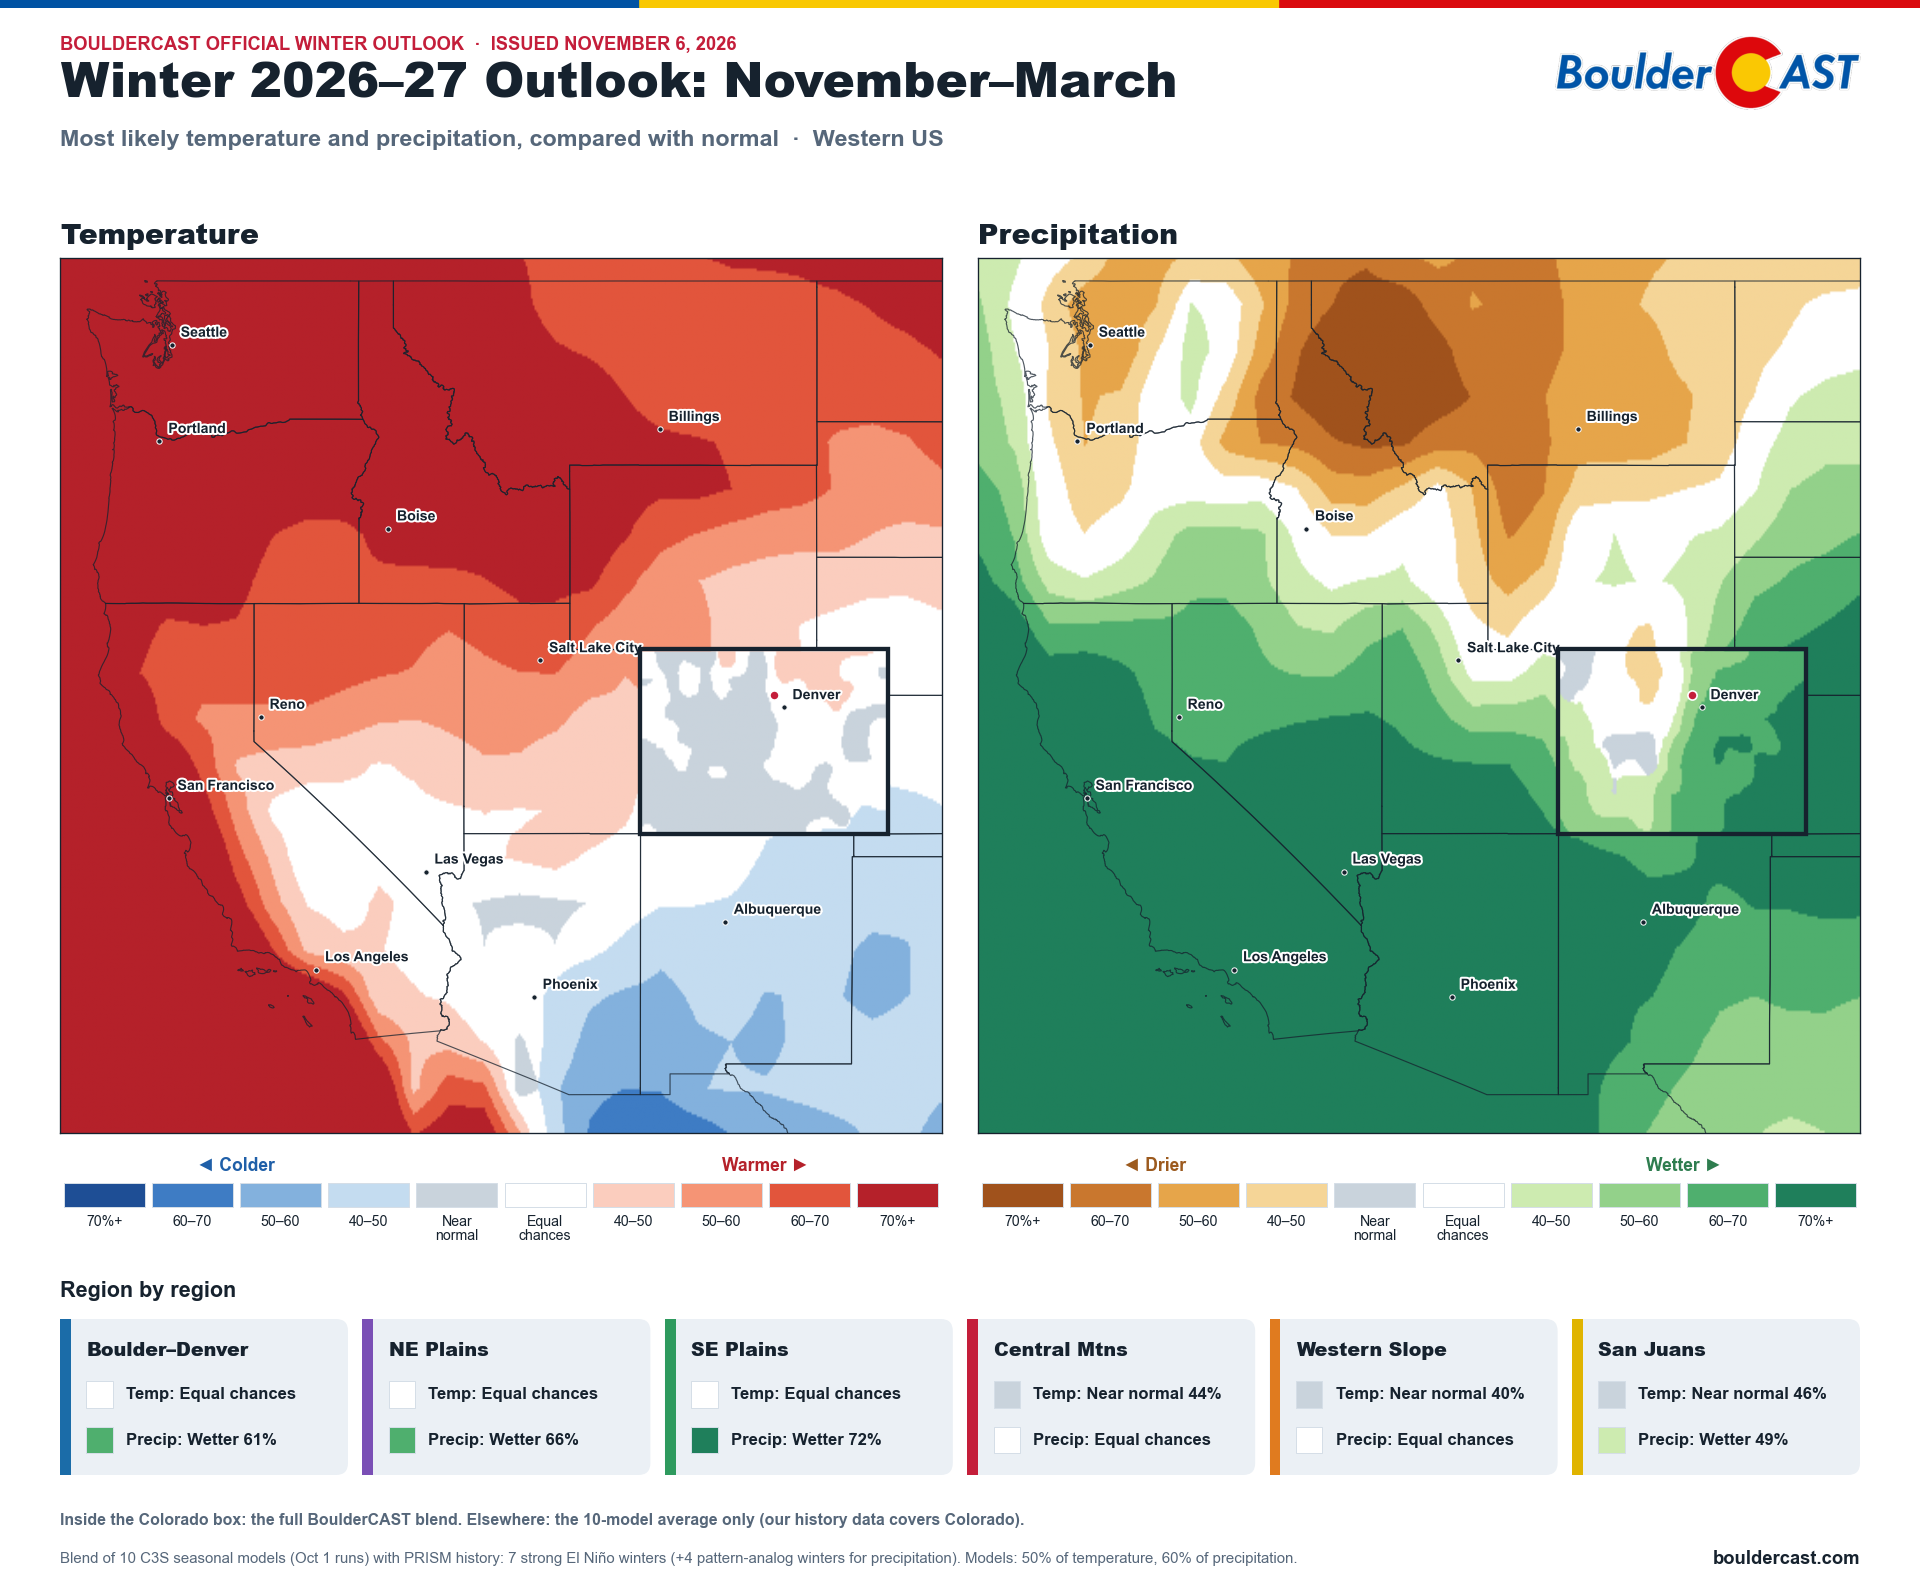
How to read these: the color shows which outcome is most likely, and the darker the shade, the more confident the call. White means equal chances: no strong lean either way. Gray means near normal is the most likely outcome.
- The plains are our most confident call: wetter than normal. Both the models and history agree. For November–March, the odds of a wetter-than-normal season run 66% on the northeast plains and 72% on the southeast plains.
- Boulder–Denver leans wetter, modestly in the heart of winter (45%) and more clearly over the full season (61%). The key period to watch is late winter and into spring.
- The northern and central mountains lean drier in December–February, the classic strong El Niño pattern. Over the full season, they even out to roughly equal chances.
- Temperatures don’t have a strong signal. There’s a slight warm lean along the northern Front Range and plains in midwinter, and near normal or equal chances most everywhere else.
The bottom line
- The El Niño: very likely to peak this December or January as one of the strongest on record, and possibly the strongest. The European model has the 3-month index above +3 °C, well past any event since 1950. NOAA gives 70–83% odds of beating every event since 1950.
- The West: an exceptionally wet winter is favored for California and the Southwest, with a dry lean for the northern Rockies.
- Colorado: the forecast lines up well with strong El Niño history.
- The eastern plains and southern mountains lean wet.
- The northern and central mountains are on the dry or neutral side.
- Boulder–Denver is in between: near normal through mid-winter, then tilting wetter into late winter and March. Overall, the models give it about a 3-in-4 chance of a wetter-than-normal November–March.
- Late winter on the Front Range is also where the models have their best track record, which makes that wet tilt a bit more believable. This is good news.
- Boulder snow: history says strong El Niño winters are feast or famine here for snowfall, and spring storms usually decide which. With Boulder County still in extreme drought after a warm, dry and snowless October, we’ll take all the spring upslope we can get. 🤞
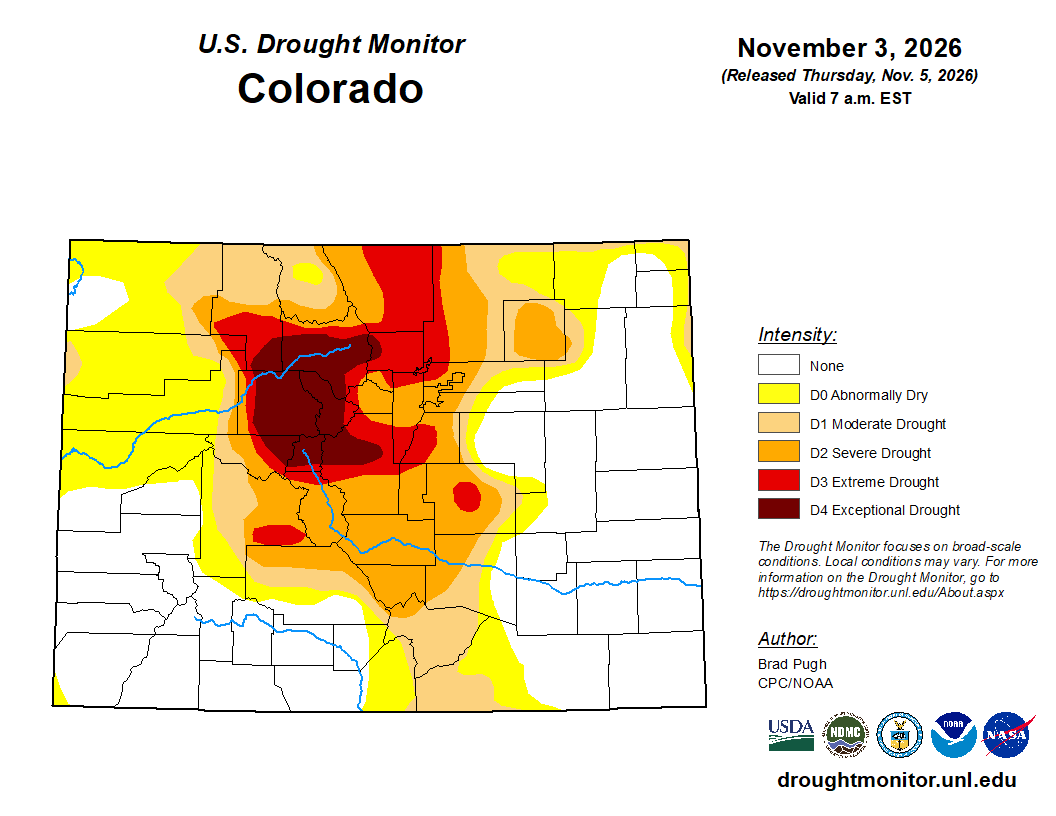
A seasonal outlook is a weighted coin, not a forecast for any given day. Even a record El Niño only shifts the odds of how the season adds up. It can’t tell us whether December brings a parade of upslope snows or a string of dry, windy weeks, and in the Denver Metro area a single big March storm can make or break the whole winter. What it does give us is an unusually lopsided coin, tilted toward a wetter winter for the Plains and the Front Range. After a water year that tied for Boulder’s driest on record, that’s a bet worth rooting for.
Want to dig deeper? Every El Niño chart in this post, and many more, lives in the El Niño & La Niña section of our Colorado Climate Hub.
Spread the word, share our crazy Colorado weather:
Go Premium, get all the perks.
Daily Forecast Updates
Get our daily forecast discussion every morning delivered to your inbox.
All Our Model Data
Access to all our Colorado-centric high-resolution weather model graphics. Seriously — every one!
Ski & Hiking Forecasts
6-day forecasts for all the Colorado ski resorts, plus more than 120 hiking trails, including every 14er.
Smoke Forecasts
Wildfire smoke concentration predictions up to 84 hours into the future.
Exclusive Content
Weekend outlooks every Thursday, bonus storm updates, historical data and much more!
No Advertisements
Enjoy ad-free viewing on the entire site.





Leave a Reply
You must be logged in to post a comment.