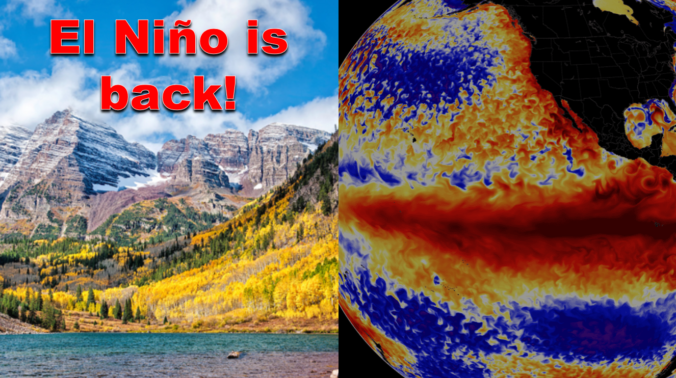
After enduring three consecutive La Niña winters, El Niño has taken over the globe once again intensifying in unusually rapid fashion. As of writing in mid-October, a strong El Niño is underway with impacts that will stretch globally in the months to come. We take a look at the current state of ENSO and what to expect from Mother Nature this winter across the Front Range lower elevations and Mountains.
Key Highlights from This Post:
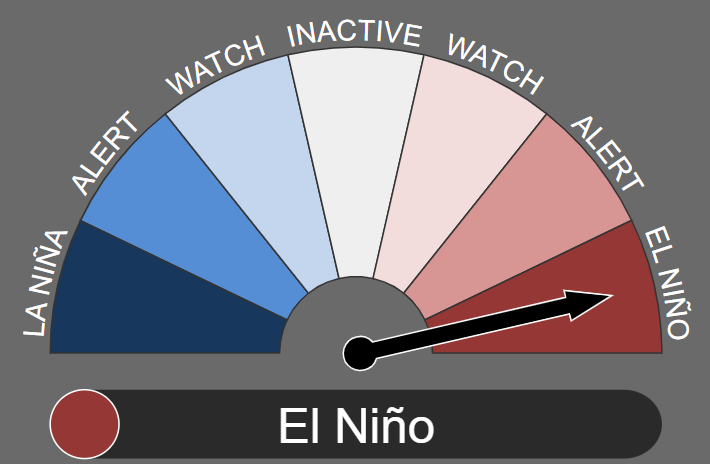
- A moderate to borderline strong El Niño is already roaring in the tropical Pacific Ocean and is expected to linger through the upcoming winter with global impacts even here in Colorado
- Due to El Niño, we anticipate a higher chance of “big” snowstorms throughout the entire winter as well as slightly above normal snowfall overall
- Typically El Niños would trend cool and wet (snowy) for us in the autumn, but long-range forecast guidance is at odds with historical trends
- For the rest of 2023, we expect in general near normal temperatures and slightly above normal precipitation (snowfall) for northeast Colorado, though confidence is low

Go Premium, get all the perks.
Daily Forecast Updates
Get our daily forecast discussion every morning delivered to your inbox.
All Our Model Data
Access to all our Colorado-centric high-resolution weather model graphics. Seriously — every one!
Ski & Hiking Forecasts
6-day forecasts for all the Colorado ski resorts, plus more than 120 hiking trails, including every 14er.
Smoke Forecasts
Wildfire smoke concentration predictions up to 72 hours into the future.
Exclusive Content
Weekend outlooks every Thursday, bonus storm updates, historical data and much more!
No Advertisements
Enjoy ad-free viewing on the entire site.
El Niño is back, baby! Wait, what’s El Niño?
Just in case you forget or need a reminder, El Niño is associated with warmer than normal ocean temperatures in the tropical Pacific Ocean, with weakened (or even reversed) easterly trade winds along the Equator and a shift of the warmest waters eastward towards South America.
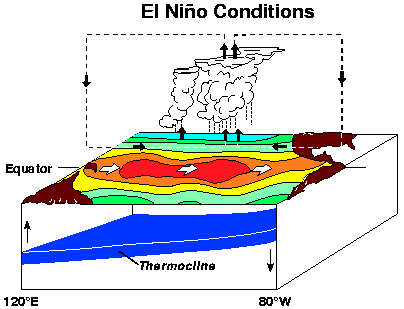
Large-scale upward motion in the atmosphere and the resulting thunderstorm development along the Equator follow this warm pool of ocean water eastward. This creates two convective loops across the expansive Pacific Ocean (shown above). These are just the localized effects of El Niño. Our atmosphere and ocean are intimately coupled on a global scale. As such, locations all around the world, including Colorado, are influenced by ENSO. This is the topic of today’s discussion!
Tracking El Niño
To keep eyes on ENSO, researchers have deployed large arrays of buoys throughout the Pacific to monitor ocean temperatures at the surface and deep below. The most widely accepted/correlated temperature measurements come out of a region known as Niño 3.4 (shown below). Temperature measurements from in this area are used to determine the Oceanic Niño Index (ONI) to characterize the current state of ENSO, with an ONI > 0.45 indicating an El Niño (which is a warm anomaly), an ONI < -0.45 categorized as La Niña (which is a cold anomaly), and an ONI in between those levels coined as ENSO-Neutral.
The 3.4 Niño region in the Pacific Ocean. This area is heavily monitored by humanity in order to keep tabs on ENSO
Scientists have been tracking the ONI since the mid-20th century. The table below shows three-month running average ONI values over the last 20 or so years. Five of the last seven winters have been La Niñas, including the last three in a row which is highly unusual.
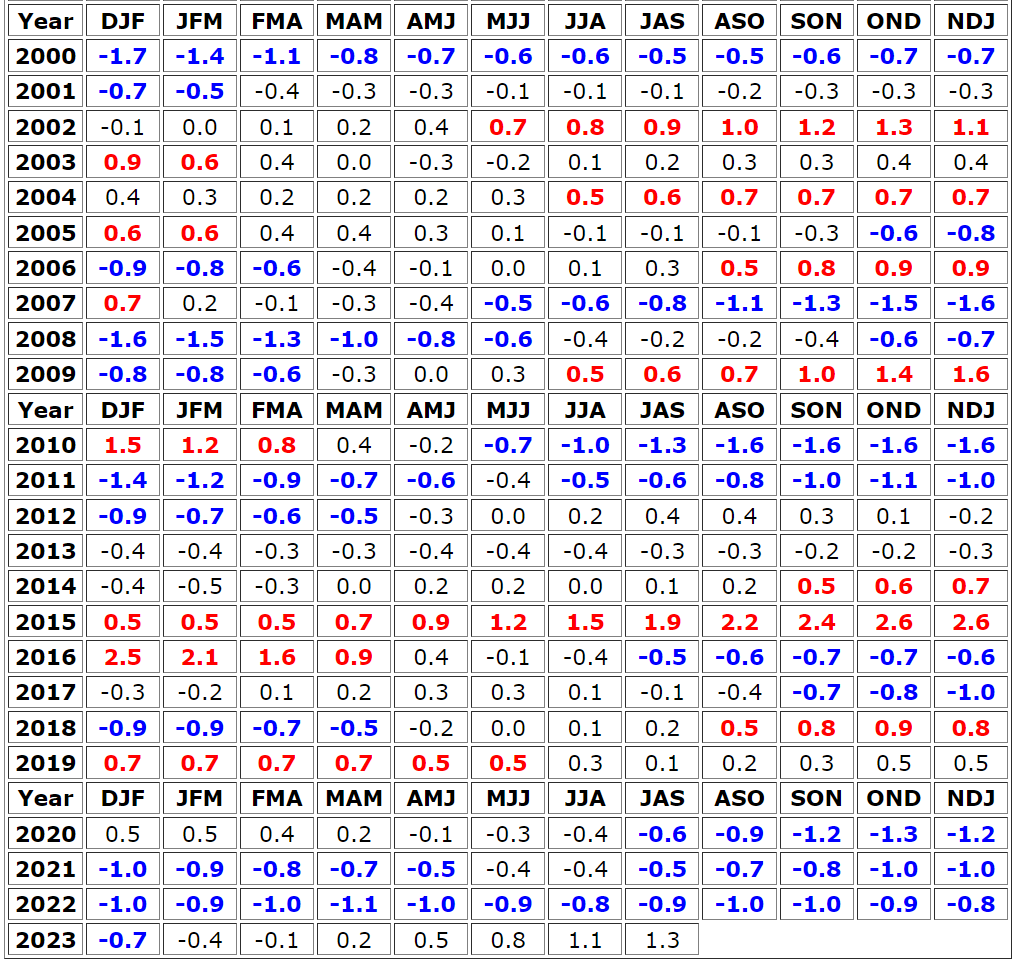
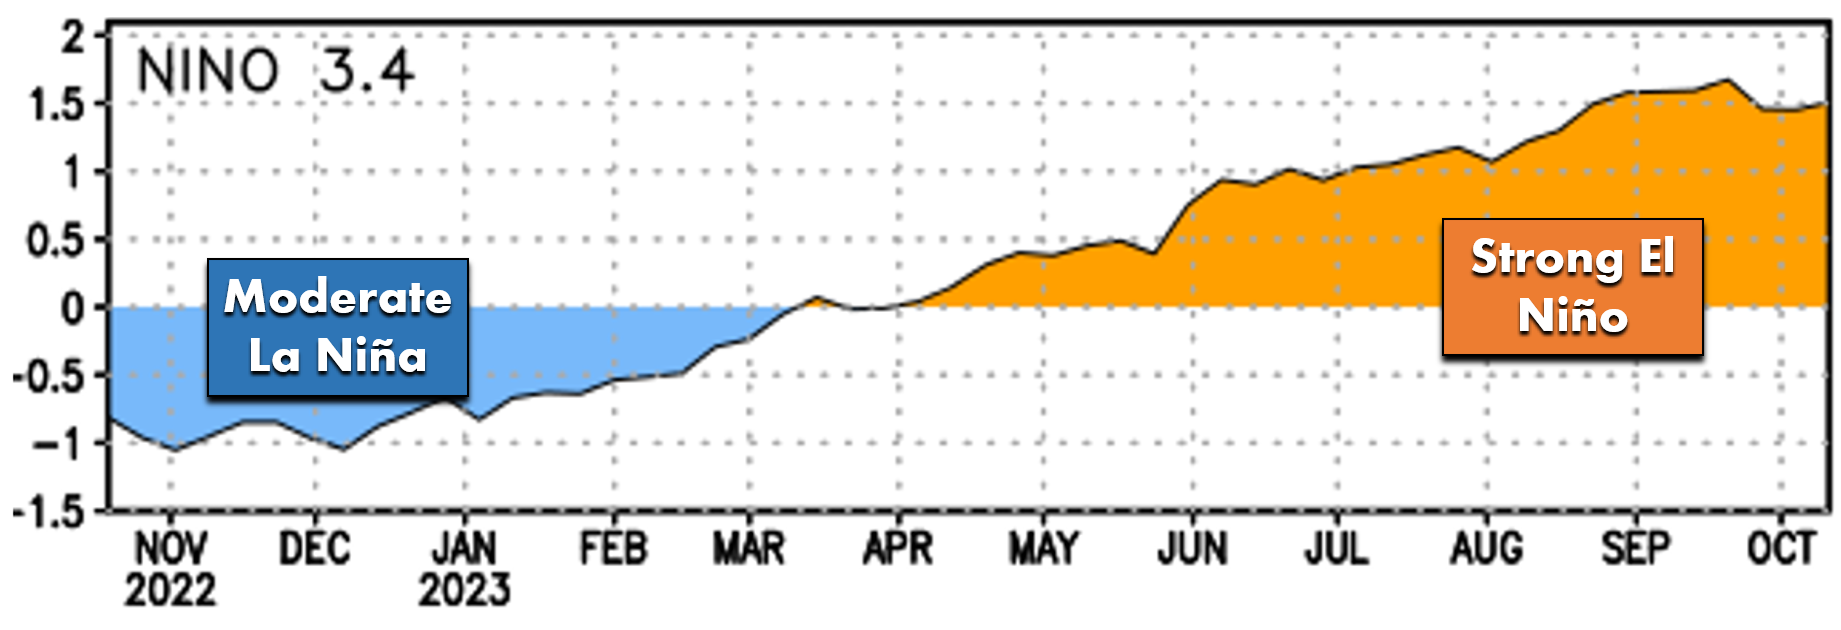
As of October 2023, the normalized temperature anomaly in Niño 3.4 is +1.5°C with the latest ONI being +1.3°C (representing the average of July through September). As mentioned earlier, this is right on the cusp of what is considered a “strong” El Niño.
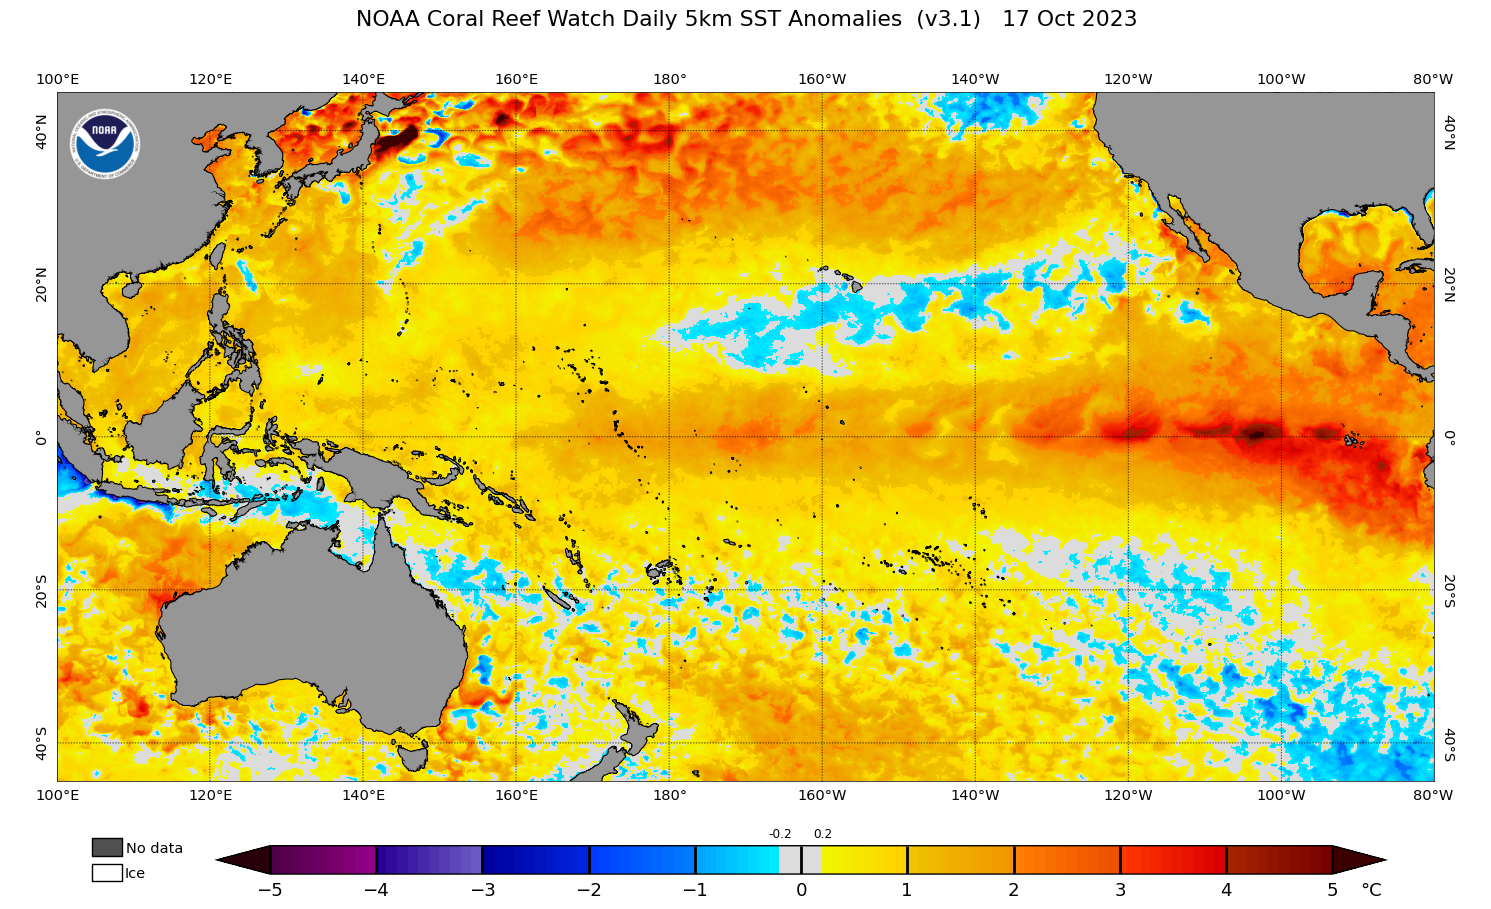
A look at the latest high-resolution sea surface temperature anomalies shows a classic and clear El Niño pattern along the Equator in the Pacific with huge warm anomalies stretching westward from South America.
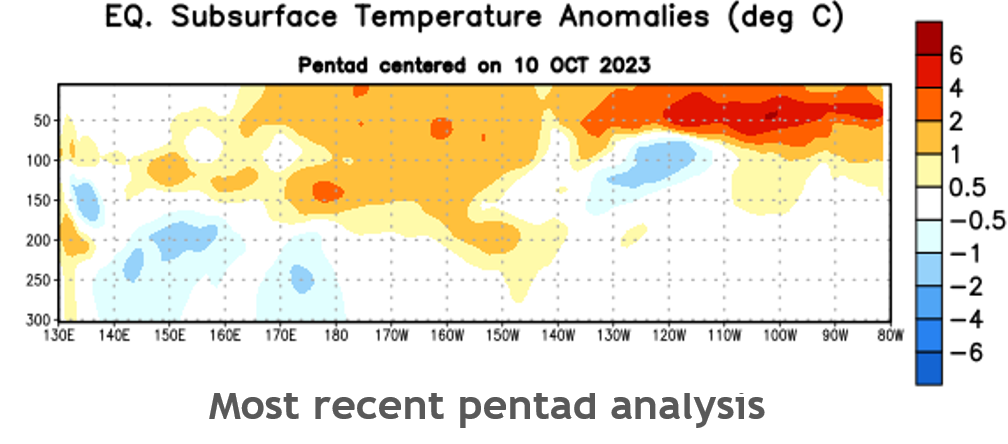
The graphs below of temperature anomalies show the warm water beneath the ocean’s surface since August. This is the data that is gathered from the group of buoys anchored across the expansive Pacific. Essentially they show a time-lapse of El Niño’s evolution the last few months!
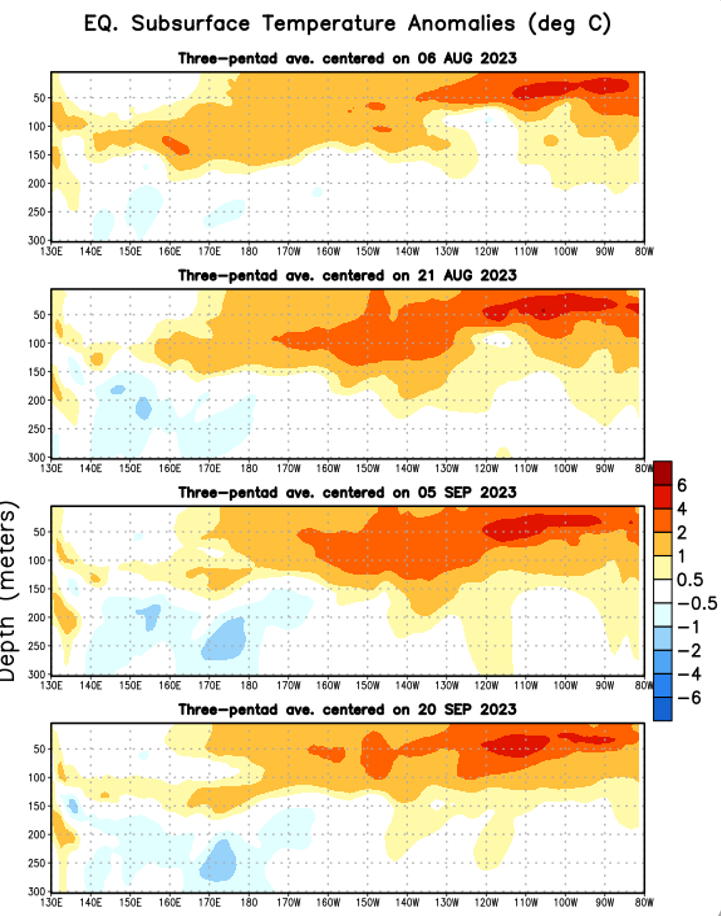
The most recent temperature observations from about a week ago show a largely unchanged situation. The greatest warm anomalies are still present in the shallow waters of the far eastern Pacific which is typical under normal El Niño conditions. Notice that there are some cold anomalies at depth which is perfectly normal during a healthy El Niño!
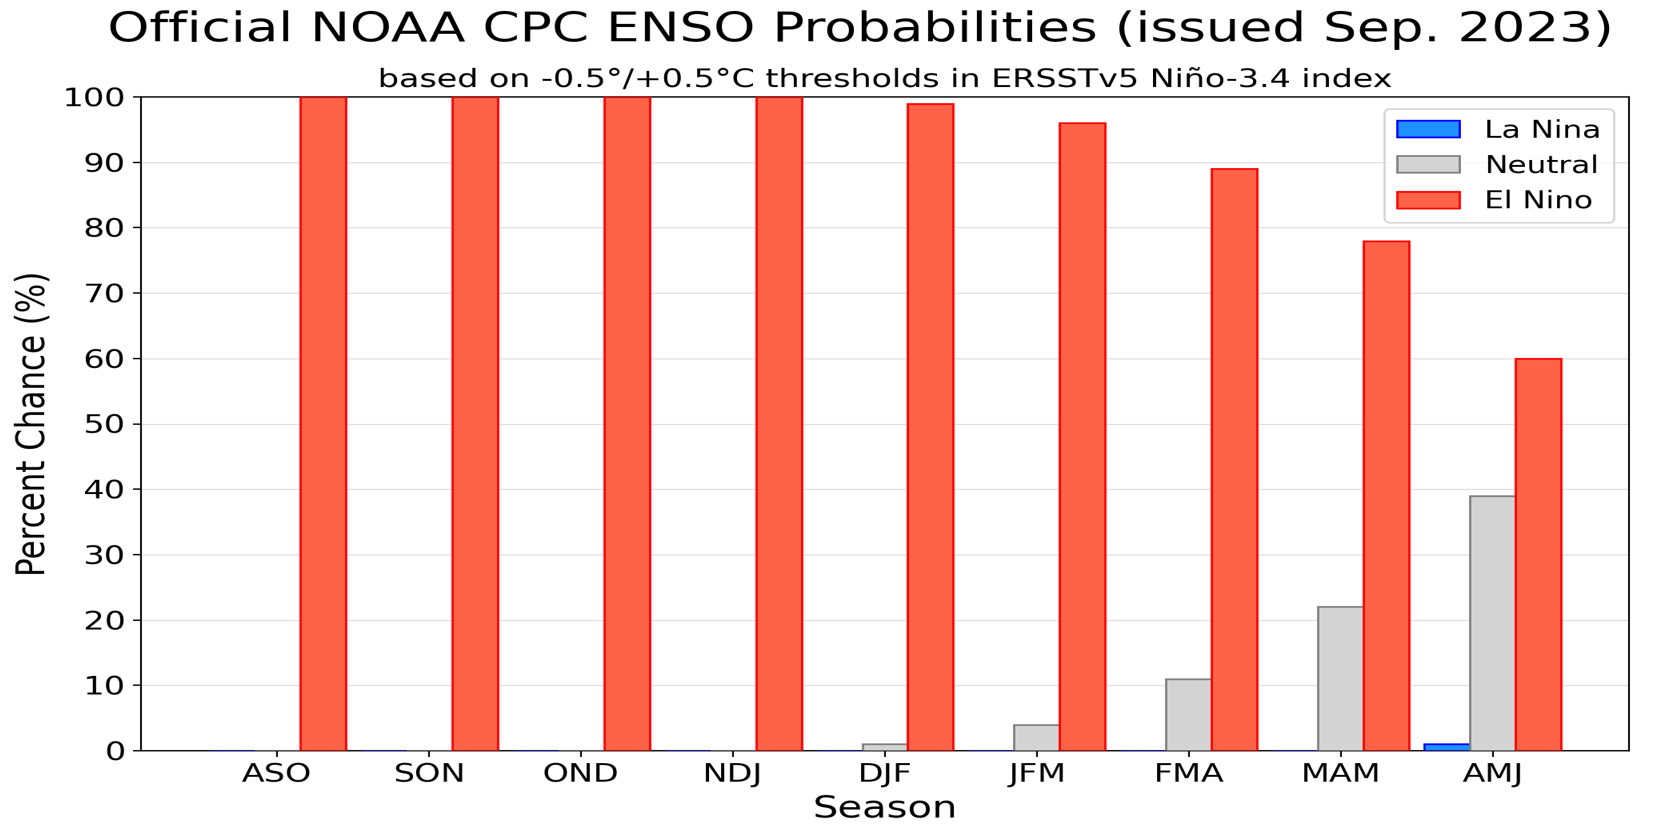
NOAA Climatologists are projecting greater than 95% odds that this current El Niño will stick around through the heart of winter (through February 2024) with greater than 60% odds it will still be here through the end of the Front Range’s snow season (May 2024).
The graphic below contains the ENSO forecasts from a smattering of climate models. A strong El Niño persisting for at least the next few months is the most likely outcome before it weakens in the springtime.
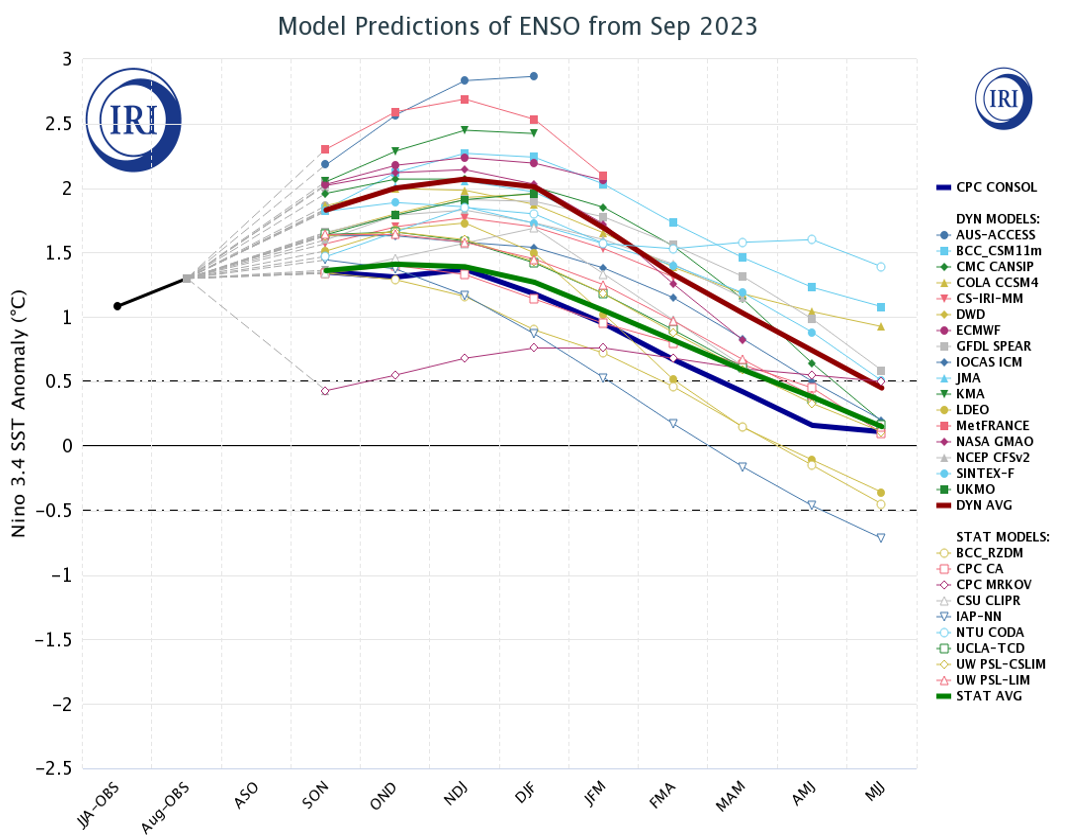
The main takeaway here is that El Niño is solidly underway already and is here to stay for the remainder of autumn and the winter ahead. Good riddance to La Niña, for now!
What does this all mean for Front Range Colorado this winter?
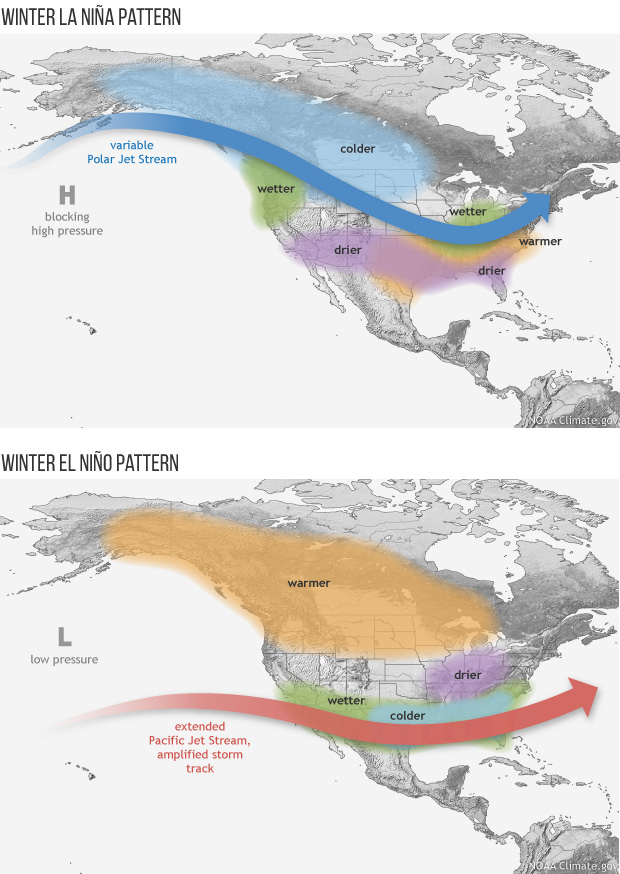
The (admittedly oversimplified) diagrams below shows the general winter conditions during the positive and negative phases of ENSO across North America. A “typical” La Niña winter sees the jet stream keep a more northwesterly orientation across Colorado (top diagram below). Most of our storms will therefore be the cold and relatively dry Canadian variety. This is opposed to the juicy and comparatively warm storms that are a staple of El Niño winters for the Front Range. This jet position during La Niña also produces more orographic snows for the Mountains favored by northwest flow (those near Steamboat, plus Winter Park). On the contrary, during El Niño the jet stream orientation will tend to favor western and southwestern Colorado’s peaks for heavier snows.
One of the most notable impacts from El Niño is the increased likelihood of big snowstorms for the Front Range. To put this into perspective, the most recent two El Niño seasons (2018-19 & 2019-20) had five storms that dumped more than 14″ of snow in Boulder. However, the last five La Niña snow seasons (2016-17 , 2017-18, 2020-21, 2021-22, & 2022-23) combined had only seven snowstorms that produced more than 10″ of snow in Boulder. Let that sink in for a moment! Just a total of seven 10-inchers in five entire winters! This is no surprise though — big snow storms are indeed more frequent for us during El Niño years, and by quite a large margin (see below). Over the last 75+ years, a whopping 23 out of 36 snowstorms (64%) dropping at least 15 inches in the city of Boulder occurred during El Niño conditions, relative to neutral or La Niña patterns. The pie graphs below show just how skewed our biggest snowstorm climatology is towards El Niño. Not good news if you were hoping to avoid crippling snowstorms and the like this winter — Mother Nature is upping the ante!
To put this further into perspective, 12 of the top 15 biggest snowstorms in Boulder’s history occurred during a winter where El Niño was present, including our all-time biggest dumping of snow in October 1997 when one of the strongest El Niños on record was raging — not unlike some projections we are seeing for this winter!
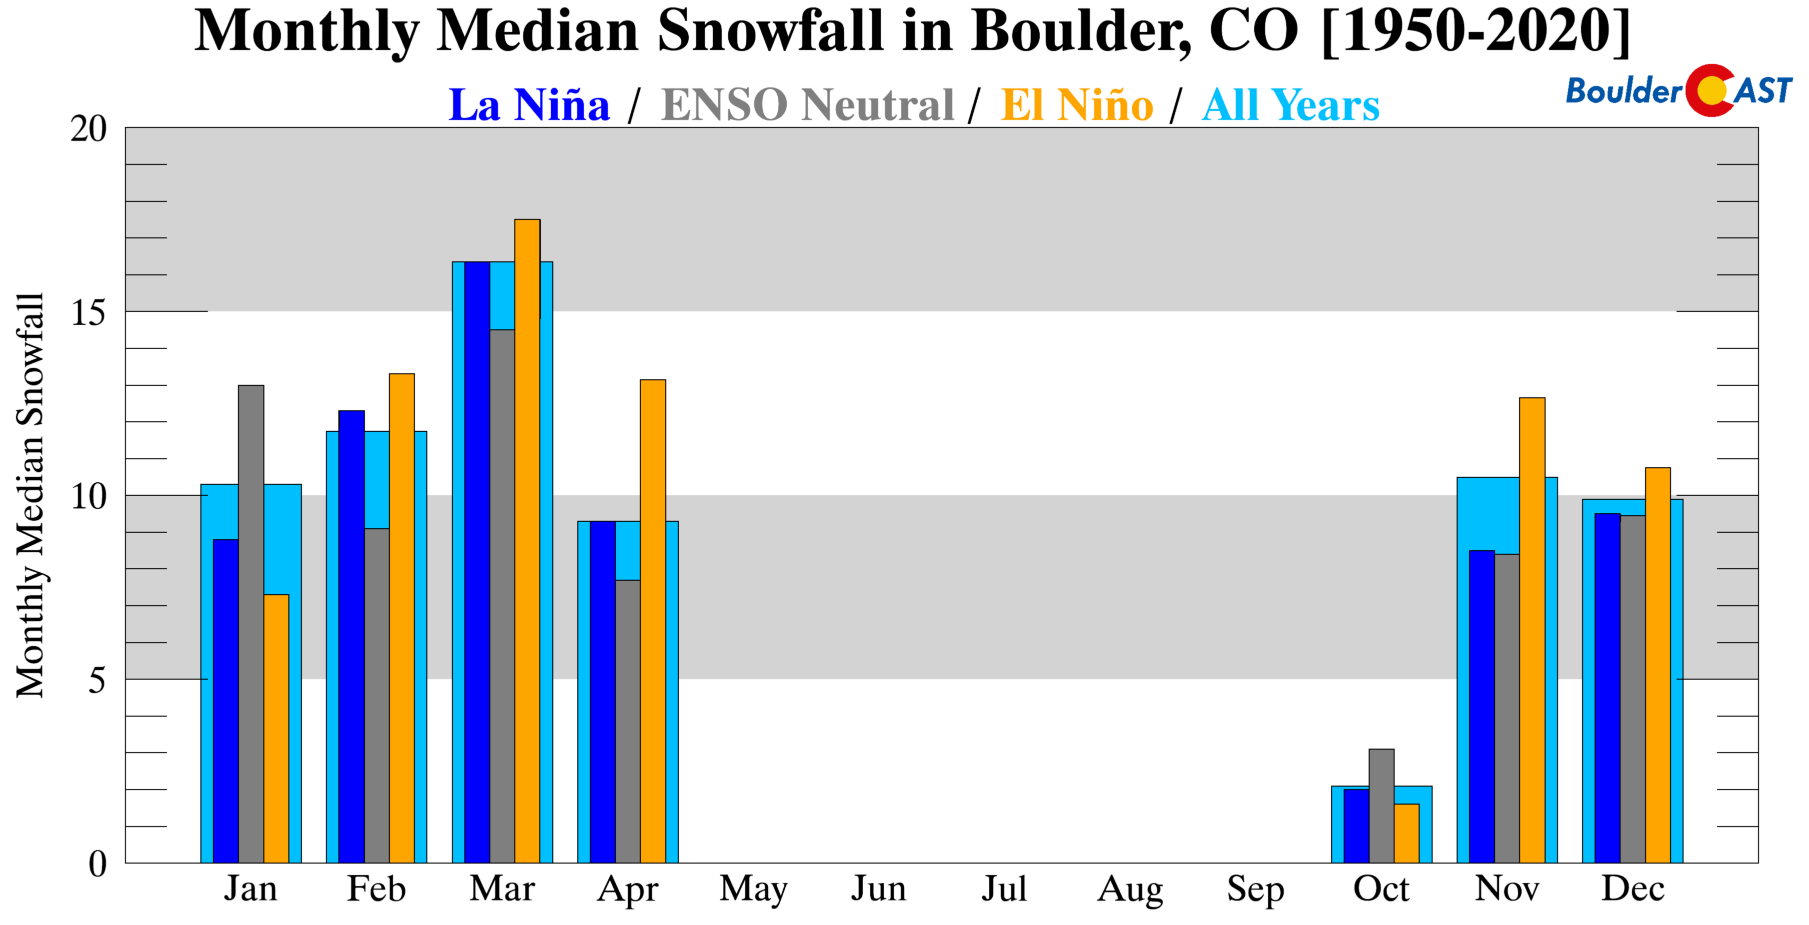
We do want to point out that long-term there is only minor correlation between ENSO and total seasonal snowfall in the Front Range Mountains or Plains. The less frequent but big dumpings of El Niño are replaced with relatively more frequent smaller snow events during La Niña (see the graphic below).
These opposing paths to snow accumulation more-or-less balance each other out across our area. While there is still quite a bit of variability from year to year, the trend line does skew upwards towards more snowfall when El Niños are active for the city of Boulder.
If you recall, Boulder also had its all-time snowiest winter receiving 152 inches just a few years ago during the most recent (albeit weak) El Niño in 2019-2020!
WE'VE DONE IT! The city of Boulder has set a new seasonal snowfall record! 11" of heavy snow overnight and this morning (and still falling) has pushed this season to 145", surpassing the old record of 143" from 1909.#Boulderwx #COwx @bouldercolorado #RecordSnow pic.twitter.com/E3XDZghPoB
— BoulderCAST Weather (@BoulderCAST) April 16, 2020
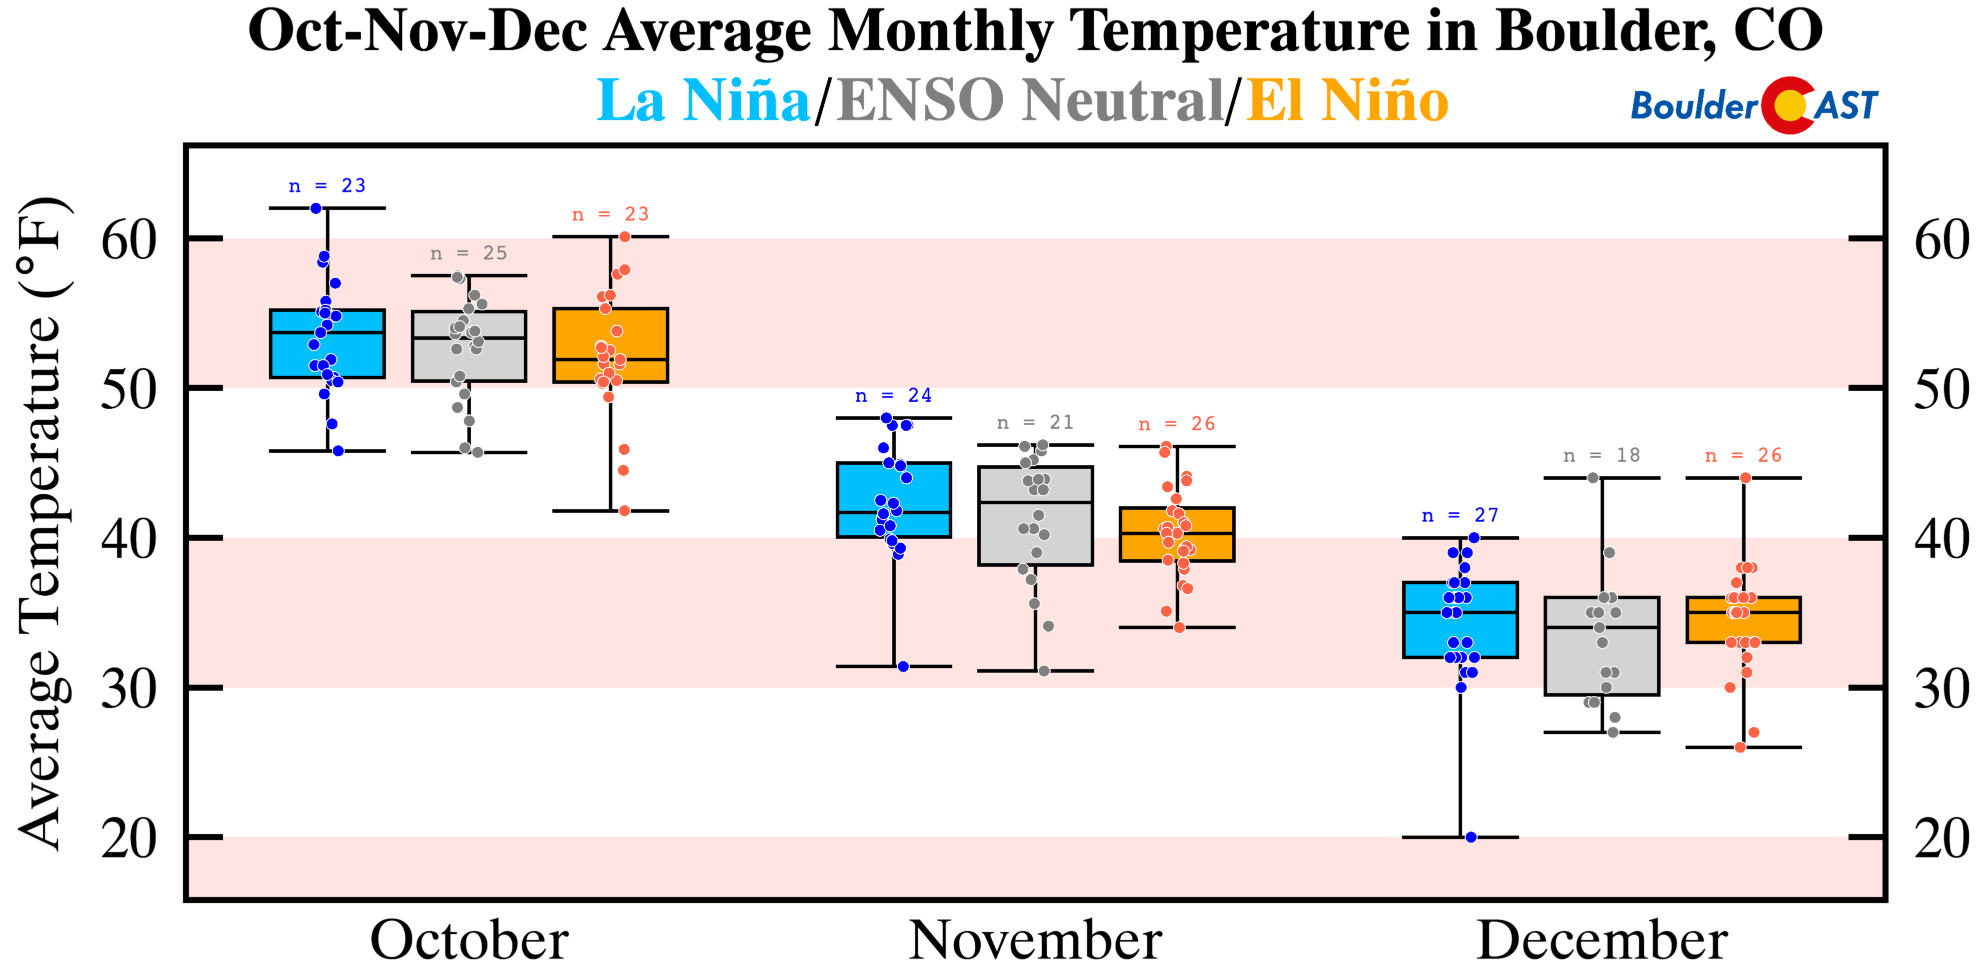
Our perceived thoughts on weather conditions surrounding El Niño are indeed backed up by the broader regional data. Based on temperature and precipitation analysis from the Climate Prediction Center, the autumn period of OND (October-November-December) under El Niño has a clear cool and wet theme for all of northeast Colorado (Climate Division #46).The graphs below are called box-and-whisker plots. The red lines indicate the median value, the blue boxes contain 50% of all years, while the “whiskers” fan out to the more extreme years.
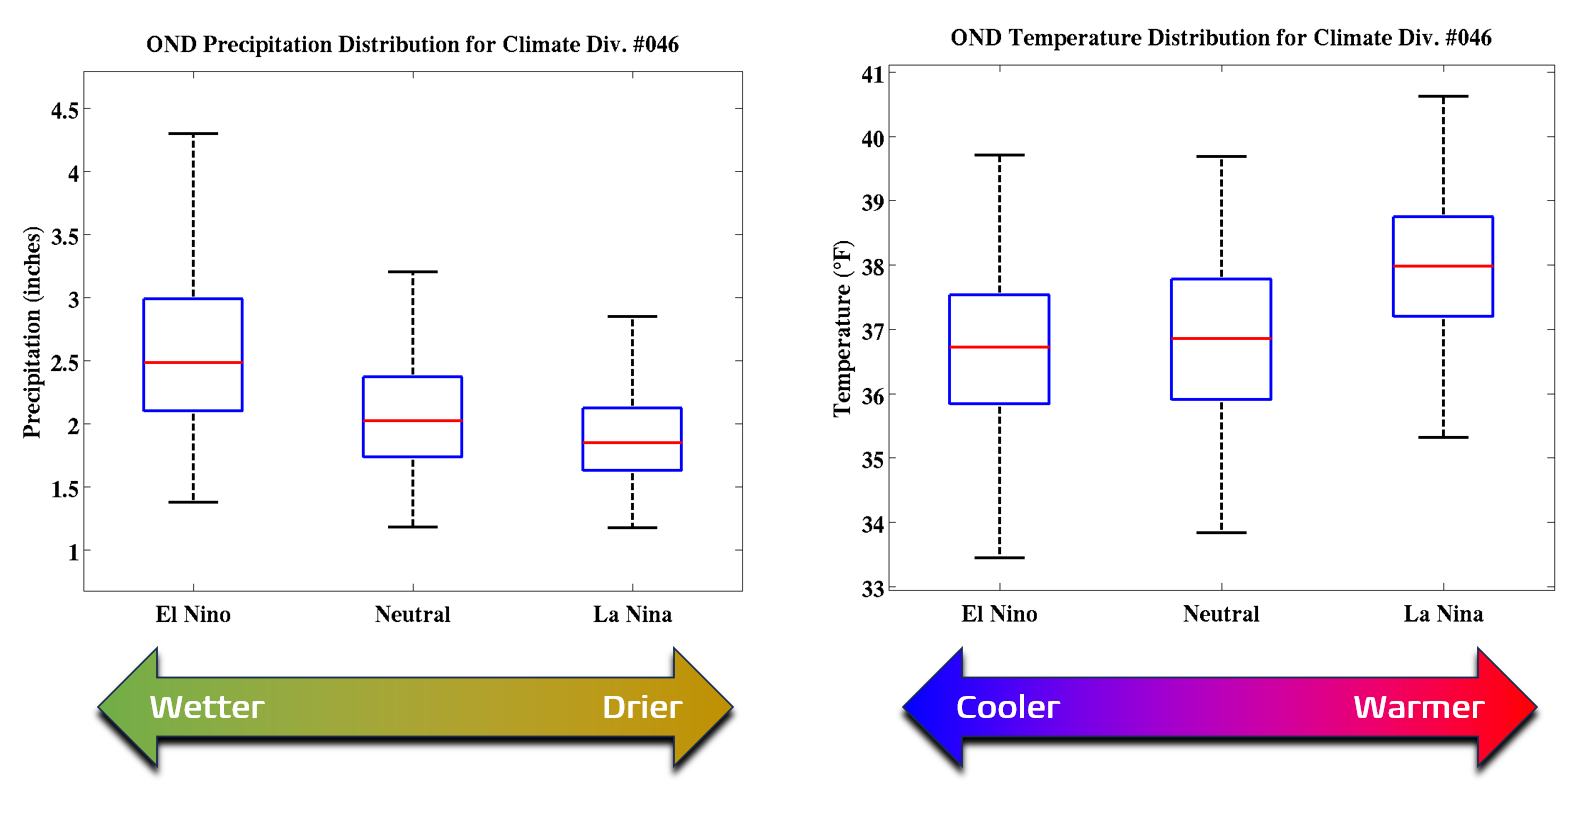
El Niño autumns definitely trend cooler and wetter for northeast Colorado as a whole relative to average. Furthermore, precipitation variability compared to neutral autumns, and certainly La Niña autumns, is much higher. This is seen by a longer”whisker” length in the El Niño precipitation graphic and is largely due to the uptick in intense southern-track storms that tap into Gulf of Mexico moisture — tying back into the further south jet stream pattern we showed earlier. These big juicy events tend to make-or-break El Niño winters and can be highly variable, especially in autumn and springtime.
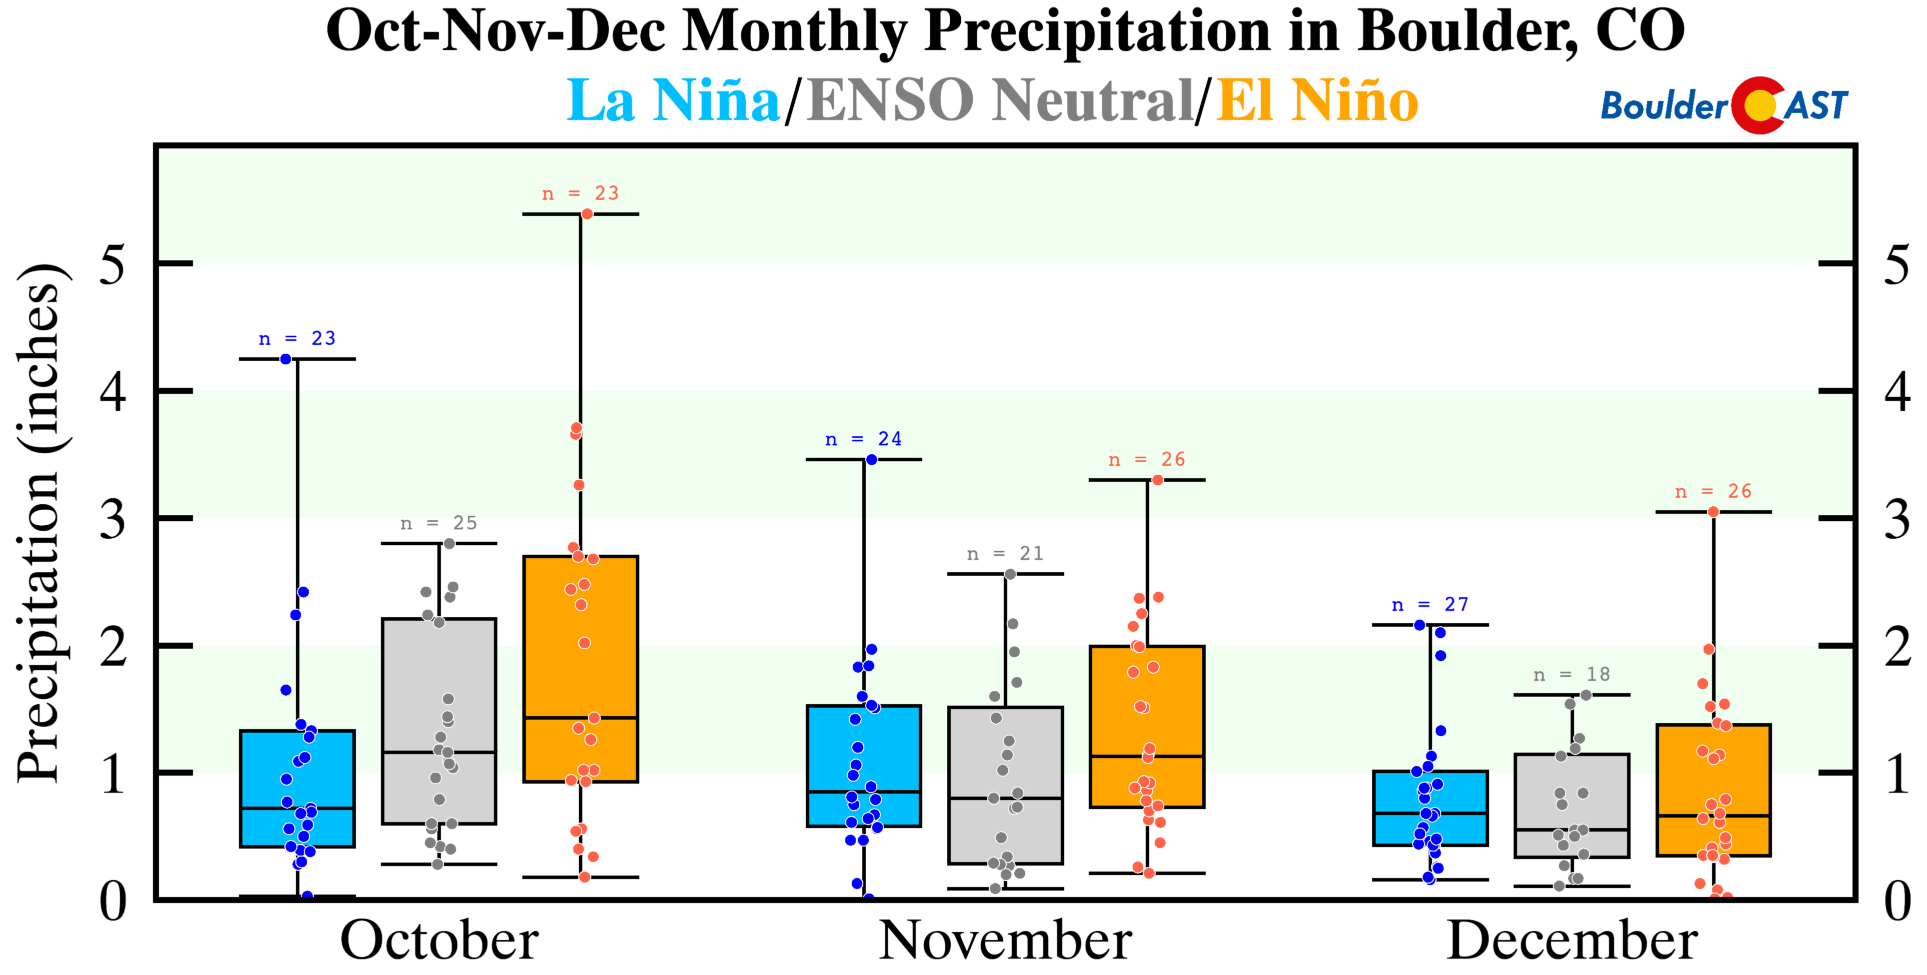
We repeated the same analysis as above, but only for the city of Boulder. The data is very similar with a generally cool and wet trend observed during El Niño autumns in Boulder, too. Precipitation is particularly enhanced in the month of October during El Niño, though it seems like Mother Nature didn’t get the memo THIS October.. This wet signal is not as significant in November or December, at least in Boulder.
Out of all three ENSO phases, El Niño consistently produces the most snowfall during the fall in Boulder. Five out of the six snowiest Octobers have been during El Niño, but the median snowfall is the lowest then as well. This further reinforces the expectation for less frequent snows overall during El Niño, but when it does hit in October, it’s usually a doozy!
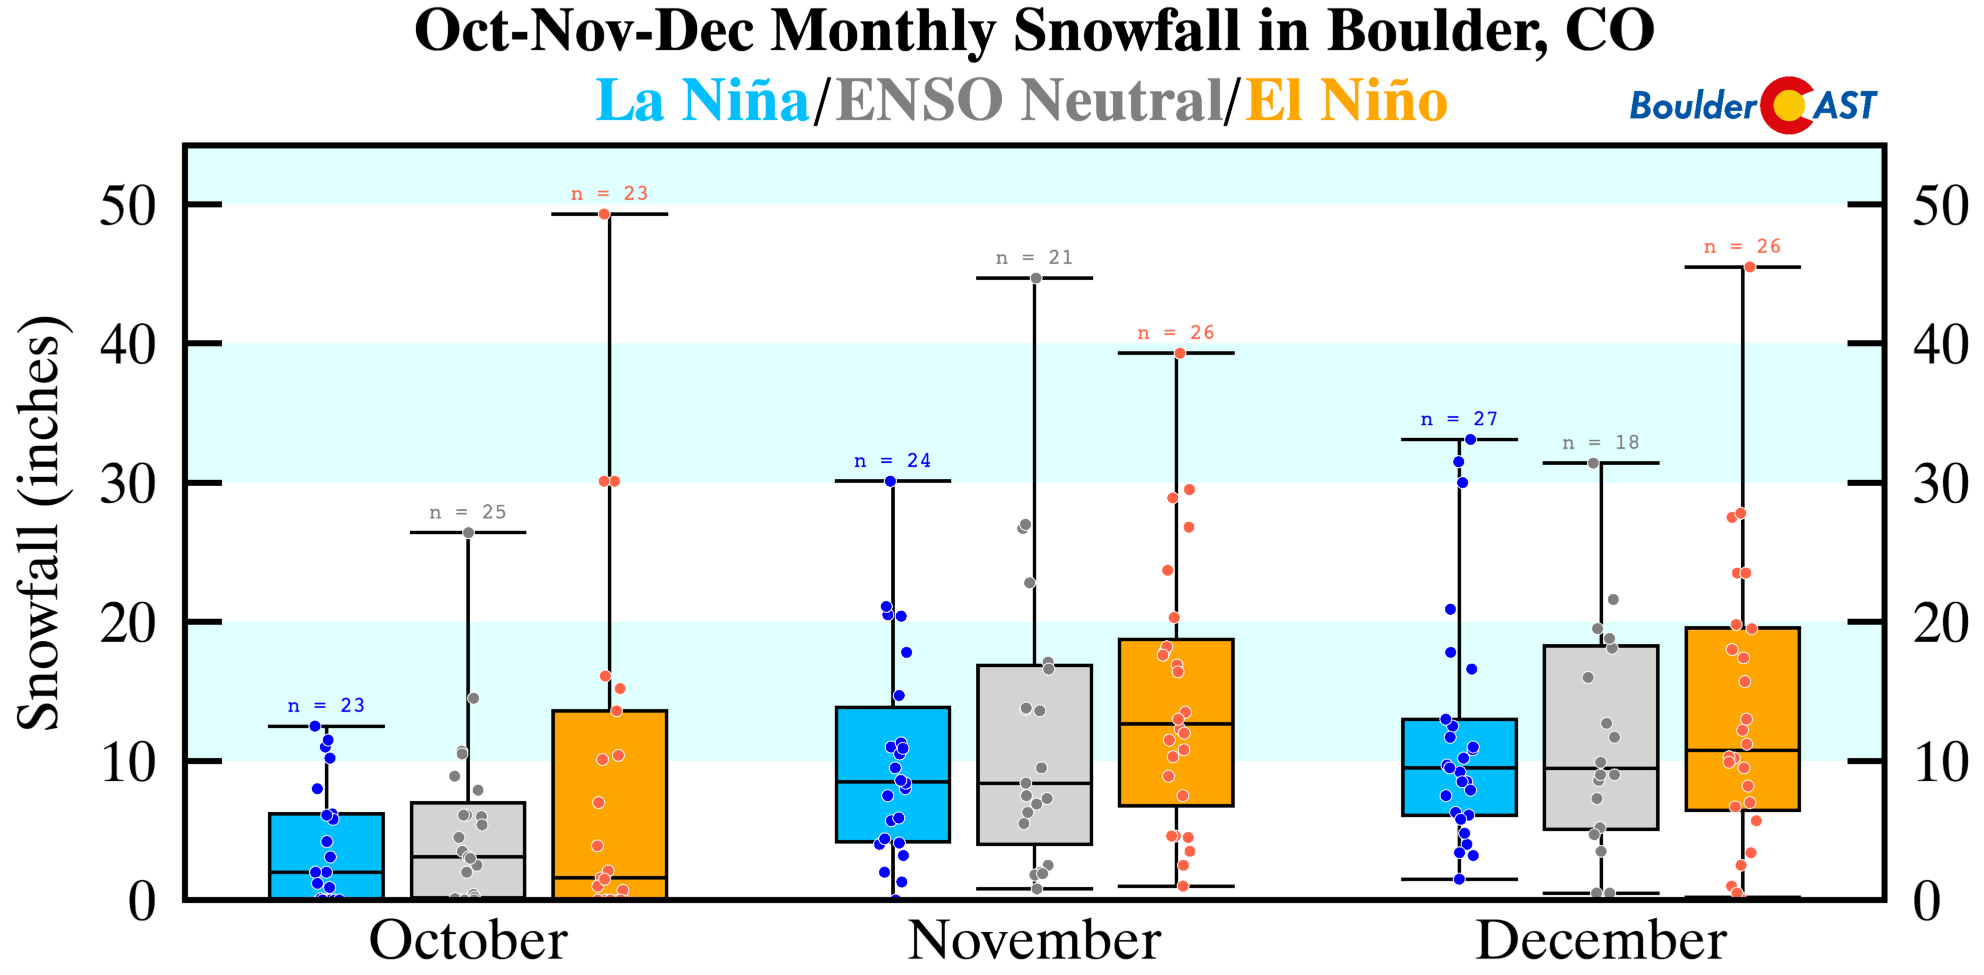
November is the autumn month most likely to see above normal snowfall during El Niño — the median increases to 13″ compared to other years where the median is just 8″. December is more variable, but the median snowfall is still highest during ElNiño by an inch or two. All in all, we should expect higher snowfall than normal these next few months.
Switching over to temperatures, both the mean and median values in Boulder are lower during El Niños for all three months, so at least on paper based on historical outcomings, we have a decent chance at a cooler-than-typical fall this year.
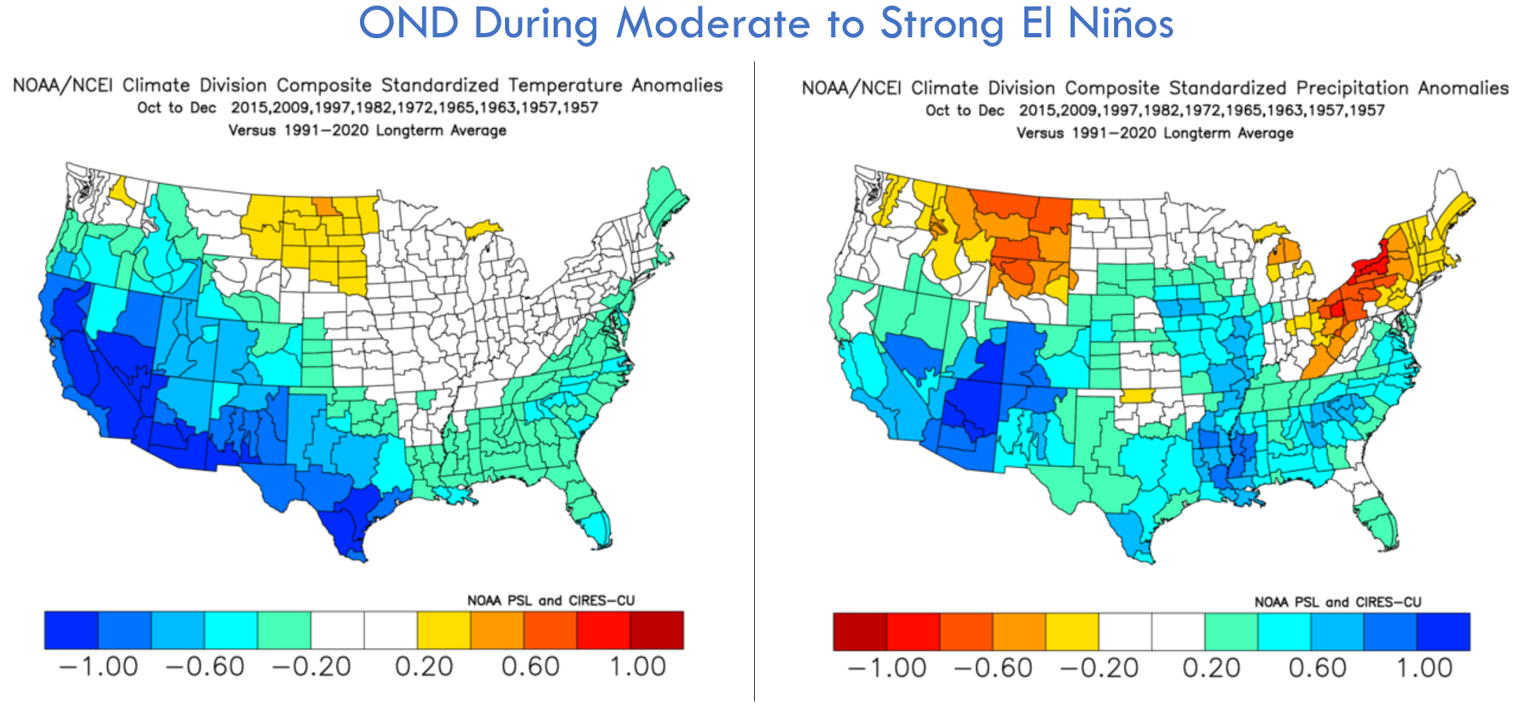
Looking at the historical analogs for the eight other moderate to strong El Niño autumns that occured since 1950, we see a strong signal of cold and wet autumns for the southern tier of the United States, especially in the Four Corners region. This matches up nicely with what we’ve already discussed above for northeast Colorado and also just Boulder.
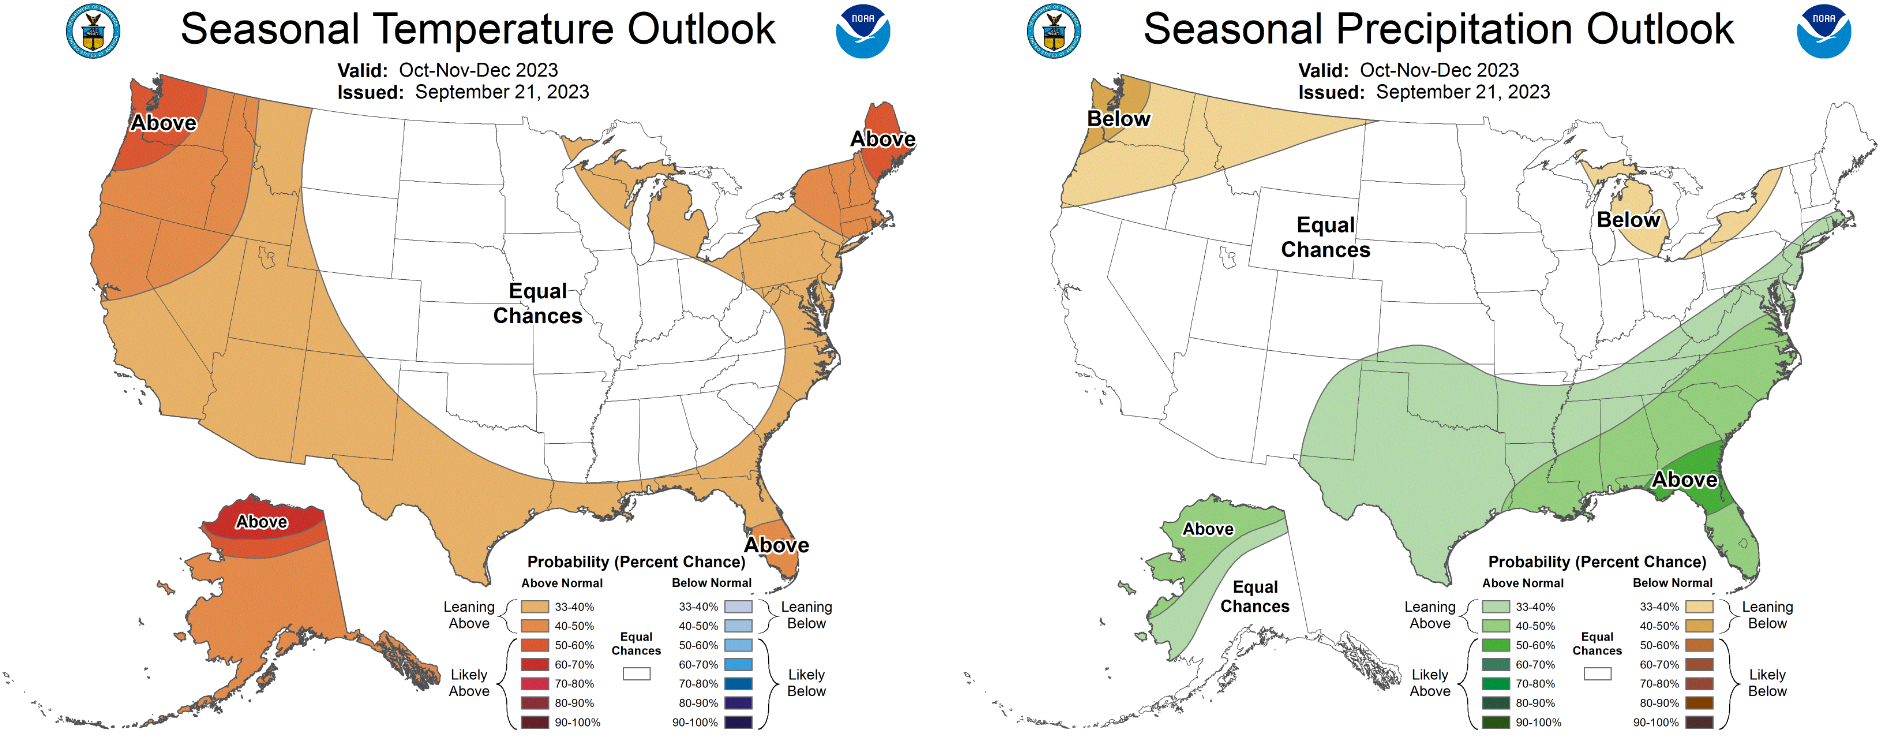
Now that we have reviewed past outcomes from all the intense El Niños, what about the actual outlook for this autumn? The temperature and precipitation seasonal outlook from the long-range forecasting experts at the Climate Prediction Center for October through December is shown below. Interestingly their outlook is leaning warm around the fringes of the country and also wet in the southeast. In Colorado their forecast is not that useful as they are predicting equal chances of any outcome to occur for both seasonal precipitation and temperatures.
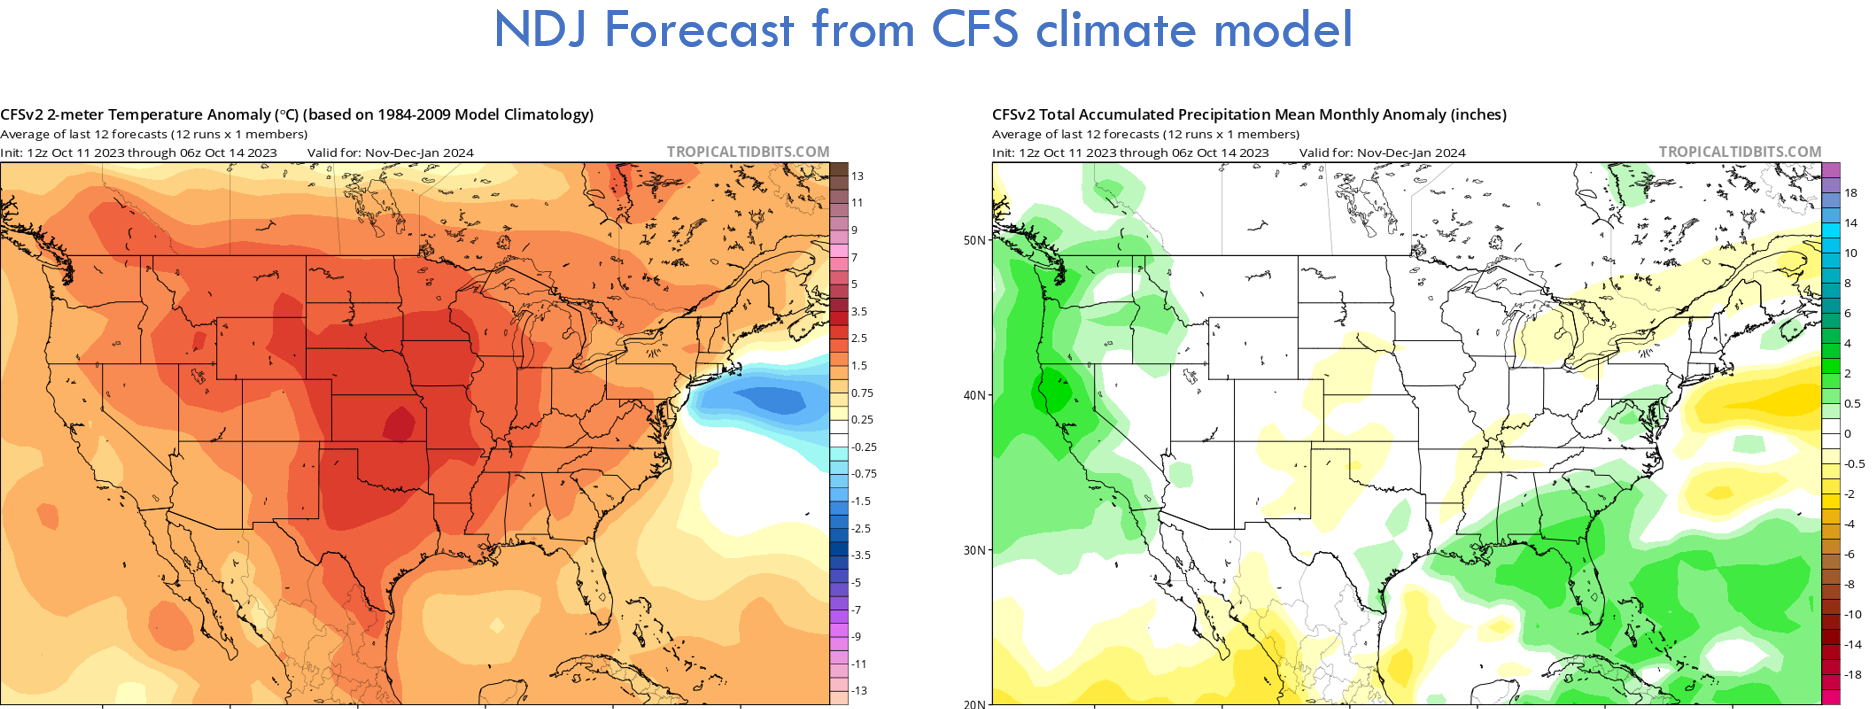
The actual forecast from the Climate Forecast System (CFS) climate model is shown below for NDJ (Nov-Dec-Jan) and it is looking remarkably warm for the whole of the Continental United States, with our area very near the bullseye of their predicted “heat dome”. This forecast indicates near normal precipitation for our area, but has some slightly drier than normal spots across portions of eastern Colorado.
With so much discrepancy between the weather that occurred during historically strong El Niños, the outlook from the CPC and the forecast from the renowned CFS model, it’s tough to put forward a confident forecast for the next few months here. It’s hard to go so strongly against what has happened in prior setups like this…
The official BoulderCAST autumn outlook is as follows:
- Temperatures end up near normal for the autumn season as a whole (within 1°F either way)
- Snowfall will be near or slightly above normal during autumn (5″ below to 10″ above normal)
- There will be at least one 12″+ snowstorm in Boulder before the New Year, most likely to be in November
- Precipitation will be near normal east of the Mountains during autumn (+/- 10%)
- Mountain snowfall will be above normal statewide (5 to 20% above normal), with the southern ranges in Colorado doing better percentwise than the northern ranges
Front Range Colorado’s fate isn’t 100% locked in for a cold and wet autumn, of course. ENSO just gives us an idea towards the most likely conditions to occur during the fall and winter. The “randomness” of Earth’s complicated weather patterns from year-to-year is much more dominant on our weather than ENSO could ever be!
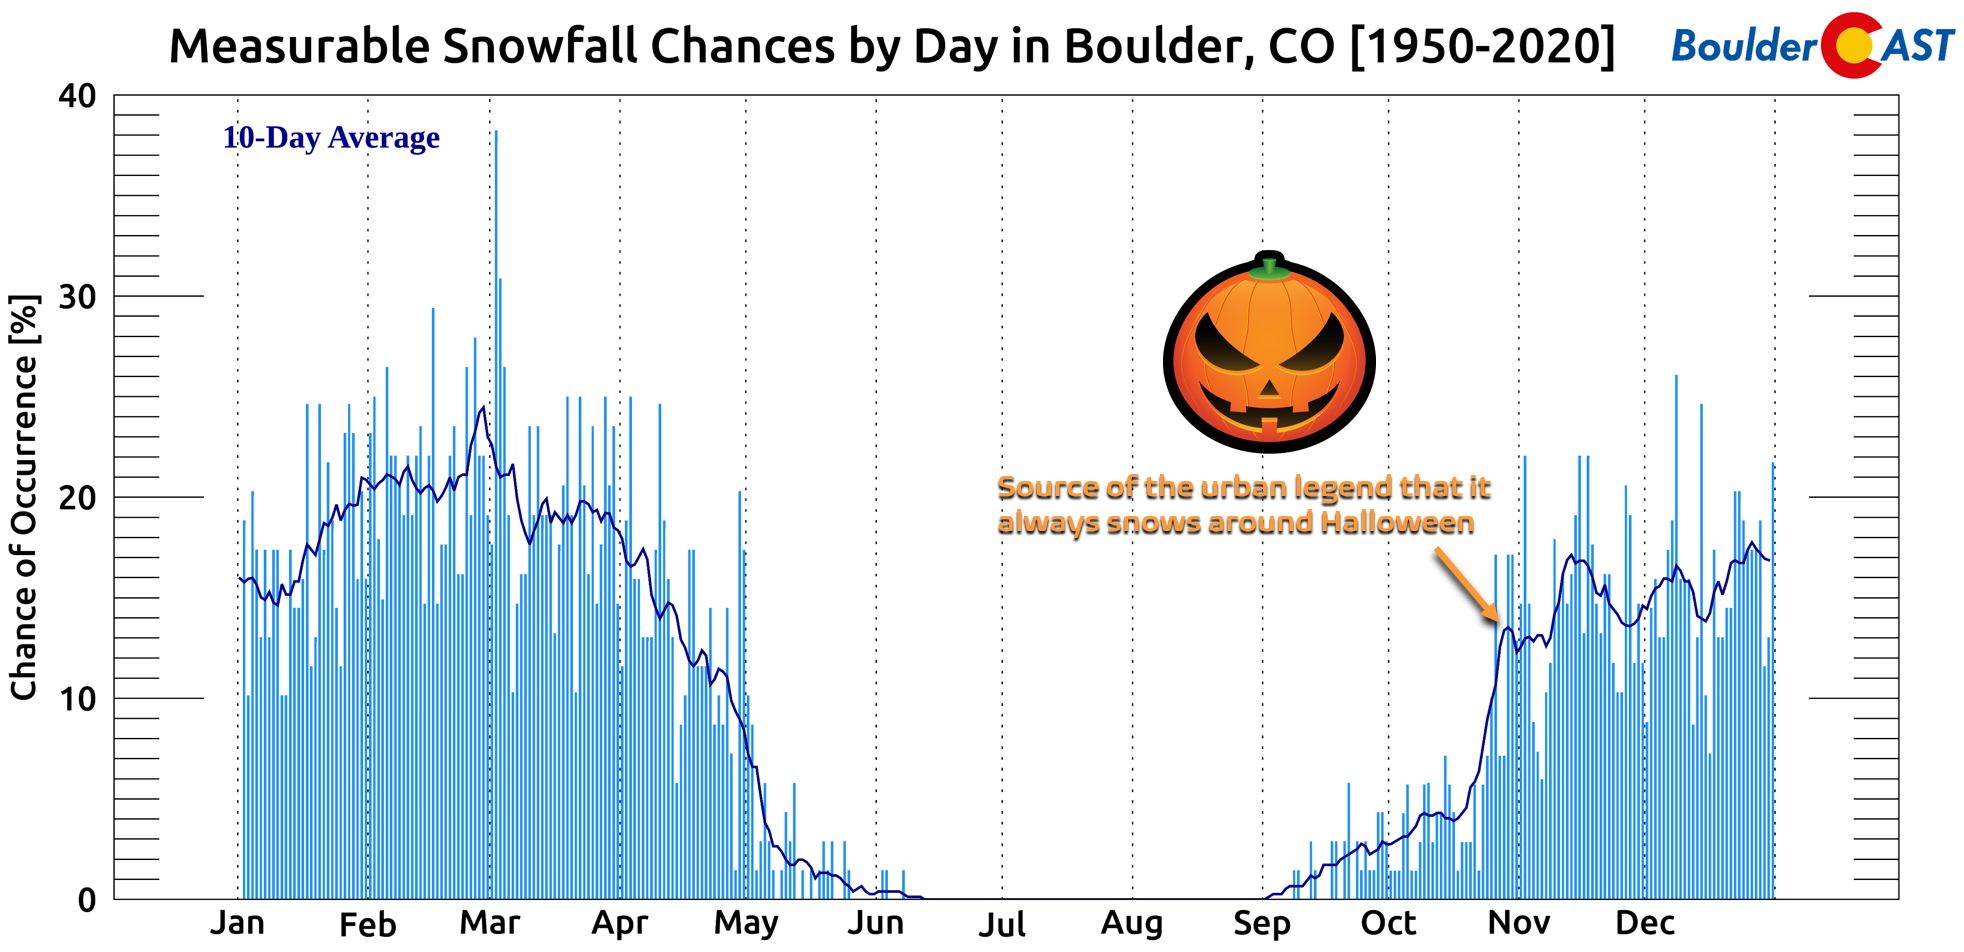
As of writing and near to our climatological median date of first snowfall in Boulder (October 17th), there hasn’t been any snow just yet. Things may be taking a turn next week, though, just in time to help propagate the long-standing “it always snows around Halloween” Denver area urban legend! Stay tuned in the months to come as we’ll certainly be covering all aspects of Colorado weather ahead during what will be our ninth consecutive winter forecasting season!
Go Premium, get all the perks.
Daily Forecast Updates
Get our daily forecast discussion every morning delivered to your inbox.
All Our Model Data
Access to all our Colorado-centric high-resolution weather model graphics. Seriously — every one!
Ski & Hiking Forecasts
6-day forecasts for all the Colorado ski resorts, plus more than 120 hiking trails, including every 14er.
Smoke Forecasts
Wildfire smoke concentration predictions up to 72 hours into the future.
Exclusive Content
Weekend outlooks every Thursday, bonus storm updates, historical data and much more!
No Advertisements
Enjoy ad-free viewing on the entire site.
Get BoulderCAST (non-Premium) updates delivered to your inbox:
Enjoy our content? Do us a HUGE favor and give it a share!


You must be logged in to post a comment.