Using a technique called reverse trajectory analysis, we step back in time to see where the bitter cold air this week originated from. We also explain why we believe the odds of another Arctic intrusion into the United States are elevated during the coming week.
Just how cold was it?
We haven’t seen a stretch of weather quite as long, snowy and cold as this week since February of 2018. With the Metro area’s close proximity a massive mountain range, we’re almost always right on the periphery of very cold airmasses such like the one this week. Any slight shift to westerly downslope winds and “POOF!”, we’re out of it and back to enjoying much warmer conditions.
We discussed the nitty-gritty record-breaking details of the recent Arctic outbreak in our last post, so we’ll spare you the trouble here. Some of the highlights included:
- Back-to-back-to-back record low maximum temperatures (28°F, 20°F, and 25°F Oct 28-30)
- Our 2nd coldest temperature ever in the month of October (3°F on Oct 30), which was a new record low for the date
- The longest stretch of sub-freezing temperatures ever in October (107.25 hours)

What did you do for those 107 long hours?
Where did the cold air come from?
As meteorologists, we use complex numerical weather prediction models to evaluate the future state of the atmosphere and develop our forecasts for day-to-day weather here in the Front Range. Similarly, we can do the same thing but go backwards in time to determine where the weather currently impacting the area originated from. This method is called reverse trajectory analysis. By using a combination of atmospheric observations and model data from the previous few days, we can determine the source region for any specific blob of air that exists. You can probably see where this is going…
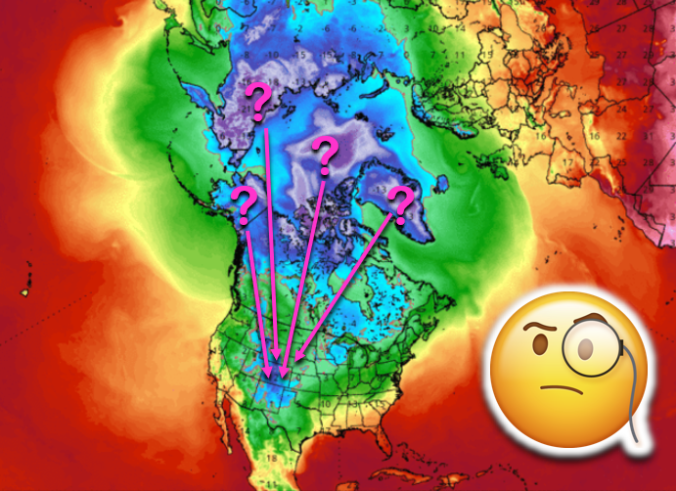
We ran a reverse trajectory analysis on the bitter cold airmass that blasted into the Front Range this past Tuesday morning around sunrise. If you recall, this front was accompanied by a brief burst of heavy snow making for a slick morning commute. In this analysis, we used the air at the 850 mb level….this is just a few hundred feet above the ground in the Denver area. The graphic below shows the track the frigid air took in the five days leading up to its arrival on our doorstep.

There are no surprises here. Five days prior, the Arctic airmass that enveloped northeast Colorado this week was situated north of Alaska over the portion of the Arctic Ocean known as the Beaufort Sea. This expanse of water is already frozen over with sea ice. Over the next several days, its journey took it southward across the High Plains of western Canada, the coldest part of the country, before moving directly and forcefully into the Rocky Mountain State.

From north to south, this airmass passed over these cities with the following average high and low temperatures this time of year:
- Sachs Harbor, NT: 8°F, -5°F
- Tuktoyaktuk, NT: 9°F, -2°F
- Norman Wells, NT: 11°F, 2°F
- Yellowknife, NT: 23°F, 12°F
- Fort McMurray, SK: 34°F, 18°F
- Lloydminster, AB: 36°F, 19°F
- Denver, CO: 61°F, 36°F
There is more than a 50-degree range in climatological high temperatures between Denver and Sachs Harbor in Canada, which by the way is well north of the Arctic Circle and this time of year has only about 5 hours of daylight. The other 19 hours of the day, polar darkness helps to extract any remaining warmth out of the ground and atmosphere, radiating it back to space.
Why did this cold air spill southward all of the sudden?
In short, an extraordinarily amplified ridge of high pressure developed over Alaska in the days leading up the cold air outbreak in Colorado. There is a very strong correlation between ridges such as this forming over Alaska and major Arctic outbreaks in the central and eastern United States during the winter months (did someone say Polar Vortex?). Below is an animation of 500 mb geopotential height anomalies from the GFS model during the outbreak. Watch closely as the massive ridge over Alaska develops just before two deep troughs dig into Colorado, seemingly in synchronization. In fact, some of our most historic cold air outbreaks have occurred under this exact flow pattern, though it rarely manifests itself this early in the season.

One clear reason for this atypically early cold air outbreak lies more than 4000 miles away from Colorado. For the last several months, the northeastern Pacific Ocean and the Gulf of Alaska have been a breeding ground for persistent high pressure systems in the middle atmosphere. As a consequence of lessened storms/winds and thus less oceanic mixing, a huge patch of anomalously warm sea-surface temperatures has formed in this very same area (see below). Folks with an interest in forecasting weather across the Pacific Northwest keep a close eye on this area and have a coined a fitting name for this warming feature: “The Blob“. High pressure systems and The Blob have a symbiotic relationship of sorts. The warmer the ocean temperatures over this rather large area, the more likely high pressure will develop overhead. Under high pressure, conditions are calm and further oceanic warming occurs and The Blob grows bigger and stronger. This is also known as a positive feedback loop.

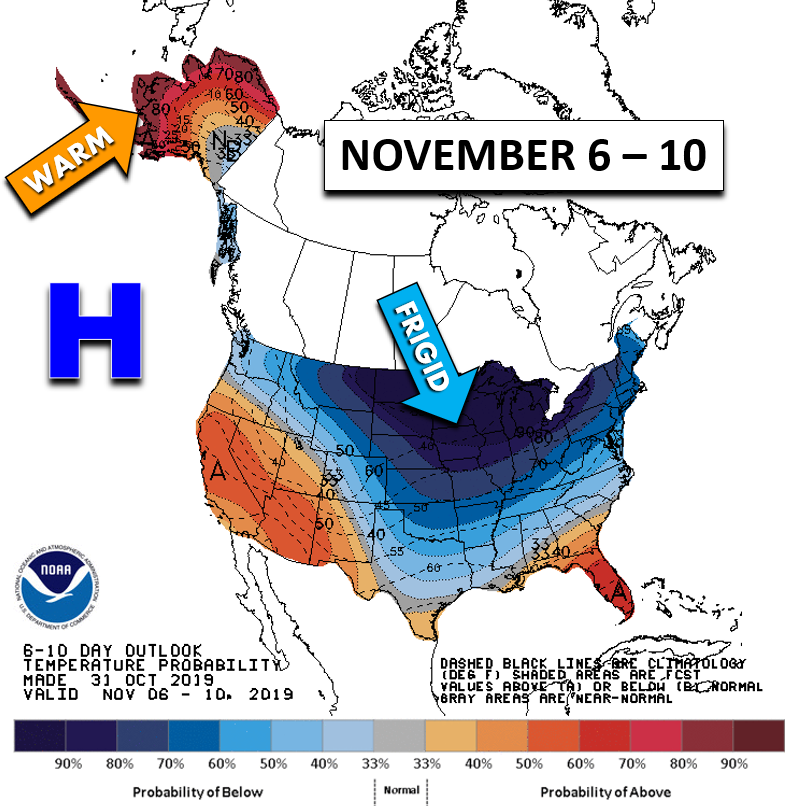
Oceanic temperatures are inevitably going to be slow to change due to the high heat capacity of water. Unlike the atmosphere, ocean temperatures cannot warm and cool at the drop of a hat. Just like the warm ocean surface created during El Niño, The Blob isn’t going anywhere anytime soon. As winter takes a stronger hold on the Northern Hemisphere with each passing day, the intensifying storm track into this area will likely outweigh the symbiotic relationship between the high pressure and The Blob. It’s only a matter of time before The Blob withers away back to normalcy. Whether that timeframe is on the order of weeks or months remains to be seen. NOAA’s Climate Prediction Center certainly isn’t optimistic for the former. The amplified Alaskan ridge continues to encourage Mother Nature to send her icy wrath southward into the United States in their 6 to 10 day temperature outlook.
And also their 8 to 14 day temperature outlook…

Further supporting the continued threat of cold air outbreaks is a forecast for the Pacific North American (PNA) index to remain negative. We use the PNA index to gauge the strength of low pressure across southern Alaska. A negative PNA index, like we’ve seen recently, indicates high pressure is present near Alaska and correlates with cooler weather here in Colorado during the fall months. This year the PNA index first turned negative in early October, well-timed with our coldest day in more than four months. Later negative PNA dips in the month correlated nicely with our first snow, second snow, and the Arctic outbreak we just endured. As mentioned, ensemble forecast guidance indicates the PNA will remain negative for the first ten days of November (see red lines below).

With The Blob persisting in some form for the foreseeable future and the PNA index remaining negative in the near-term, we expect elevated odds of another Arctic outbreak during the first of half of November across the northern United States. The beginning of the GFS ensemble mean 850 mb temperature animation below shows the Arctic outbreak from earlier this week. Notice how the core of the coldest air made a beeline for Colorado. Brrrrr! Towards the end of the animation, we see a second Arctic airmass pouring southward into the United States during the latter part of next week (November 7th timeframe). The core of this potential outbreak is predicted to bypass Colorado and move straight into the Northeast. Whether the forecast shifts and frigid airmass slams Colorado again is something we will just have to wait and see. For now, we expect a major squabble next week surrounding the cold weather headed for the “big” cities of the I-95 Corridor, not Denver.

GFS 850 mb temperature anomaly animation covering Oct 29-Nov 9, 2019
We discuss Boulder and Denver weather every single day on BoulderCAST Premium. Sign up today to get access to our daily forecast discussions every morning, complete six-day skiing and hiking forecasts powered by machine learning, access to all our Front Range specific weather models, additional storm updates and much more!

.
Spread the word, share Colorado weather:
.


You must be logged in to post a comment.