For many of you, this week’s blizzard will be one to remember for years to come. We take a look at the formation and evolution of what may have been the strongest storm in Colorado’s history. We also review the remarkable snow totals and wind gusts from across the region.
Wind & snow pummel Front Range
Following a few rather forgettable years of snowfall in the Denver area, this week’s storm was arguably the most hyped winter event for us since April of 2016. Conditions were highly variable across the Metro area, with those near and east of Interstate 25 far worse off due to stronger winds and heavier snowfall. Depending on where you were located, your sentiment about this week’s blizzard likely falls into one of the following categories:
- “That storm was massively over-hyped!” (Boulder area)
- “Finally…El Niño delivered!” (Foothills)
- “Whoa! That was the craziest storm of all time!” (Anywhere near and east of Interstate 25)
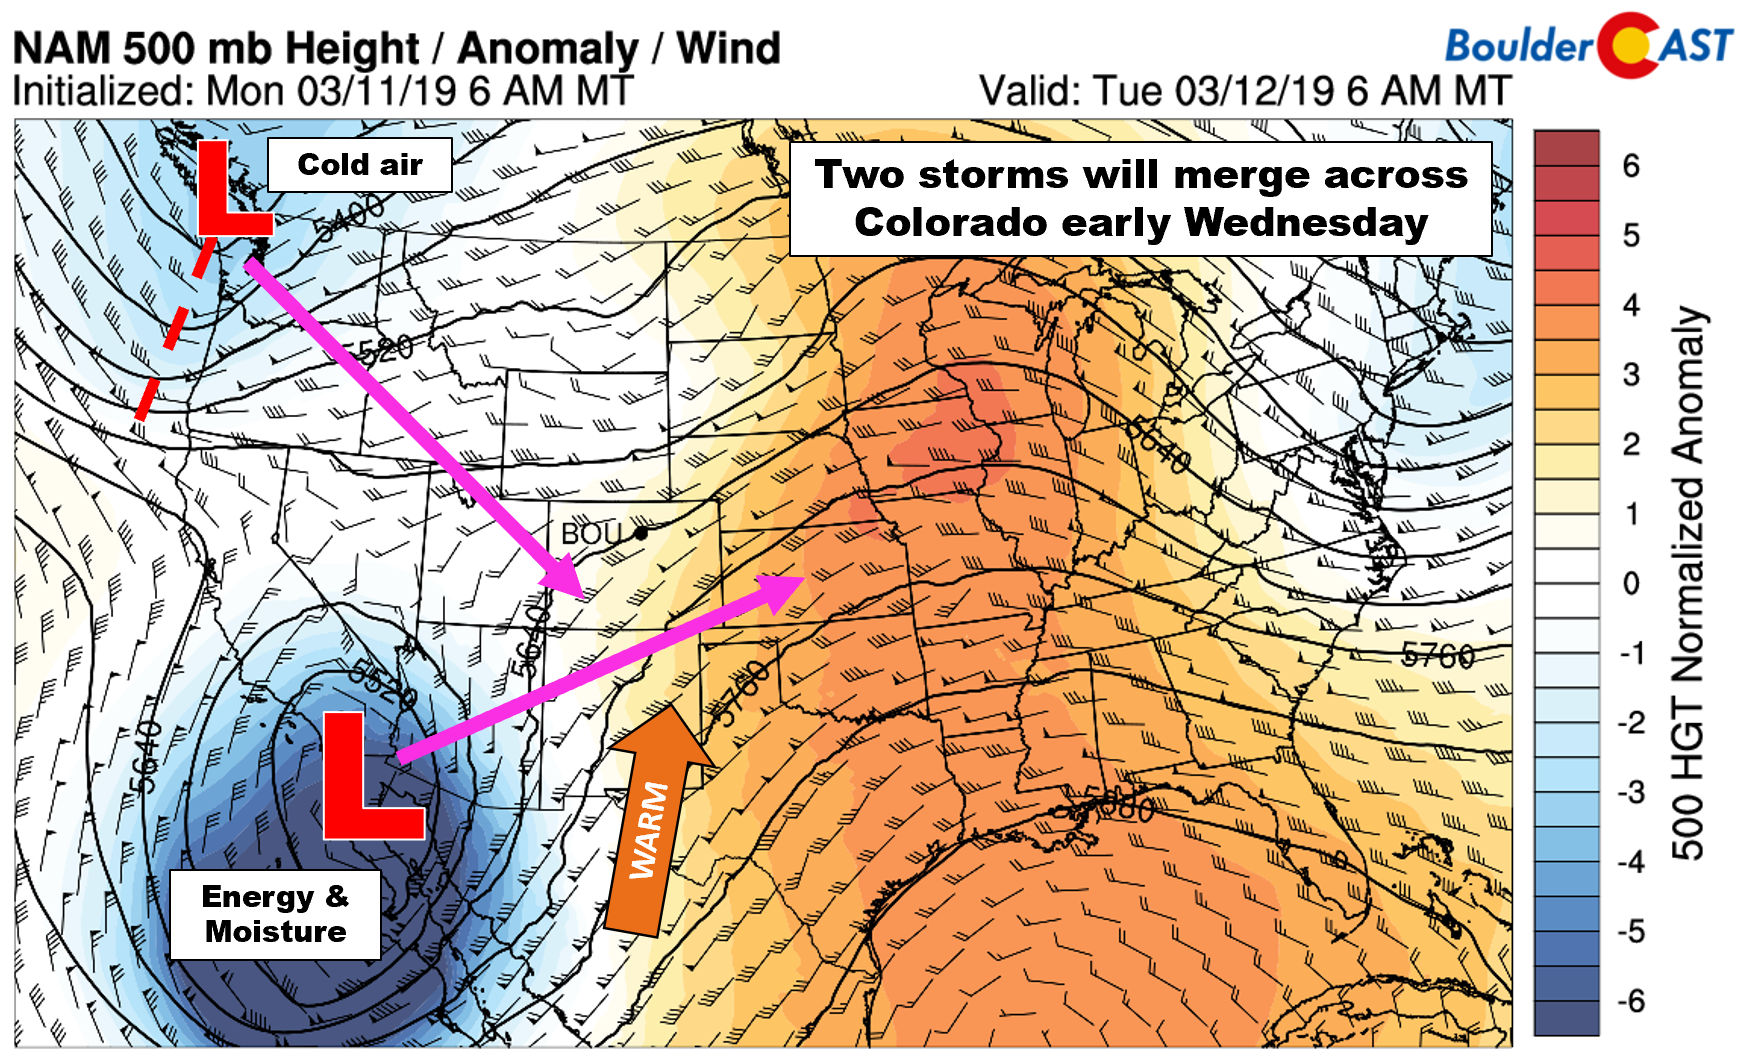
Just as the weather models were advertising, numerous days in advance mind you, a merger of two storm systems directly over Colorado led to explosive cyclogenesis as both came across the Rockies.
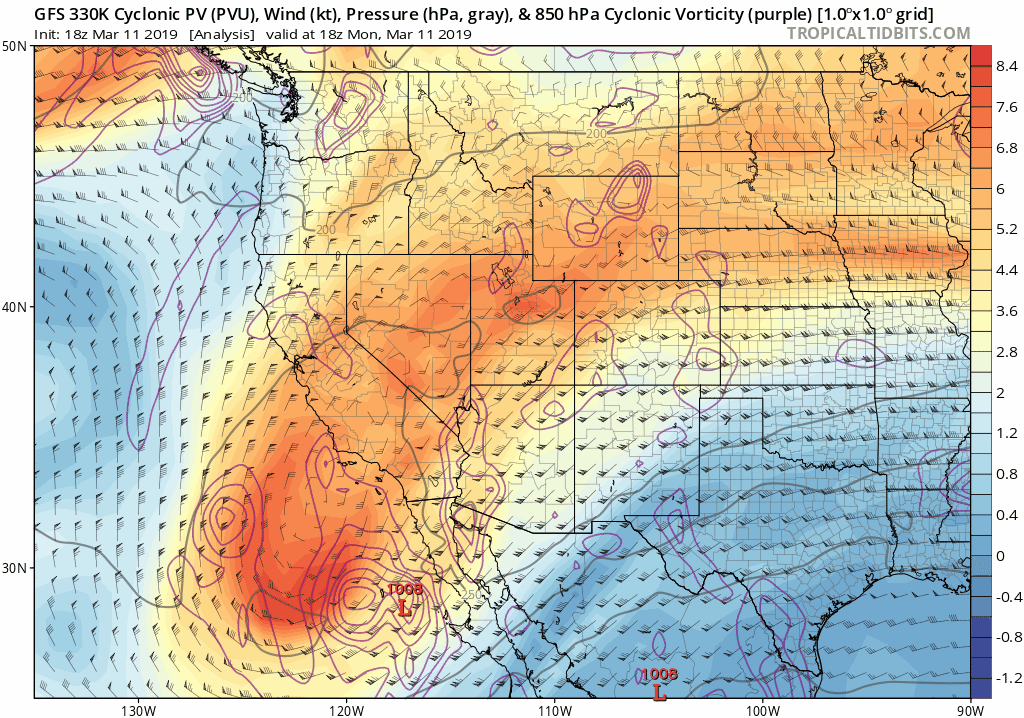
The animation below of potential vorticity from the lower stratosphere shows their beautiful union and the resulting bomb cyclone. Yes, in case you haven’t already heard, this week’s storm intensified so rapidly it met the criteria to be classified as having undergone bombogenesis. By our count, the storm’s central pressure dropped at least 27 mb in only about 15 hours….very rapid intensification.
GFS forecast animation showing lower stratosphere potential vorticity.
Just like “polar vortex”, “bomb cyclone” is now a meteorological term you are undoubtedly familiar with, whether you like it or not. Bombogenesis is rare, but not that rare. What makes this particular storm so remarkable is where it happened. Typically, bombogenesis only occurs along the eastern coastline of continents where a very strong, winter-time temperature gradient is frequently present. Its occurrence in the middle of a continent, let alone in the High Plains of Colorado, is nearly unheard of. This seemingly was a perfect storm, with two in-phase disturbances merging and then descending together from the highest mountain range in the continental United States. Who knows….we may see a new term coined for what transpired this week — “lee-side bombogenesis”.
The view of the storm’s center from GOES-East was amazing on Wednesday:
Visible satellite loop from GOES-East during the day Wednesday showing the center of the storm moving from eastern Colorado into western Kansas.
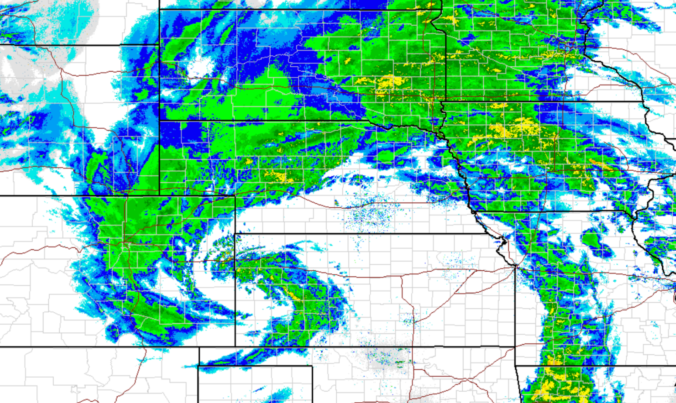
The radar imagery was equally as impressive, looking very much akin to a weak hurricane:
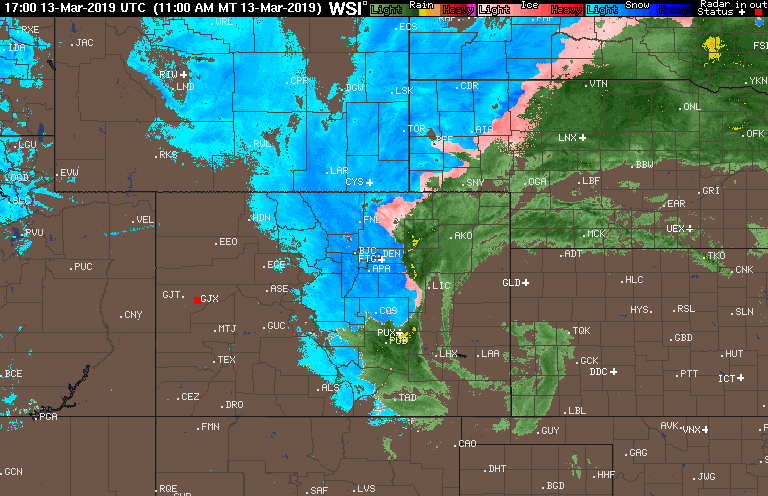
Radar animation from mid-day Wednesday when the storm was near its maximum intensity. Is that a snowicane?
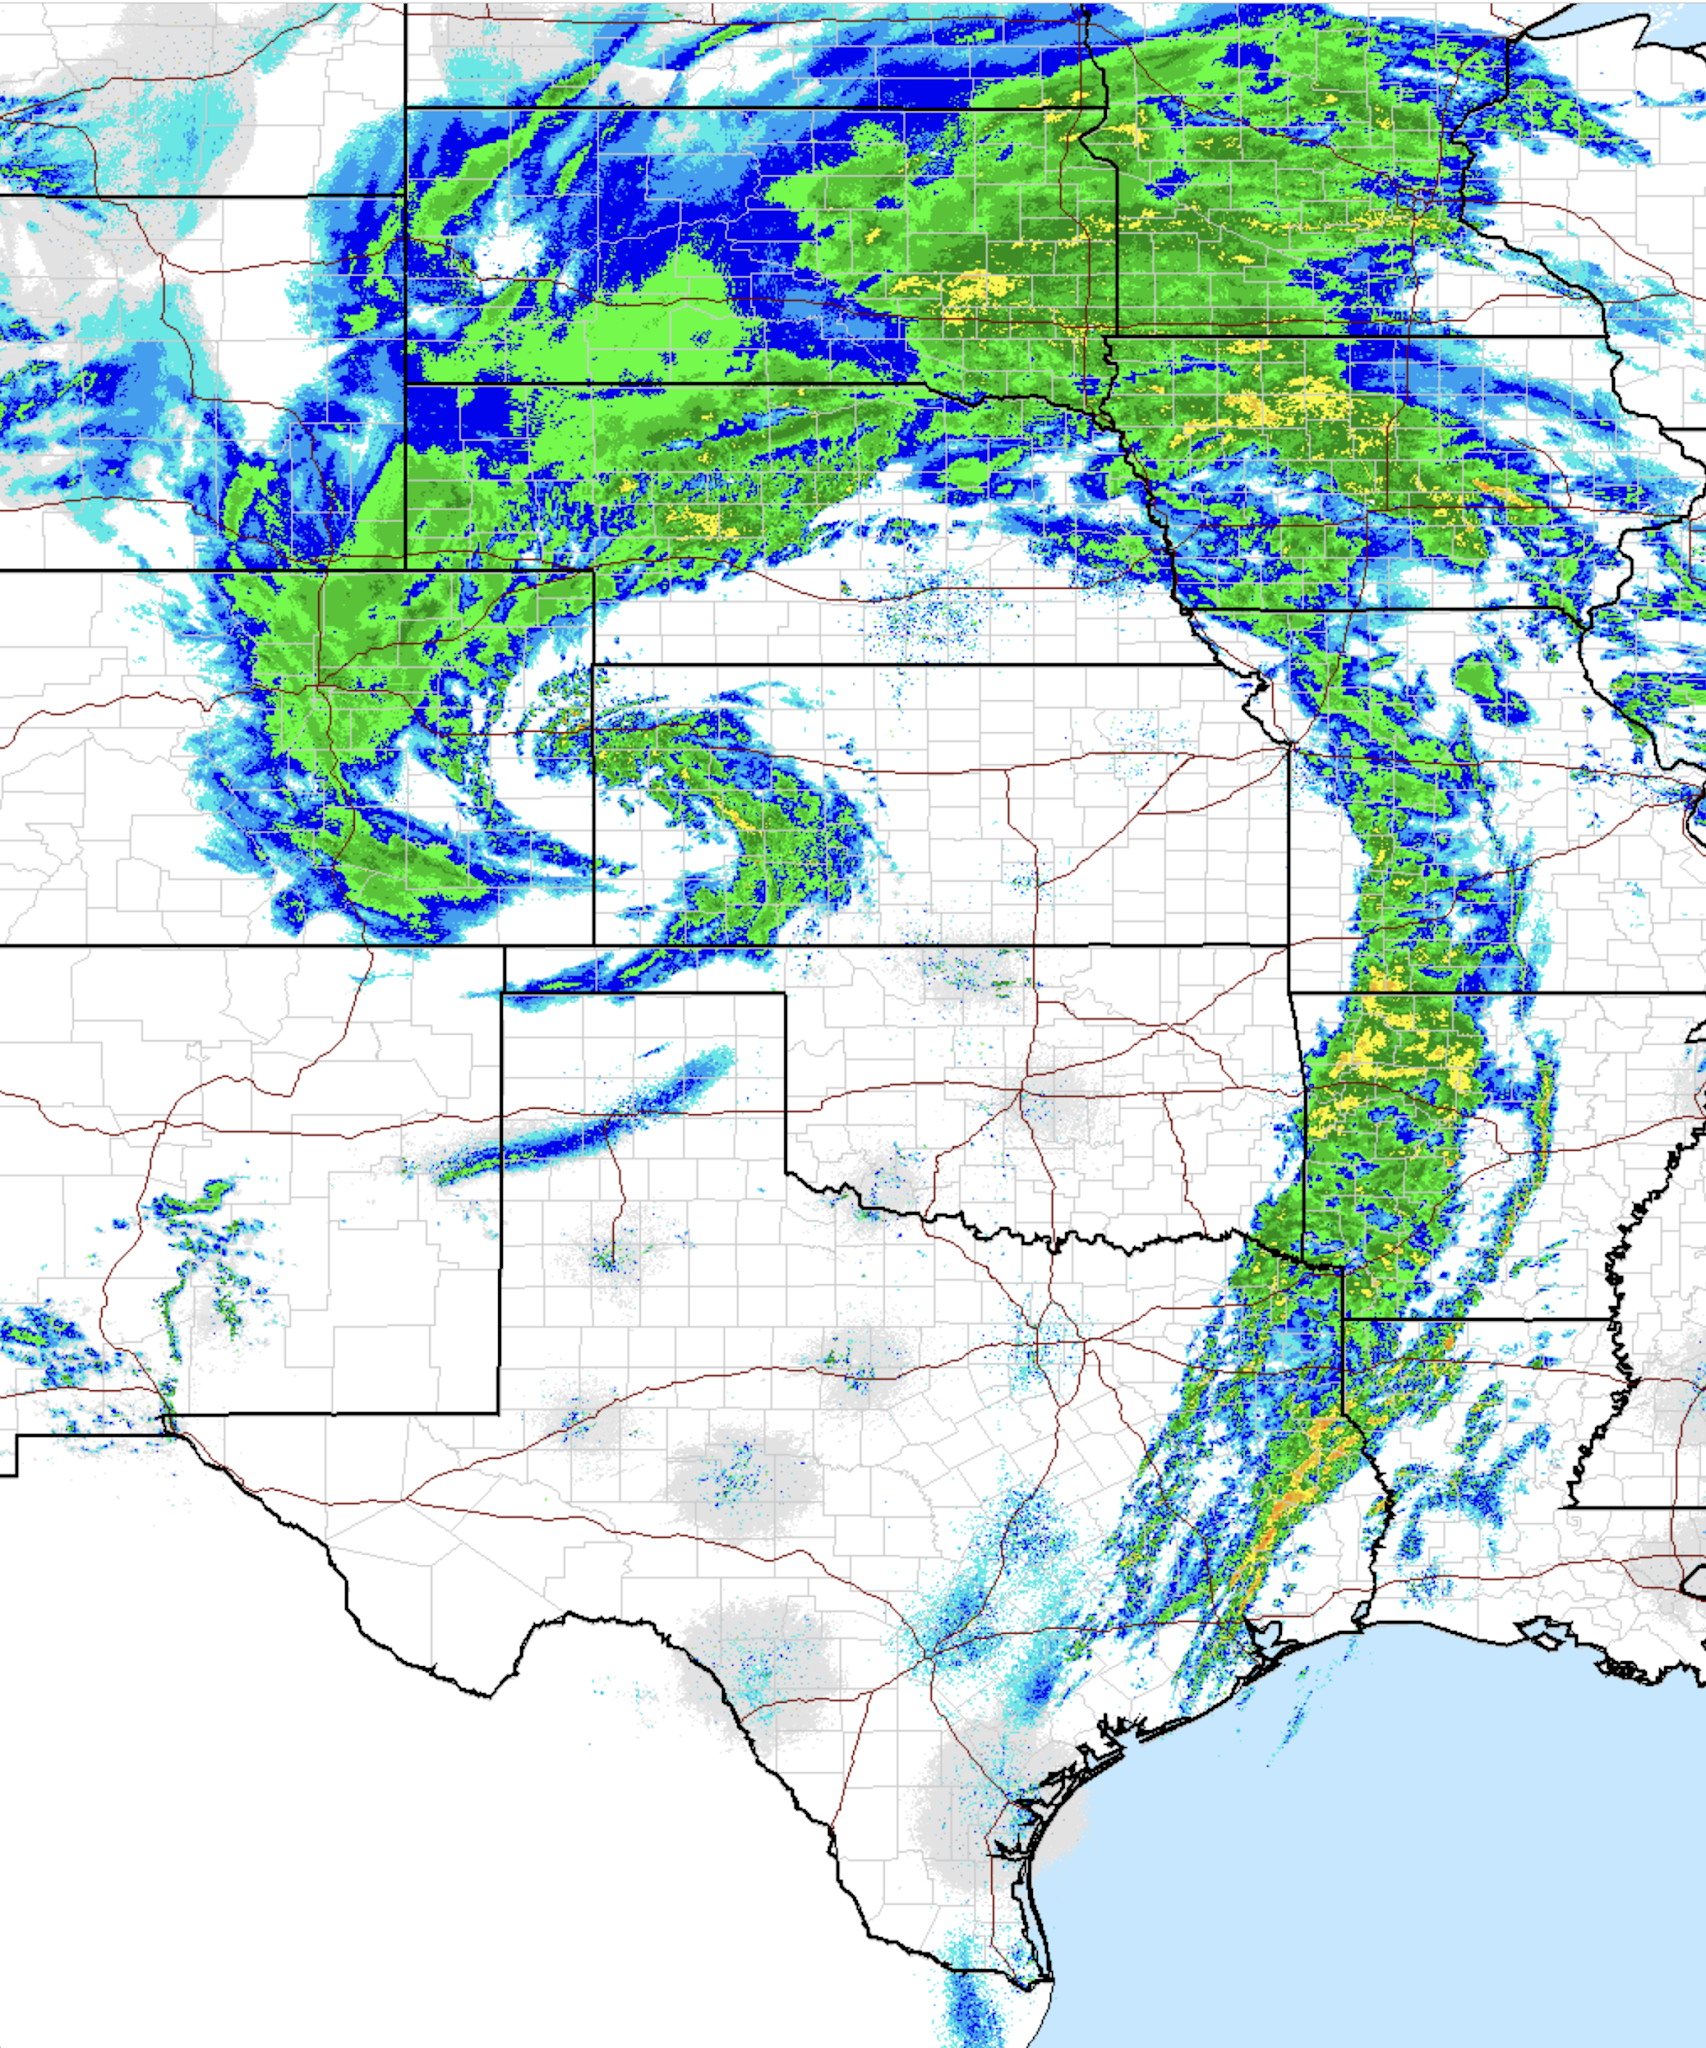
Zooming out, we see the classic “comma” shape signifying the presence of a moisture-rich warm conveyor belt streaming into Colorado from the northeast.
And let’s not forget that spring is nearly upon us. The warm portion of the storm, both geographically and temporally, produced more than 8000 lightning strikes, including some just east of DIA and just north of Fort Collins. There were even reports of thundersnow near Evergreen during the height of the snow Wednesday morning.

Map of lightning strikes from the storm
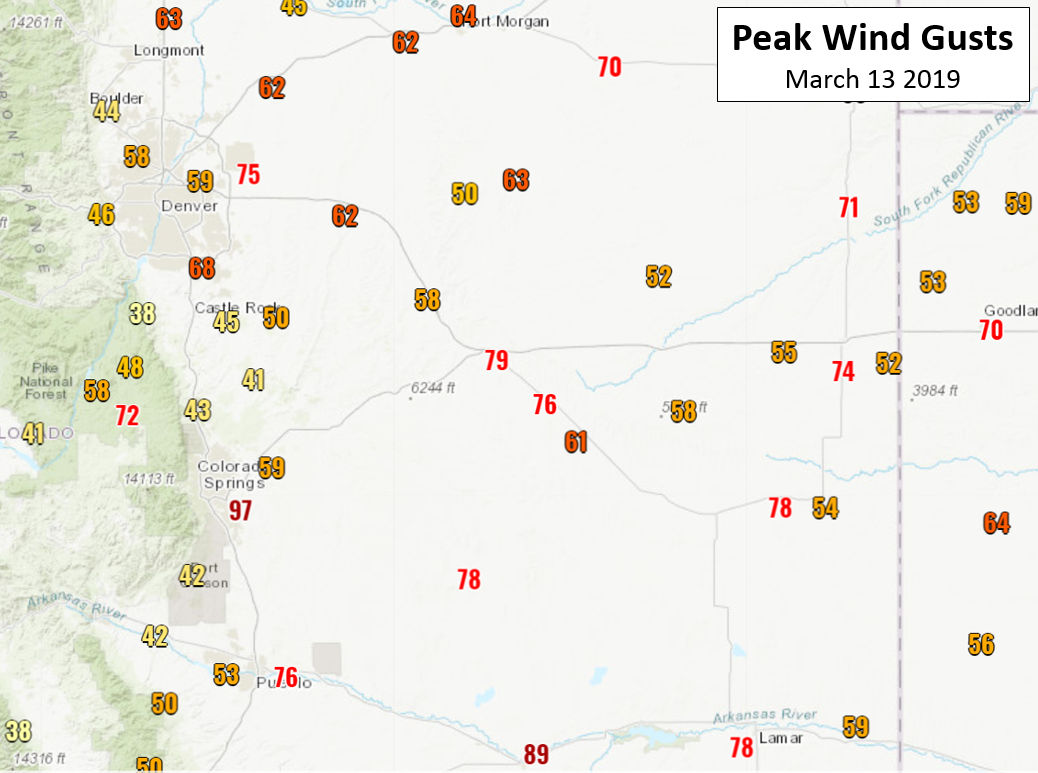
The most memorable aspect of this blizzard for most of us will be the wind. Despite actual snow amounts adding up to less than 6″ for most places, winds approaching hurricane force at times caused widespread white-outs, road closures and power outages impacting nearly a half million Front Range residents. The top gusts measured were 97 mph at the Colorado Springs Airport, 89 mph at La Junta Airport, and 80 mph at DIA. We just do not see these type of wind gusts as widespread as they were on Wednesday.
At BoulderCAST Station, our peak wind gust was only 42 mph. Though admittedly, the anemometer was heavily caked in wet snow throughout the day. This did match up well with the peak gust at Boulder Municipal Airport (44 mph).
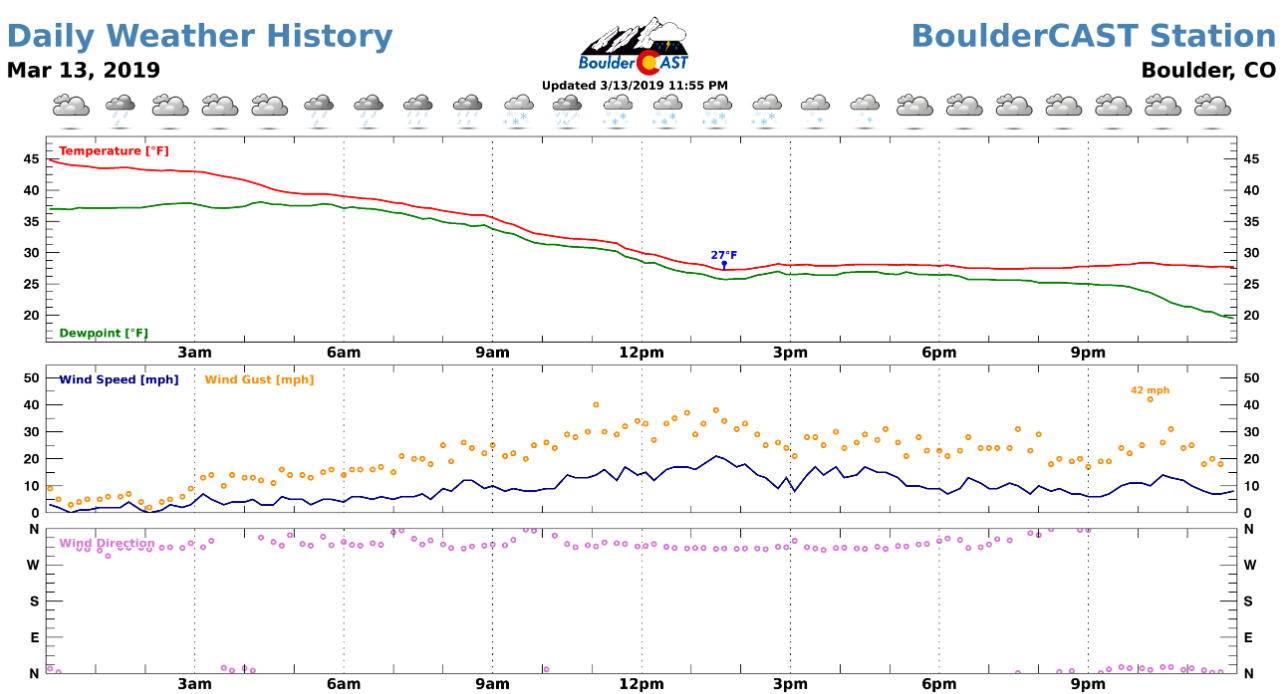
Daily weather history graph from BoulderCAST Station on March 13, 2019.
Snow totals across the Front Range spread from one inch to just shy of two feet. Though, getting a representative snow measurement given the extreme winds proved to be quite the challenge. Even with winds of only 42 mph at BoulderCAST Station, we were hard-pressed to measure more than an inch of snow that wasn’t part of an obvious snow drift. Precipitation measurements during a blizzard are extremely unreliable. Take one look at the actual precipitation reports from co-op observers below and you’ll see what I mean. Keep in mind these are reports of liquid equivalent, that is, snow that was collected in some type of gauge, melted into water, then measured like rainfall.
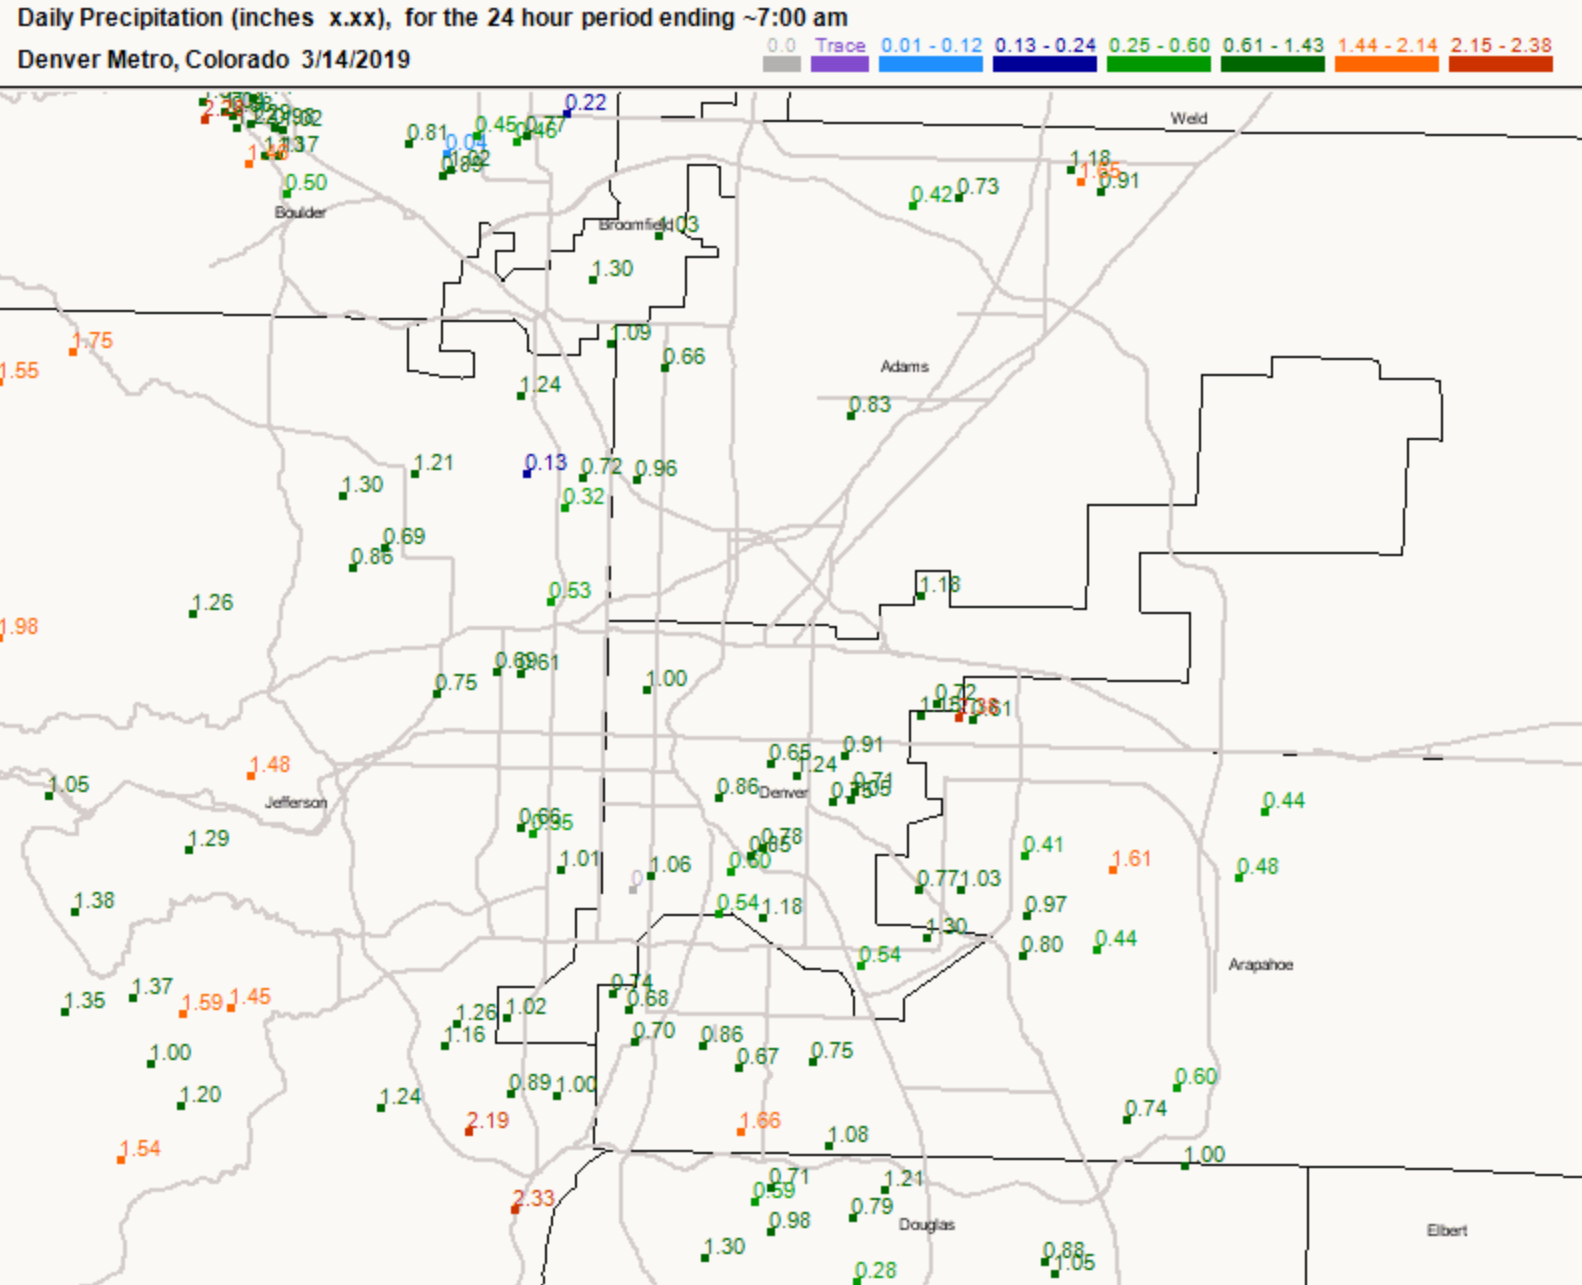
It’s clear that hyper-local drifting was at work…with impossibly large variation in amounts over very small distances. For melted liquid measurements, there is not much you can do about this, however. Even the professional weather station at DIA struggled to come up with a realistic observation on Wednesday, measuring so little liquid that the implied snow ratio was close to 30:1, an impossibly high value for how wet the snow actually was (did you build a snowman, too?).
Fortunately, snow accumulation measurements during a blizzard have a defined method to reduce error. Several measurements are taken from an open area where the snow has not drifted, being careful only to measure new snow. Then an average of the various measurements is calculated to arrive at a representative amount for that location. It’s not perfect, but it works.
Shown below is our snowfall forecast map with actual storm totals overlaid in boxes. Green boxes indicate that our forecast verified to within one inch of the observed snowfall. Red did not. Our “donut hole” forecast for the Boulder area worked out quite well, with winds and snow totals the least impressive out of anywhere in the Front Range. Boulder officially reported 2.9″ of snow, while Denver International Airport secured 7.1″.
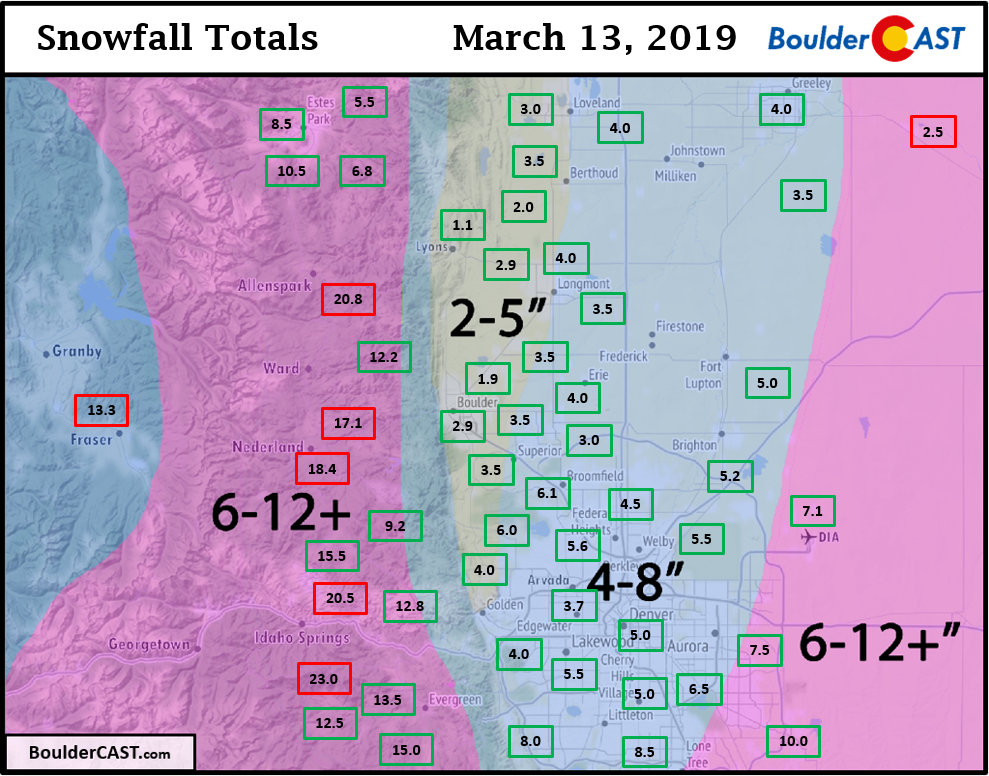
Overall, our forecast verified almost perfectly, with the exception being the huge totals coming out of the Foothills of Boulder and Jefferson Counties. We attribute this anomaly to a brief but extremely strong period of upslope the occurred Wednesday morning during the time where moderate to heavy rain was still falling across the warmer lower elevations. From the wind profiling radar in Platteville, we can see that 30+ mph potent upslope was present above the surface and lasted from about 5:00 AM to 12:00 PM (see below). Furthermore, notice that near ground level, winds were very strong and northwesterly throughout the entire duration of the storm. This was one of the main reasons for the “donut hole” forecast. Low-level downslope never bodes well for Boulder, even with a historically strong storm system spinning just 100 miles away…

Finally, let’s not forget that precipitation commenced with a few hours of moderate to heavy rainfall early Wednesday morning. That rainfall was heavy enough for minor street flooding to be reported. Observations show more than 0.75″ of rain fell in Boulder before changing over to snow late Wednesday morning…quite the unexpected for this time of year!
Was it Colorado’s strongest storm ever?
In all likelihood…YES this was Colorado’s strongest storm on record, at least from the standpoint of central pressure. The lowest central pressure actually measured during the event was 970.4 mb in Lamar, Colorado around noontime on Wednesday. This is very likely to become a new state record.
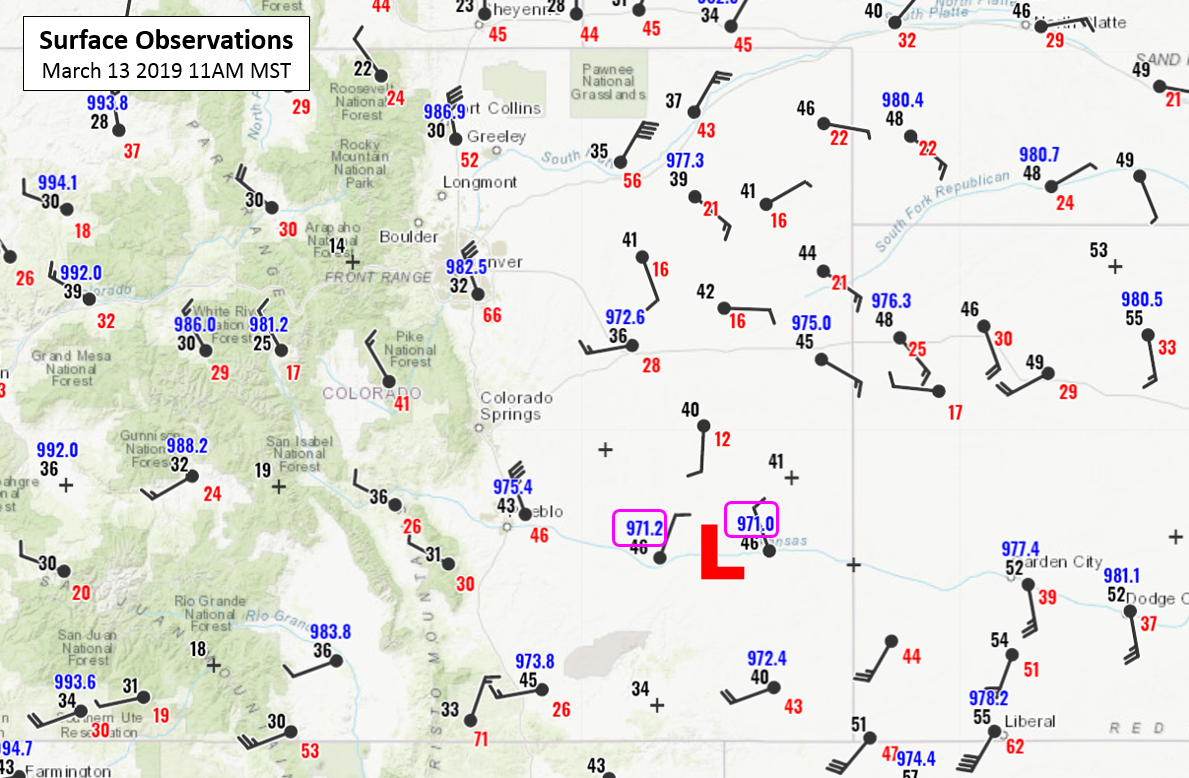
Surface observations from eastern Colorado at 11AM on March 13, 2019. The approximate center of the surface low is shown with the red “L”. The lowest pressure values are boxed in pink.
The WPC surface analysis from 12PM estimated the central pressure of the storm at 968 mb, equivalent to a Category 2 hurricane. Reliable observations of sea-level pressure are few and far between across the eastern Plains of Colorado, so that’s part of the reason this theorized minimum value will probably go unconfirmed.
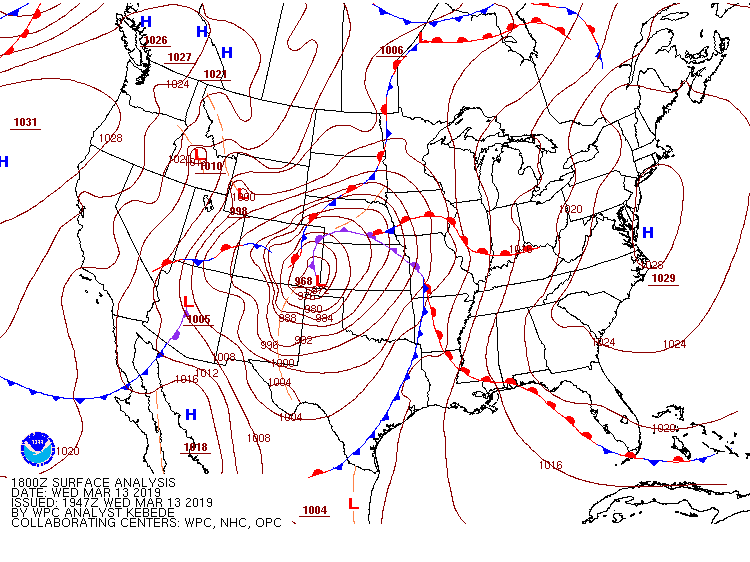
Surface analysis from 12PM on Wednesday March 13. The central pressure of the storm is estimated to be 968 mb.
Based on some digging by state climatologist Russ Schumacher, the previous record low pressure was around 972 or 973 mb, though past observational data is often sparse and unreliable, especially across the eastern flat lands where such a pressure extreme would have been most probable to occur. Thus, this week’s storm will likely be declared Colorado’s strongest.
We acknowledge that tornadoes can have extremely strong pressure gradients at their core, with sea-level pressure dropping as low as 850 mb in some of the strongest tornadoes. There are no measurements of this kind available in Colorado, and we’re strictly speaking about large-scale, mid-latitude storm systems, not supercell thunderstorms.
Why did the storm really happen?
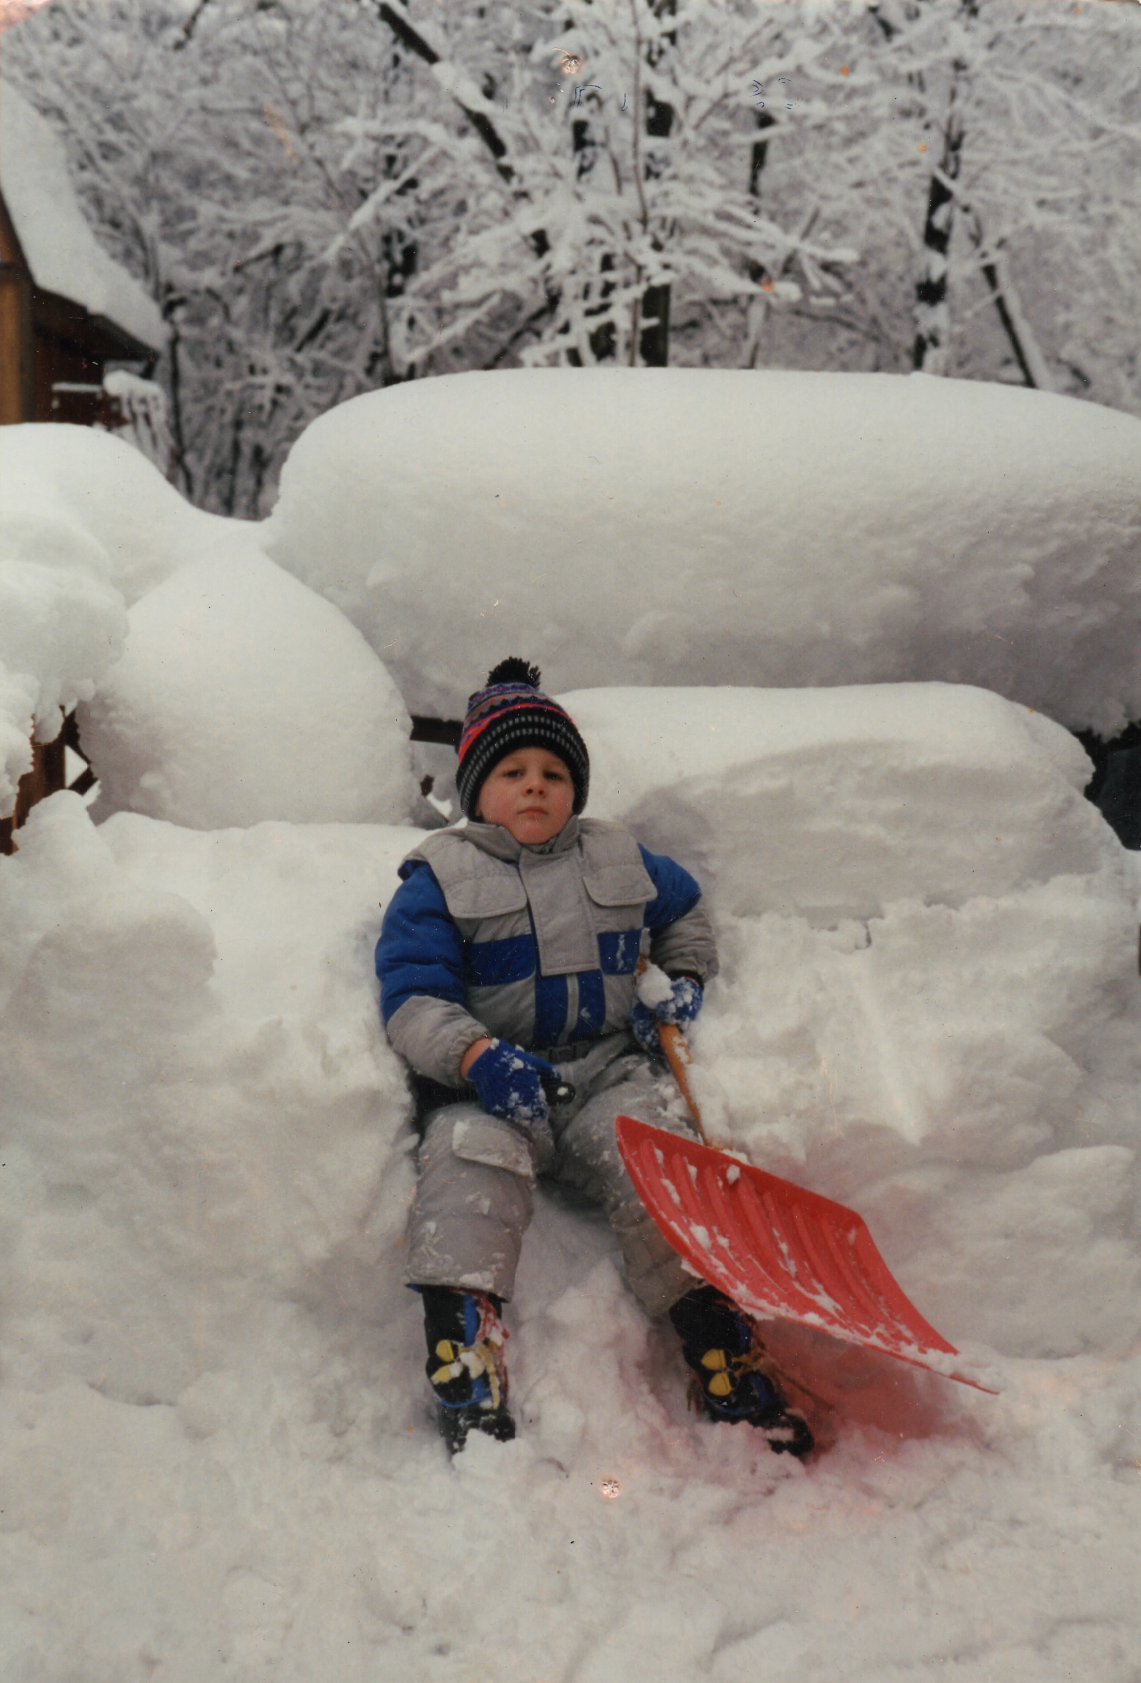
Just a few weeks ago, my mother randomly sent me a letter containing a photo from the day following the March 1993 Superstorm, taken exactly twenty-six years to the day before the blizzard that we endured this week in Denver. My hometown in southwestern Pennsylvania received nearly 36 inches of snow from that storm, which by the way, was also classified as a bomb cyclone. Is this a coincidence? It’s unclear. Maybe I’ll test the waters and ask my mom send over a few photos from 2010’s Snowmaggedon, you know, just to be sure…
In all seriousness though, collectively the weather models did a remarkable job in handling this historic storm from the very beginning, which in itself is no small feat considering it was an extreme event for our region, perhaps even a 50 or 100-year event. As we are all too aware from the 2013 Flood, edge-case weather events of this magnitude are not always predictable.
Was the buzz and hype surrounding this week’s blizzard justified? Absolutely. Despite the worst conditions only lasting for about four to six hours, these were indeed some of Denver’s darkest. We applaud all of the school officials, business owners, and event planners whom laid their trust in meteorologists. Your informed decision-making, your choice to proactively push the “pause button” on all of Denver for one random Wednesday in March without a doubt saved lives.
Spread this news about Colorado’s weather:


You must be logged in to post a comment.