2025 was one of those years where Boulder’s weather never seemed content with a single storyline. We opened with a bitter Arctic punch that delivered our coldest January in nearly two decades, only to swing into a summer packed with 90°+ heat, smoky afternoons, and the hottest day since 2012. The monsoon showed up often but rarely with much enthusiasm, fall dried out in a hurry, and our first snow didn’t arrive until November 29th — the latest on record by a country mile. Now that the dust (and smoke, and snow) has settled, we’ve pulled together a full graphical recap of the temperature swings, precipitation quirks, record‑setting moments, and long‑term trends that defined Boulder’s and Colorado’s atmosphere in 2025. If you want the full story behind the chaos — and a clearer picture of where 2025 truly landed — this is a fun one to dive into. Be warned, there really are 100 charts and visuals to explore. Enjoy!
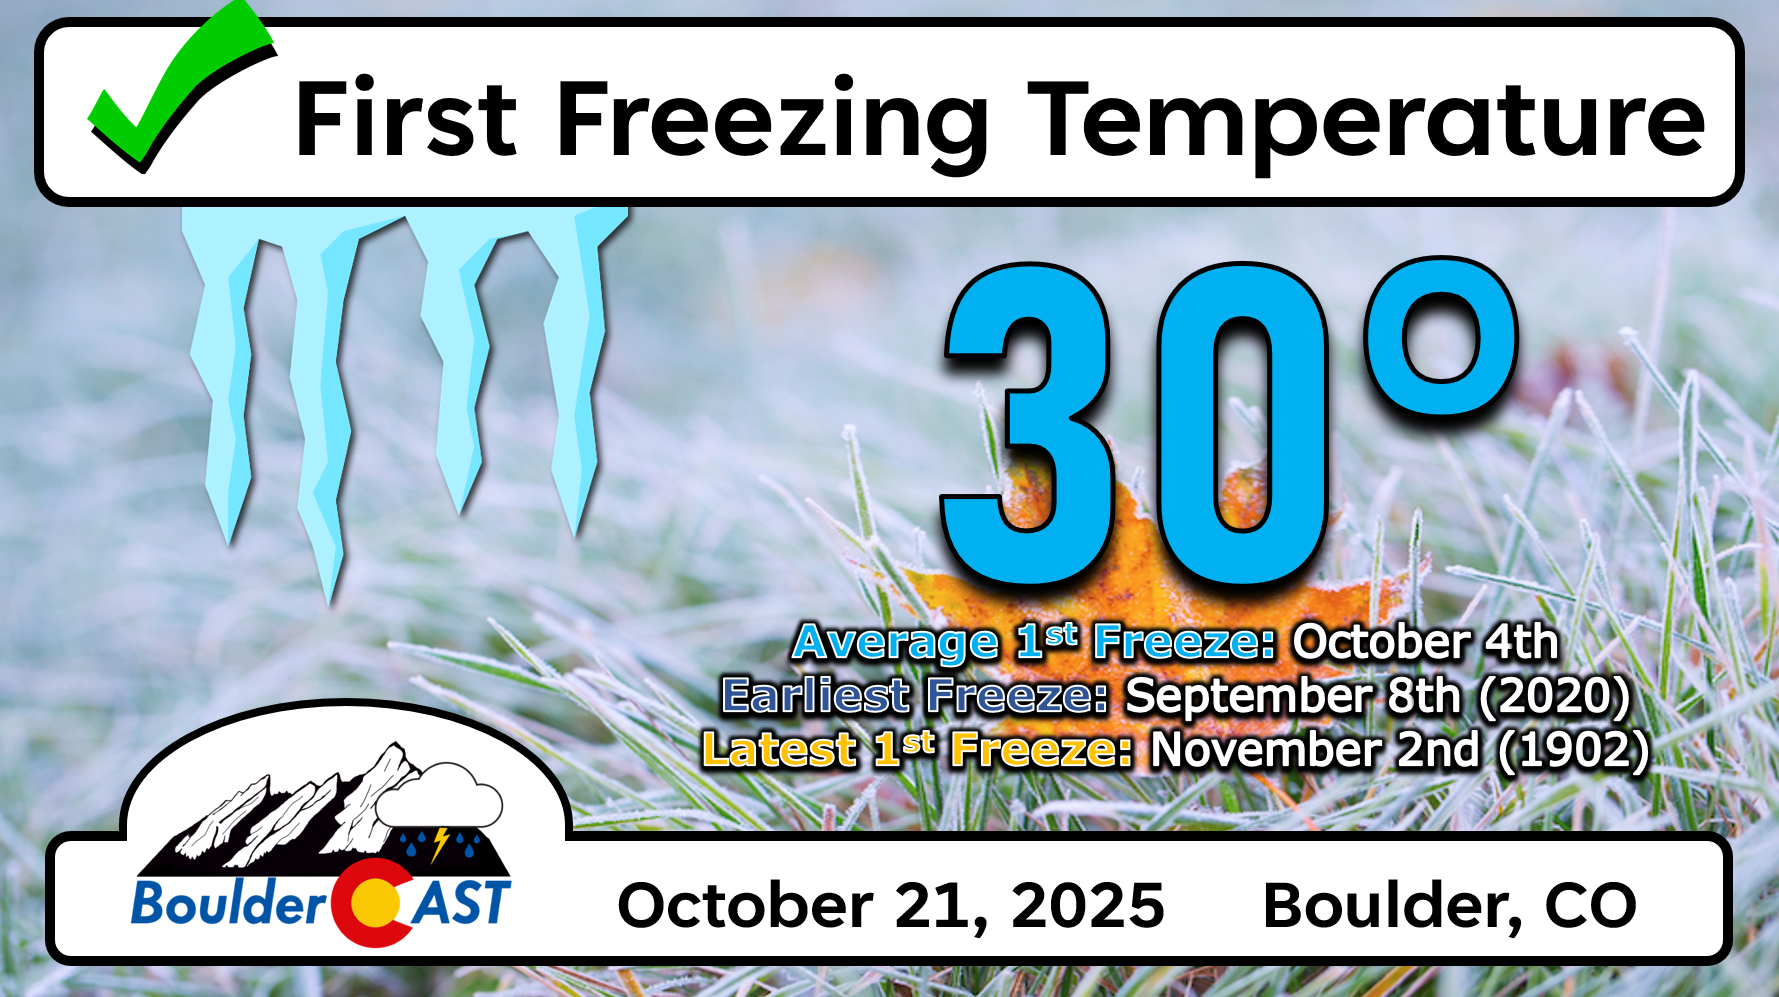
Our first graphic below highlights the biggest meteorological moments of Boulder’s wild ride through 2025. Which one was your “favorite”?
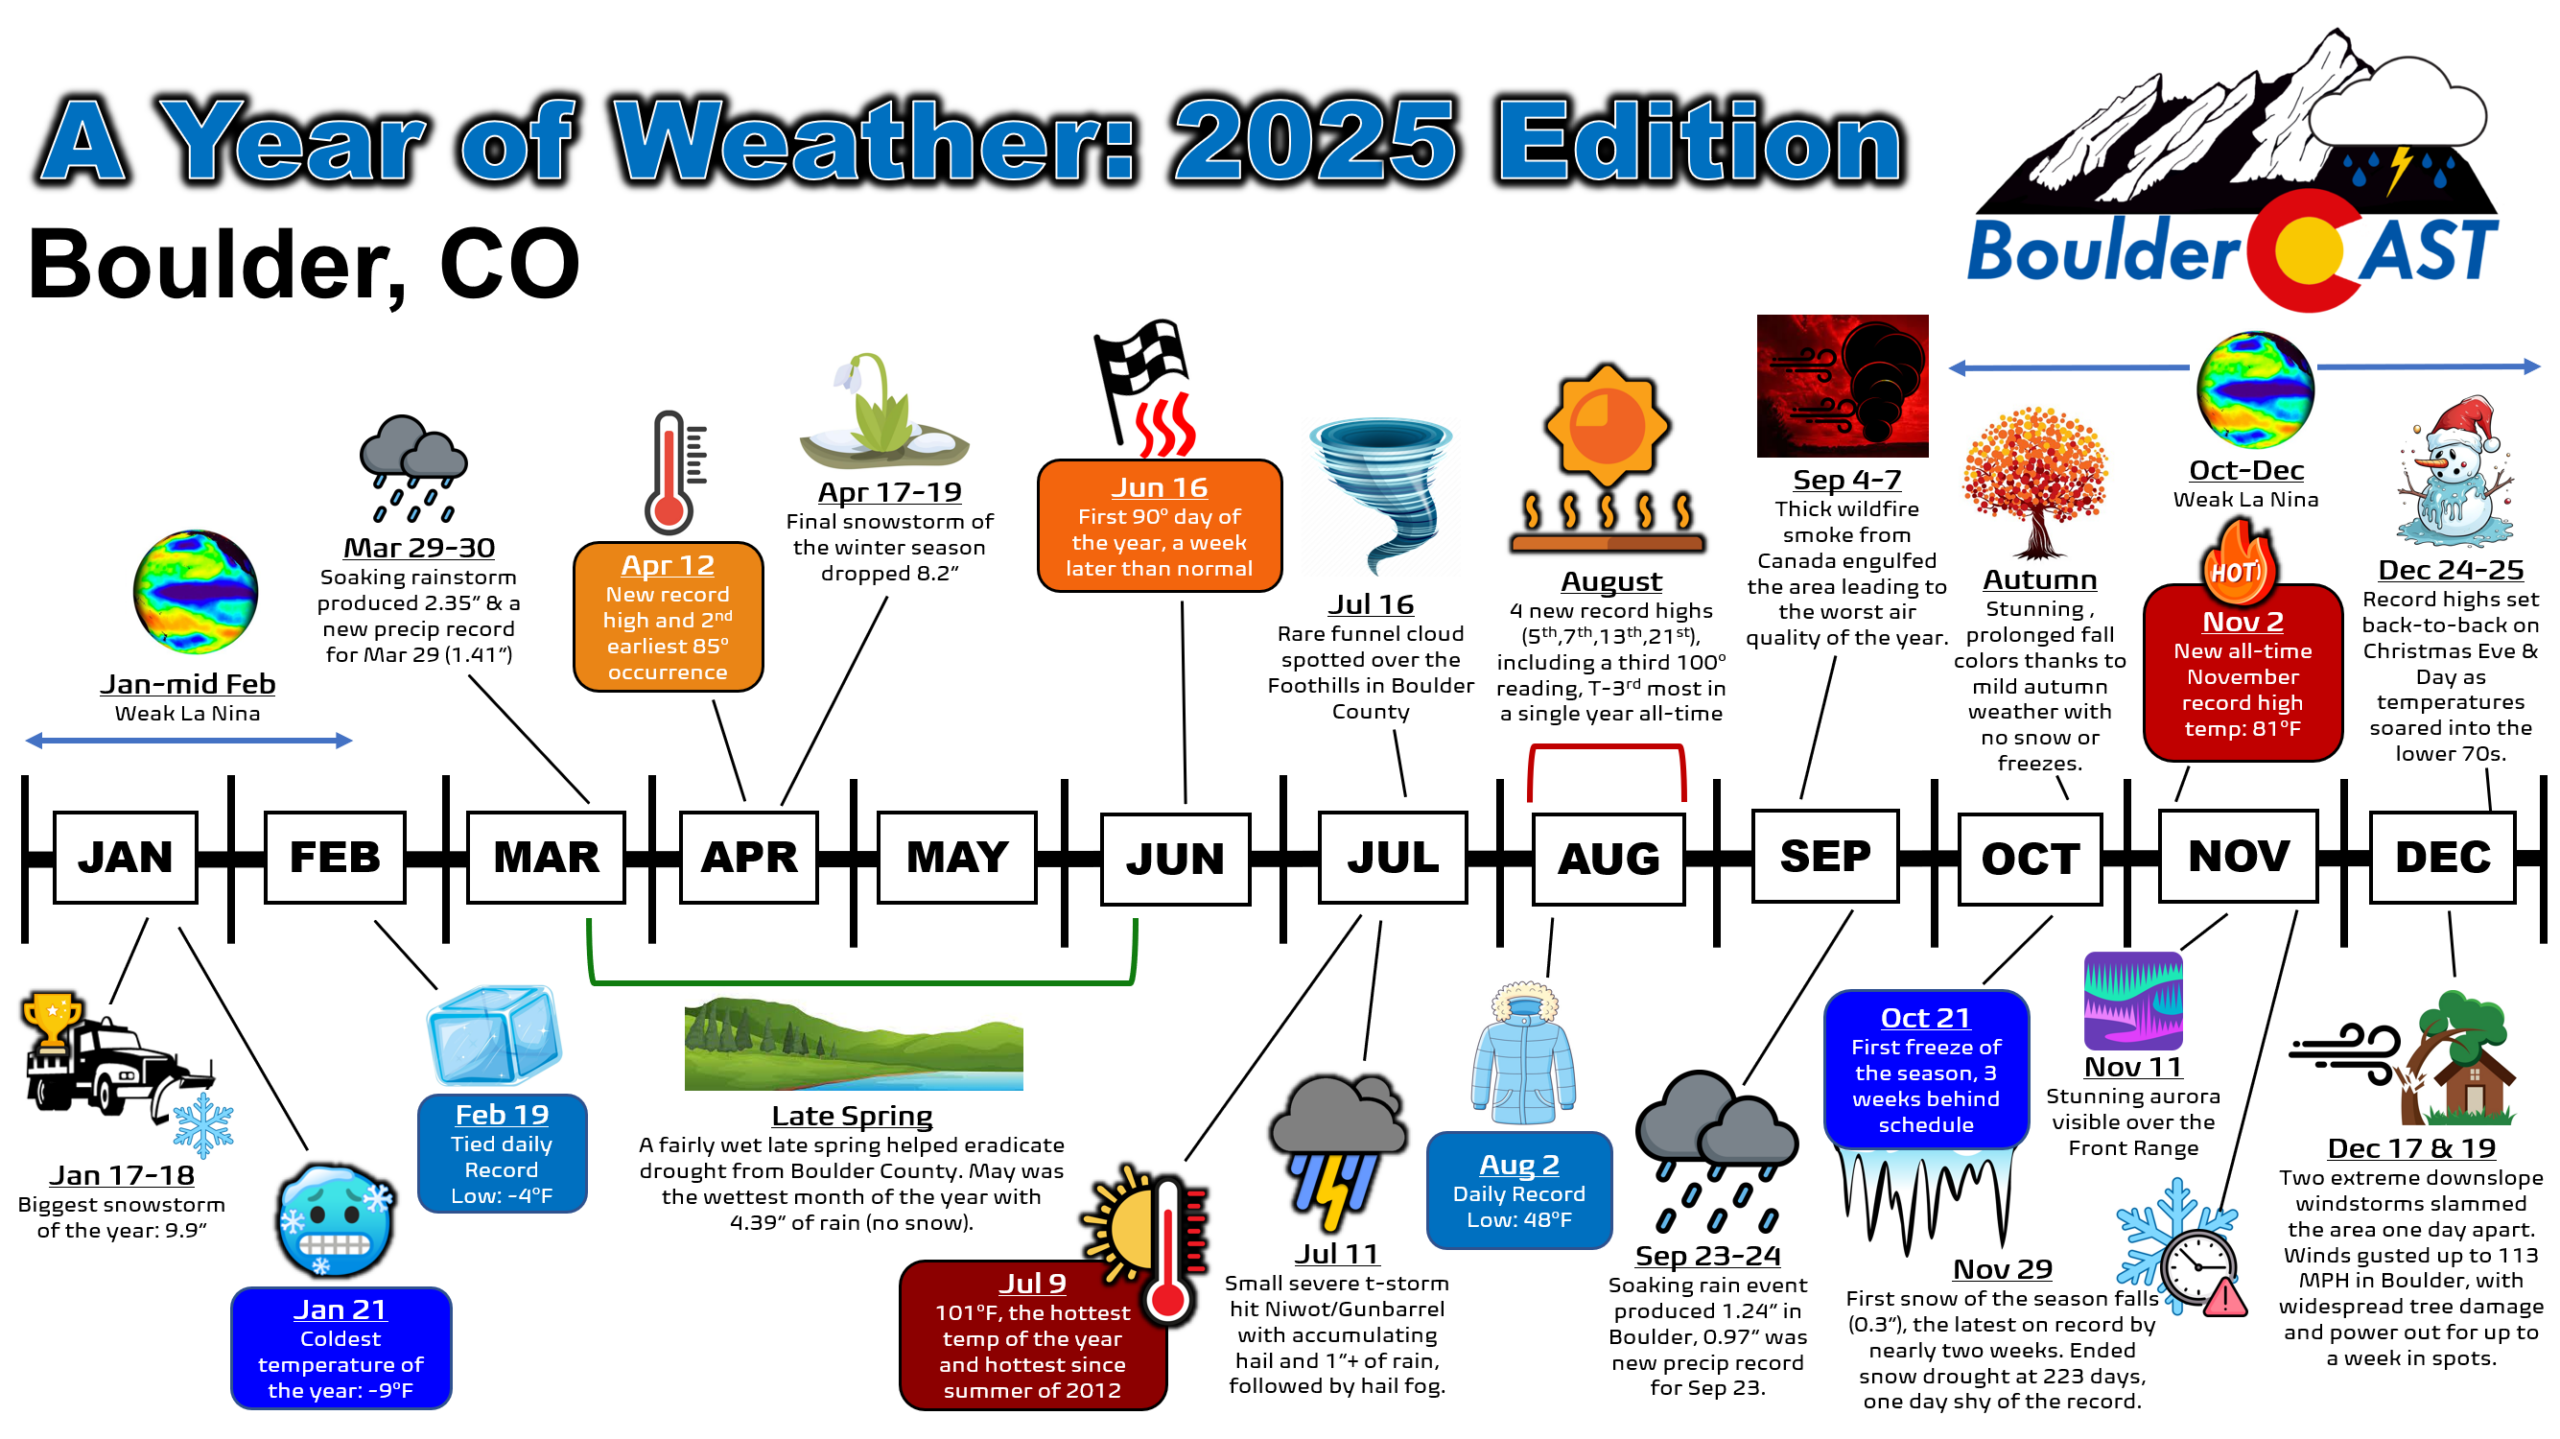
Click to enlarge!
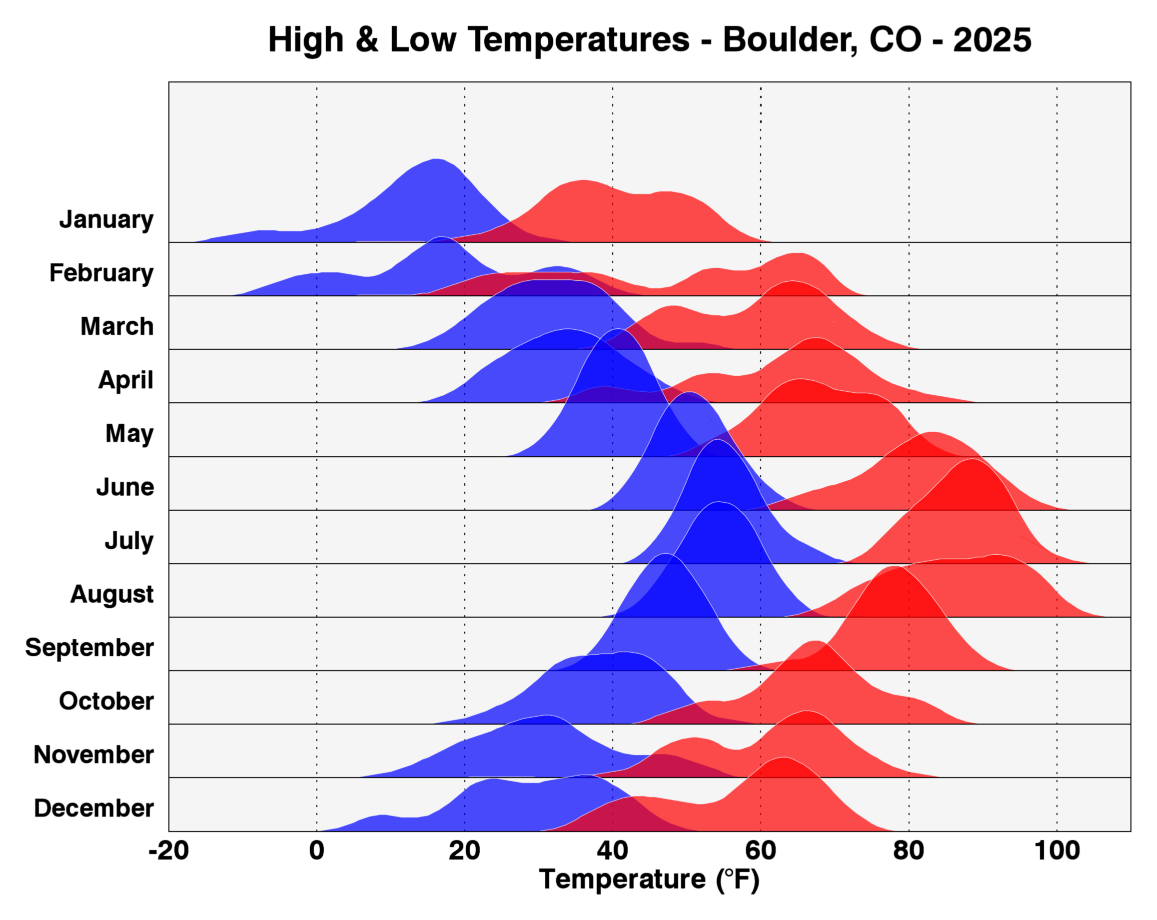
Temperature Distributions: A Year of Extremes
Our next graphic breaks down the monthly spread of high and low temperatures across the year — and if nothing else, it’s a reminder of just how dramatically Boulder’s thermometer can swing. From the bone‑numbing –9°F reading in January to the blistering 101°F scorcher in July, 2025 showcased the full amplitude of Front Range climate.
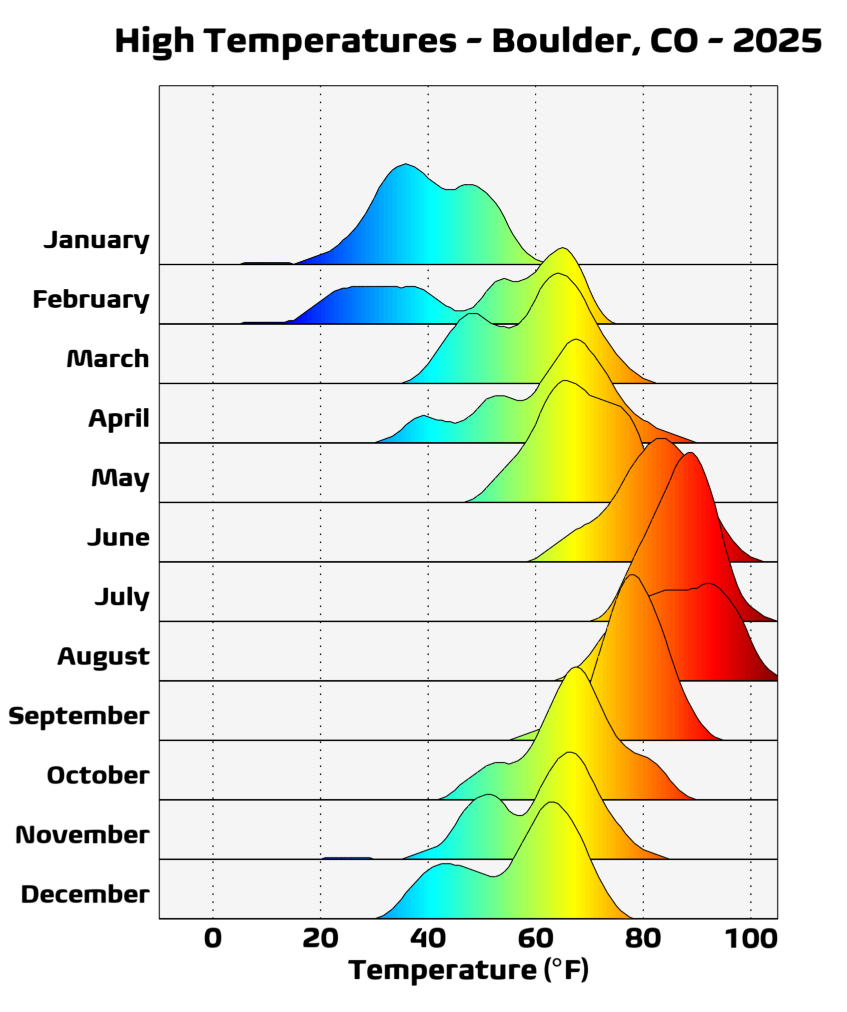
A second visualization zooms in on only the high temperatures, now with roughly 300% more color (scientifically measured, of course). Several months show clear bi‑ or even tri‑modal peaks — a hallmark of Boulder’s wintertime split personality. Depending on whether we’re under a warm, windy downslope regime or a calm, cold Arctic air mass, temperatures can vary wildly day to day. Summer, by contrast, is much more well‑behaved. With the polar jet shoved deep into Canada, our warm‑season highs tend to cluster into a tighter, more predictable range.
A Bitter Beginning: January 2025
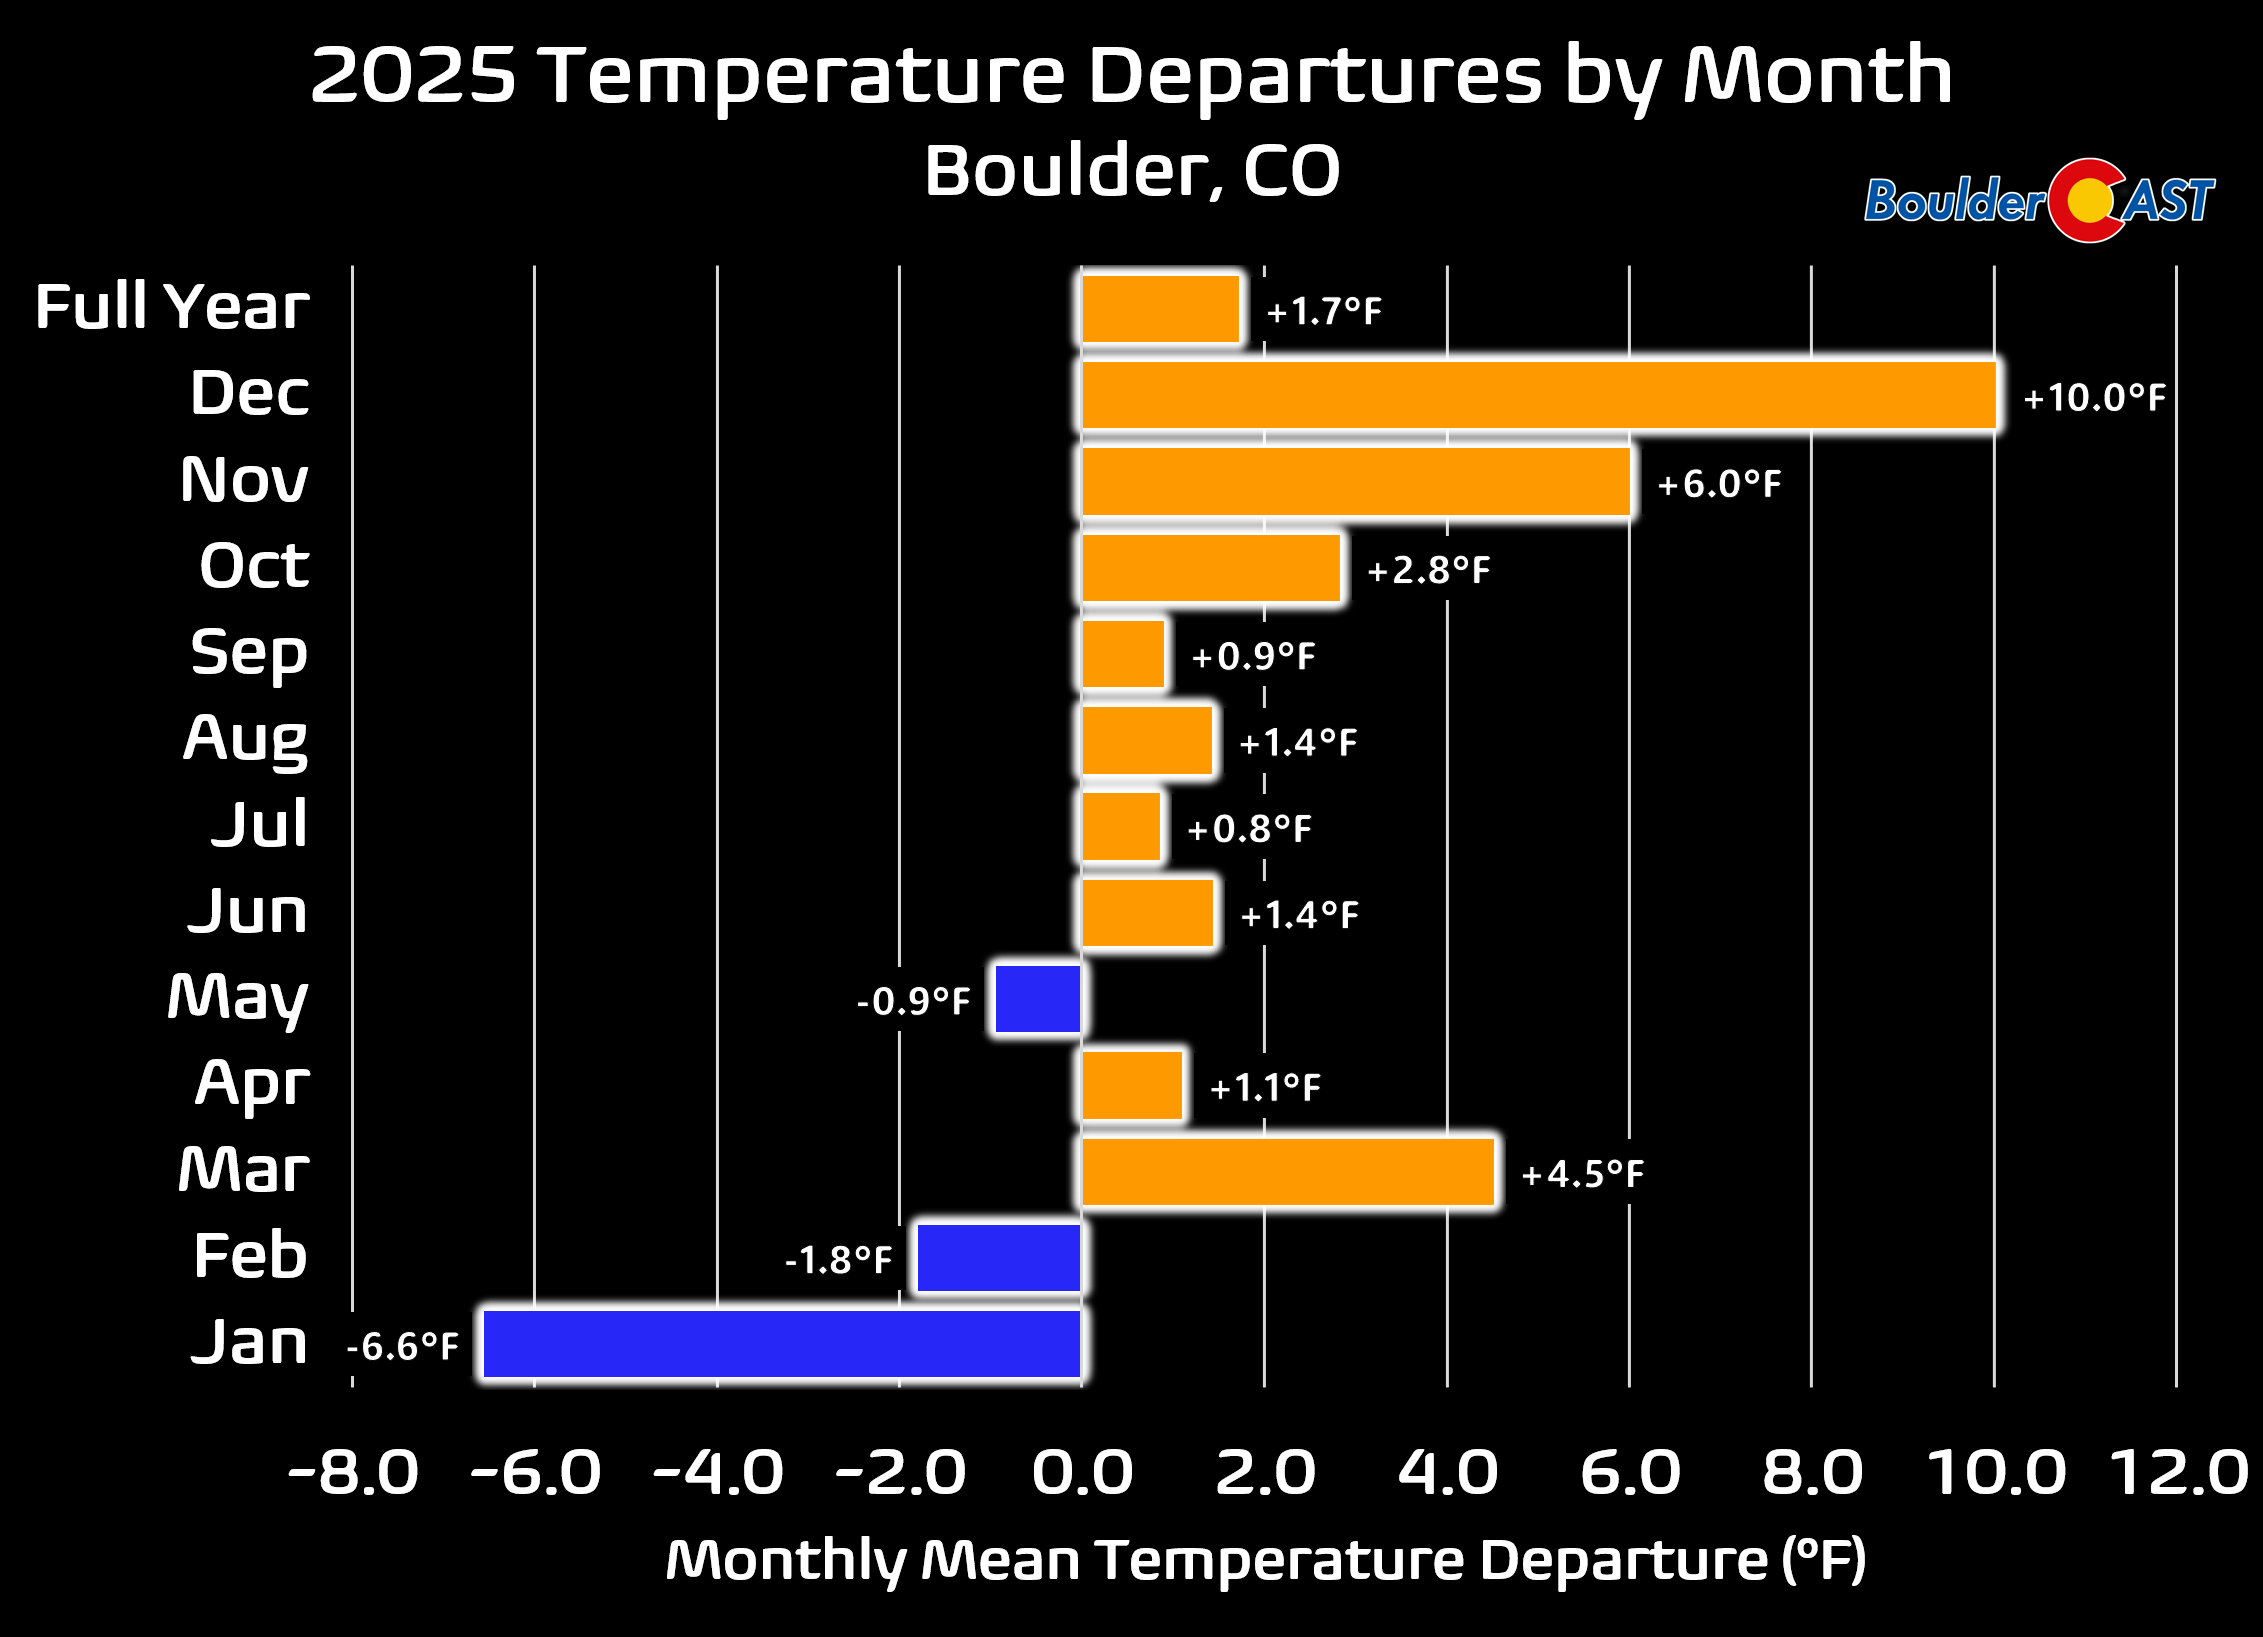
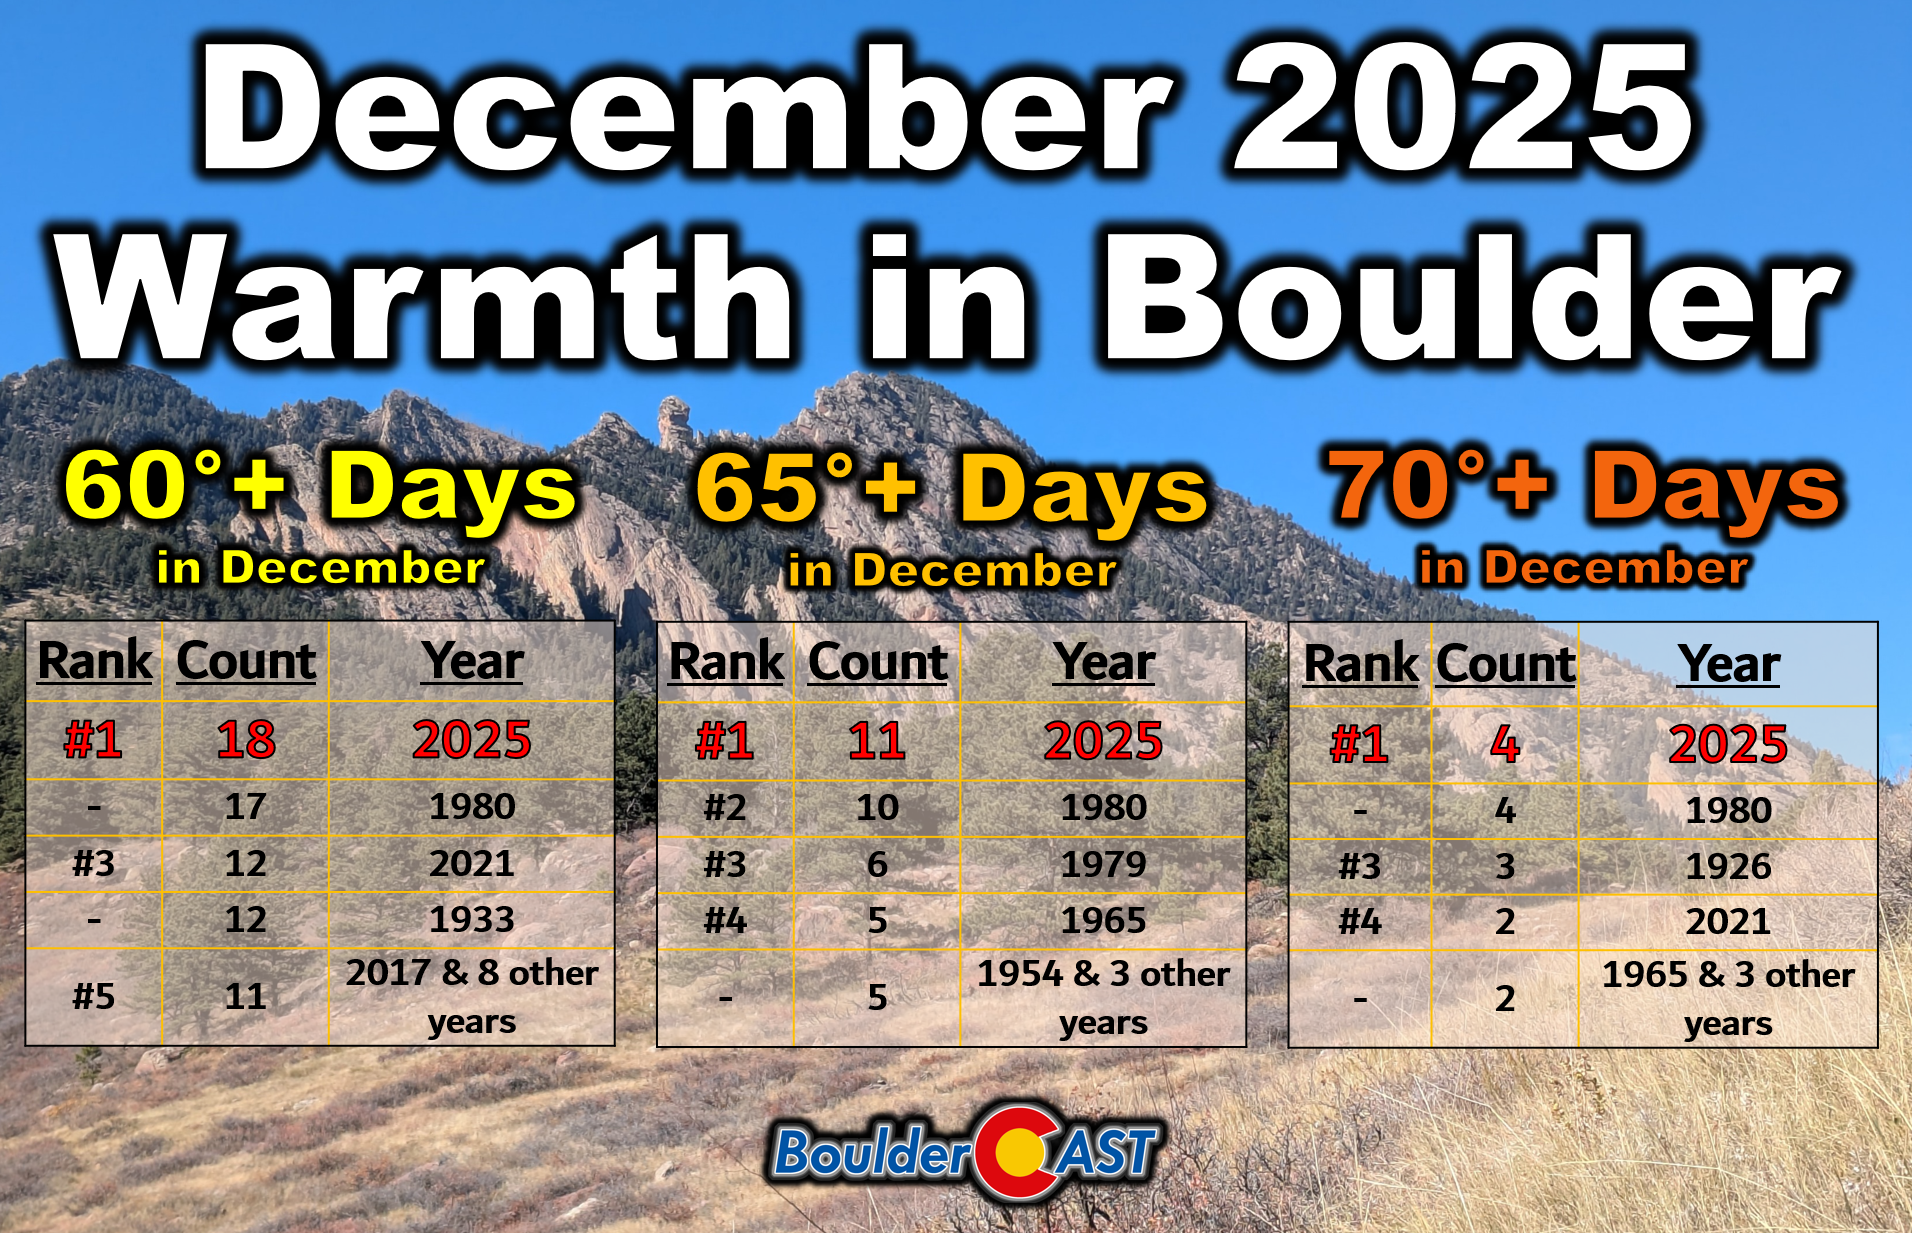
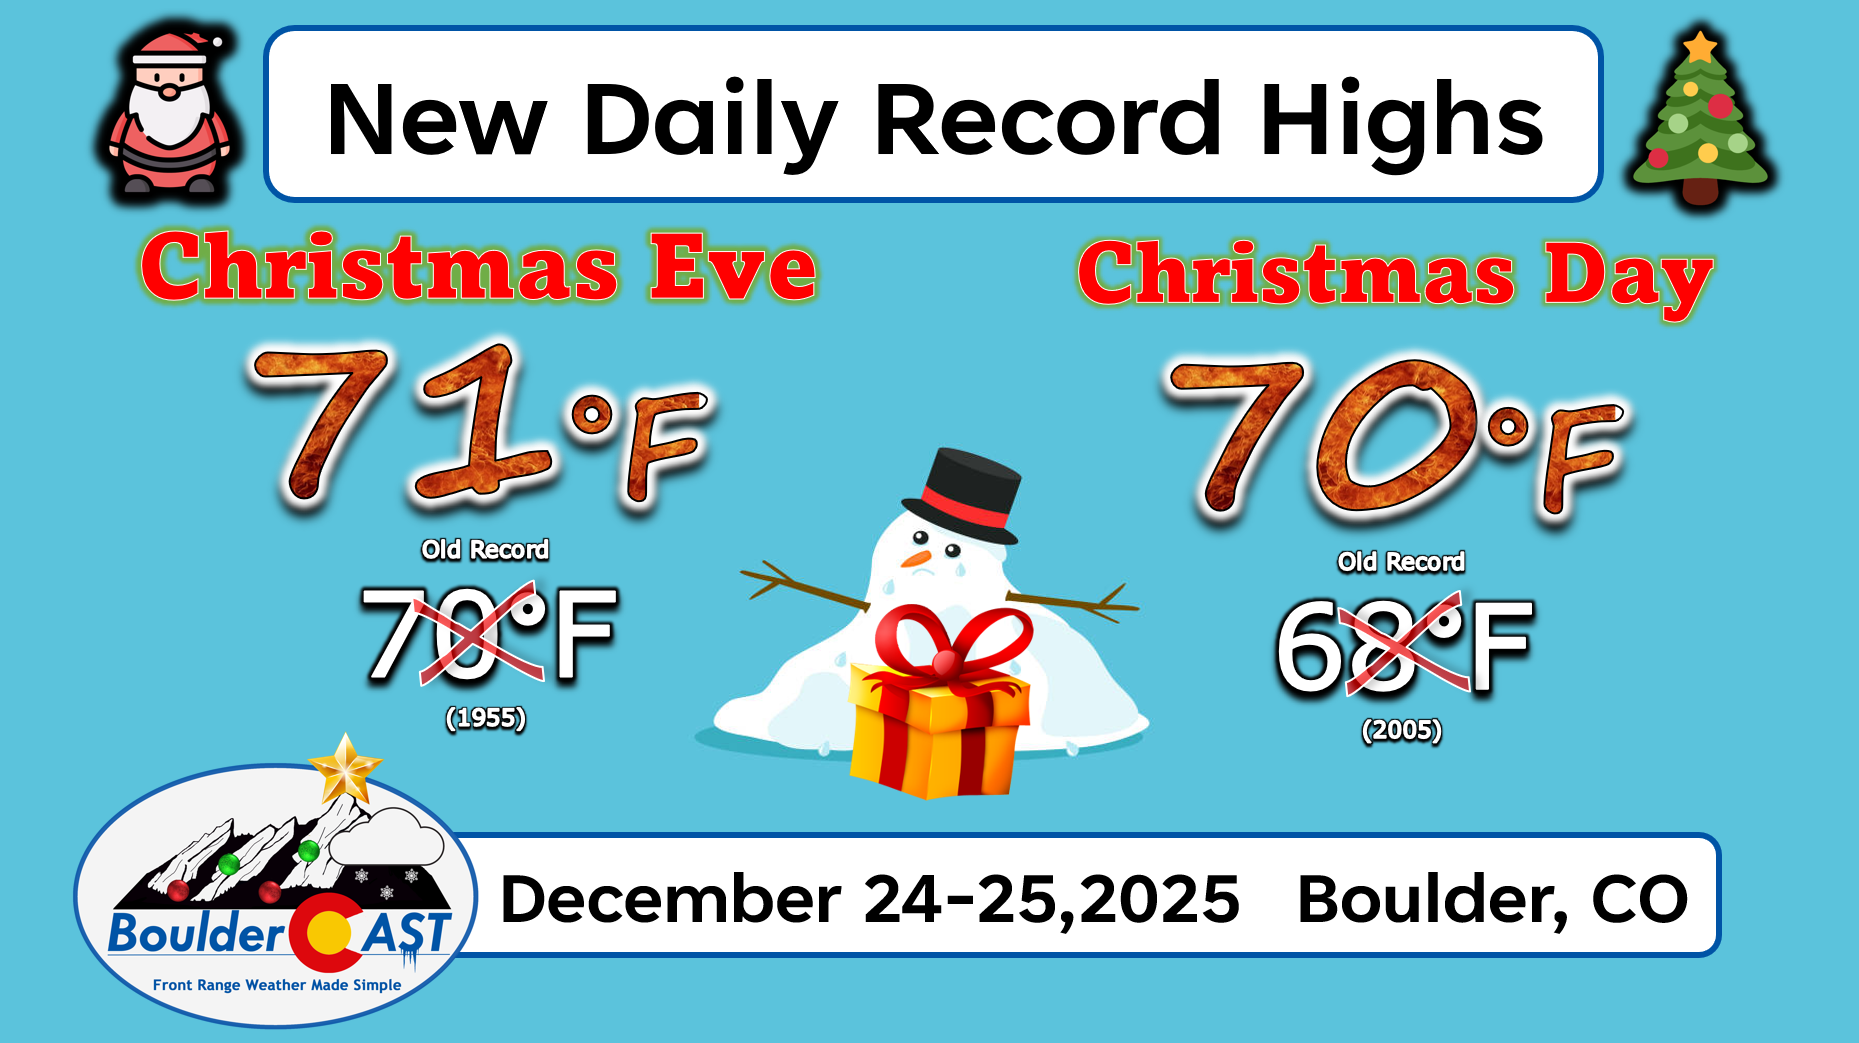
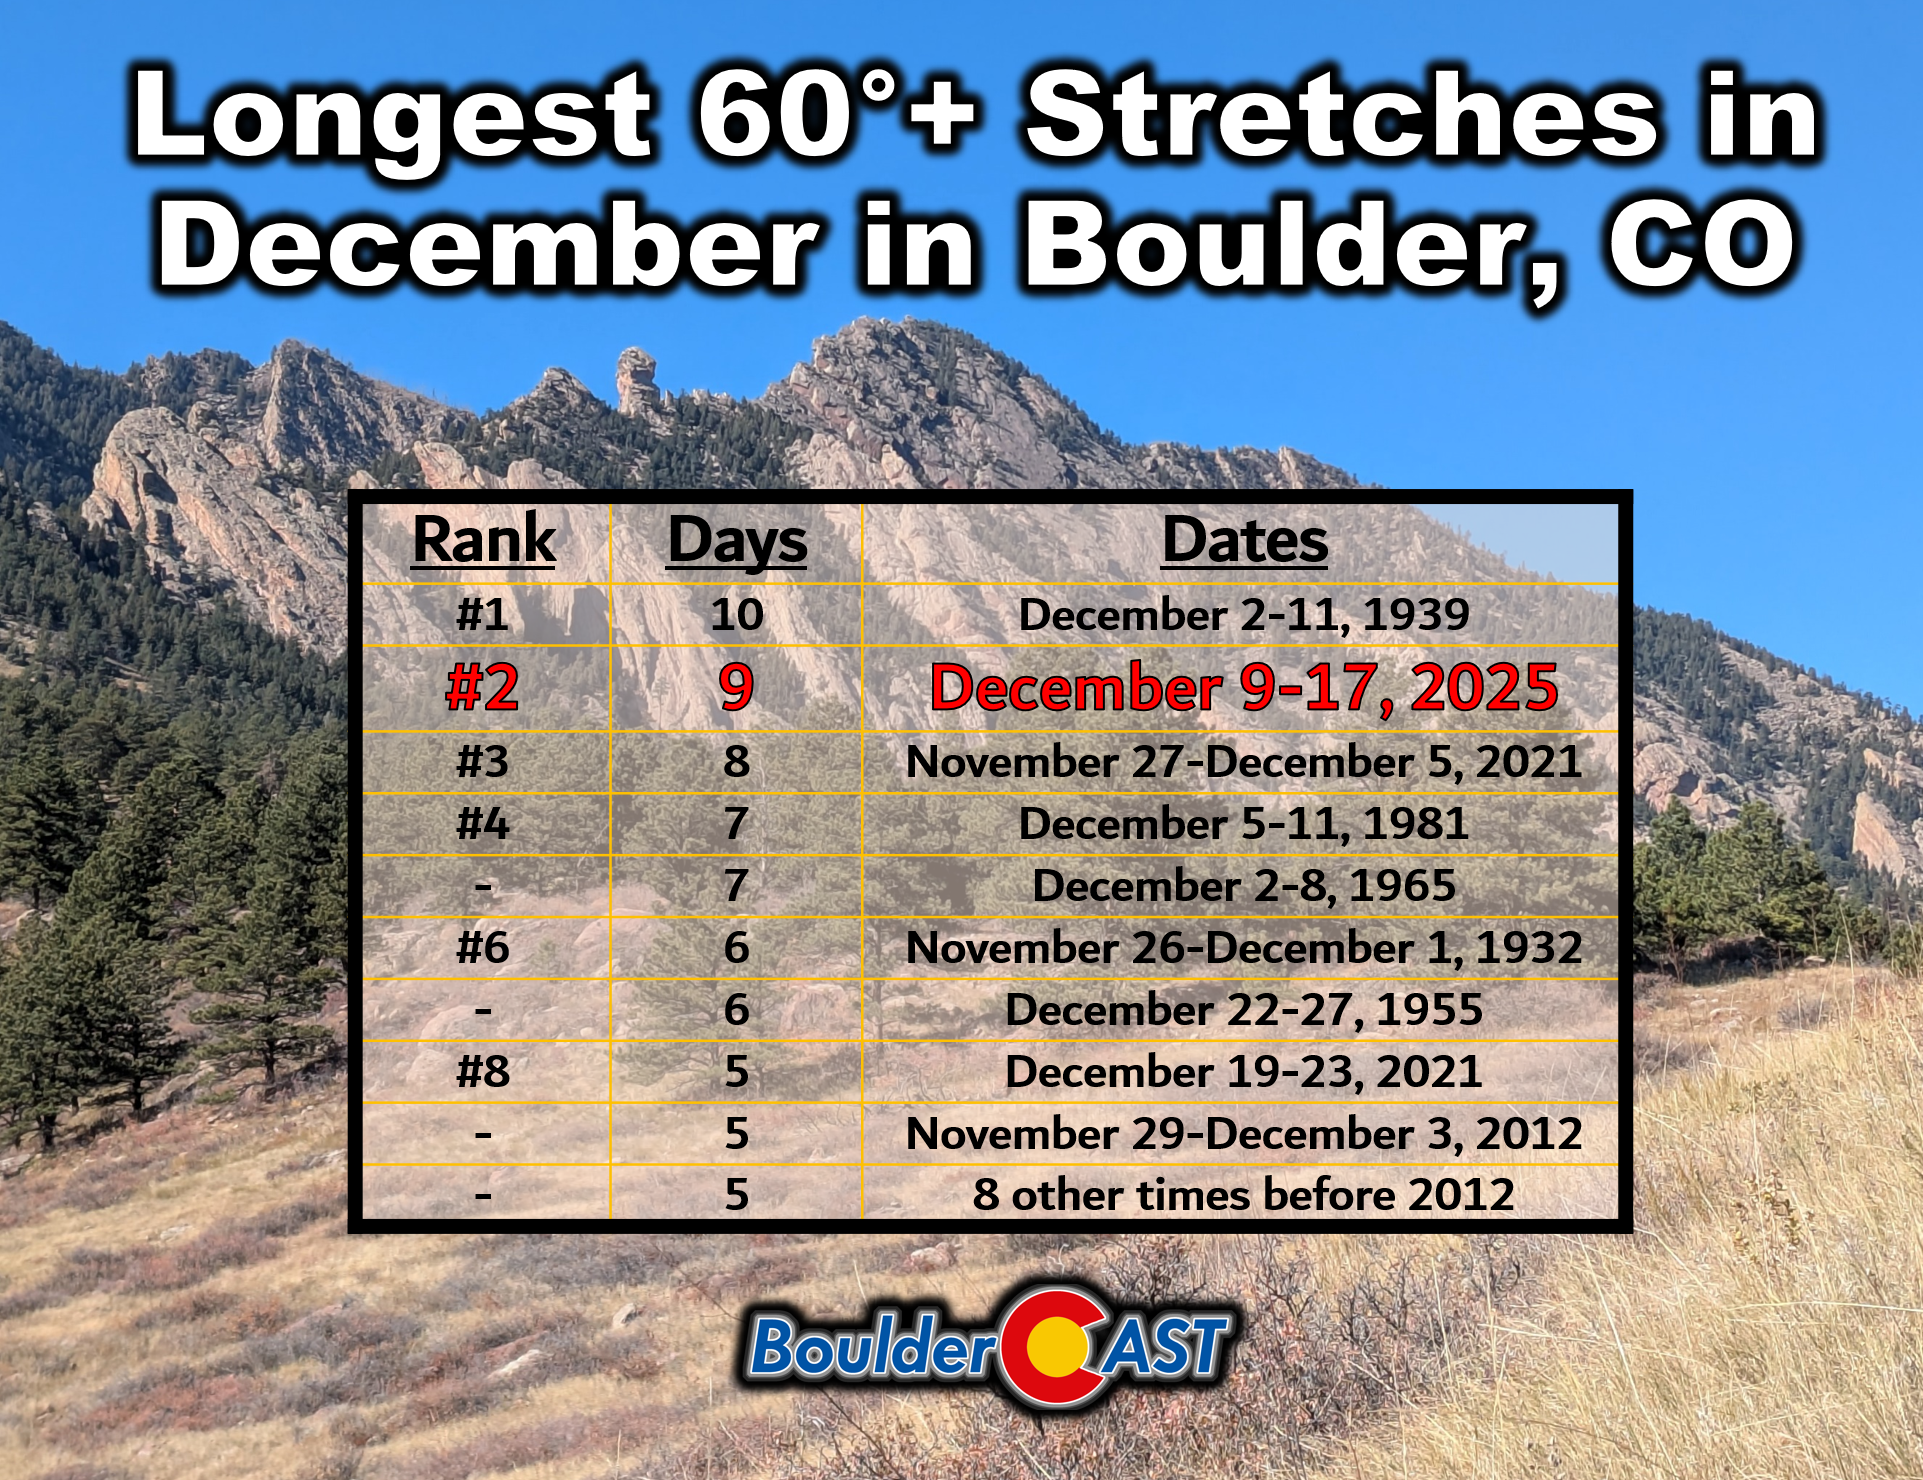
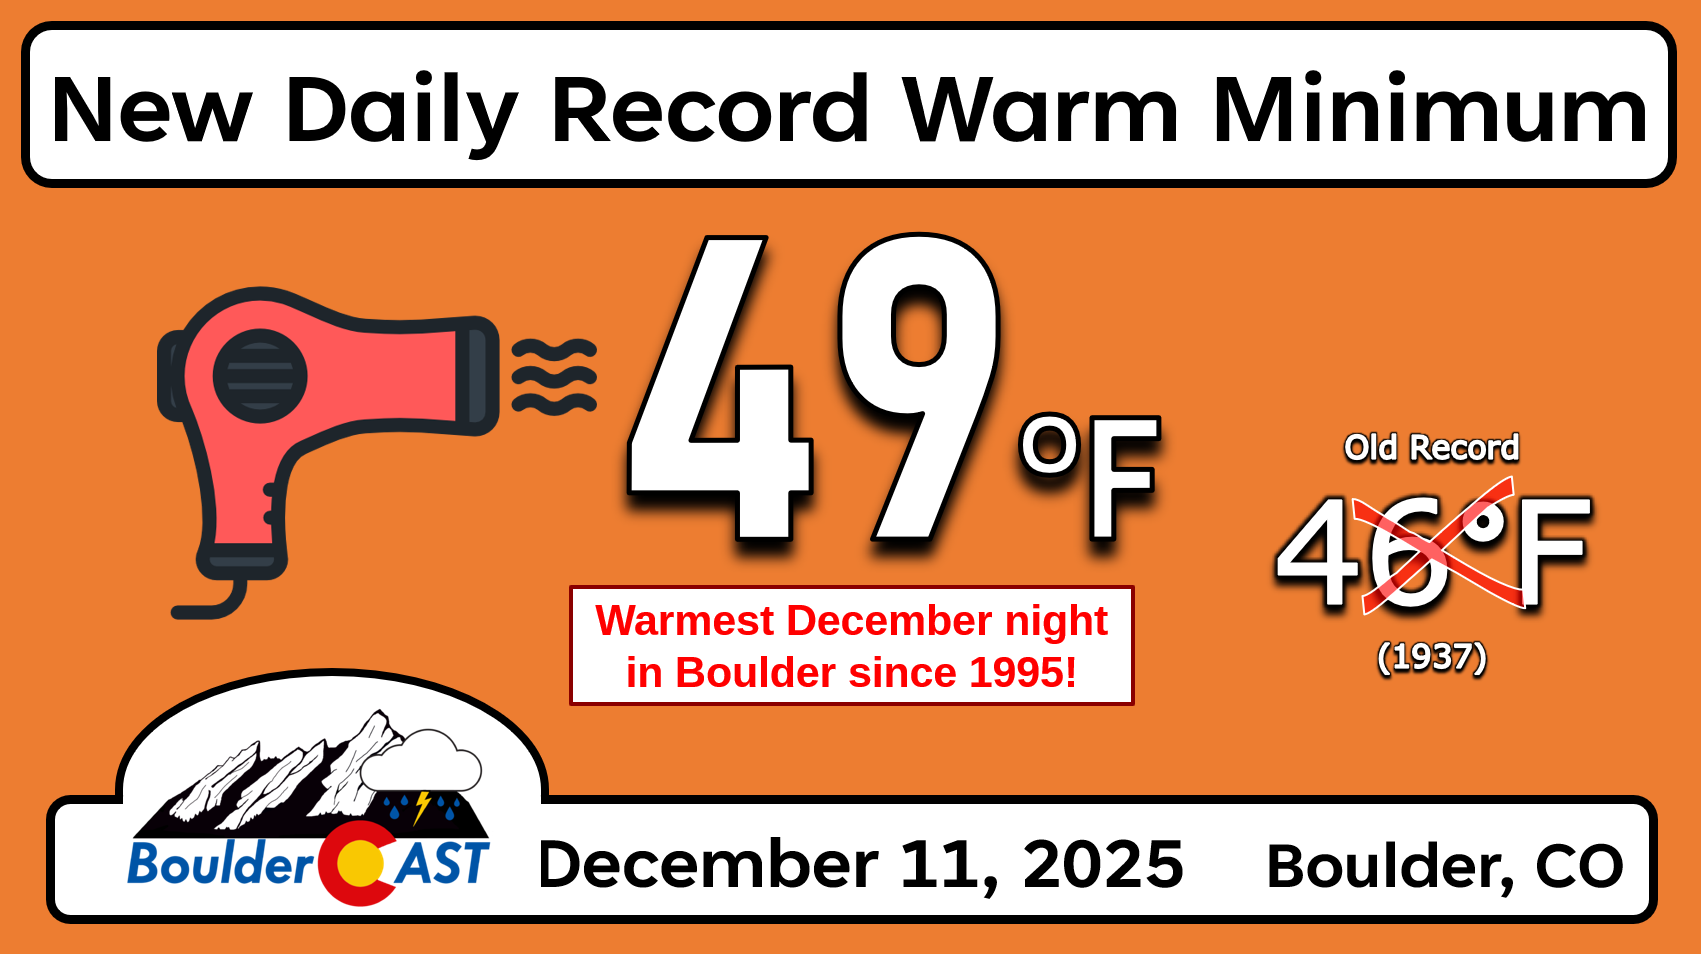
It feels like ancient history now, but 2025 actually opened on a brutally cold note. Multiple Arctic fronts bulldozed into the Front Range, leaving January 6.6°F below normal — Boulder’s coldest January since 2007 and the most anomalously cold month since February 2021. The rest of the year took a warmer turn, culminating in December with an all-timer display of winter warmth. Boulder finished December 10.0° above normal!
A Sizzling Summer
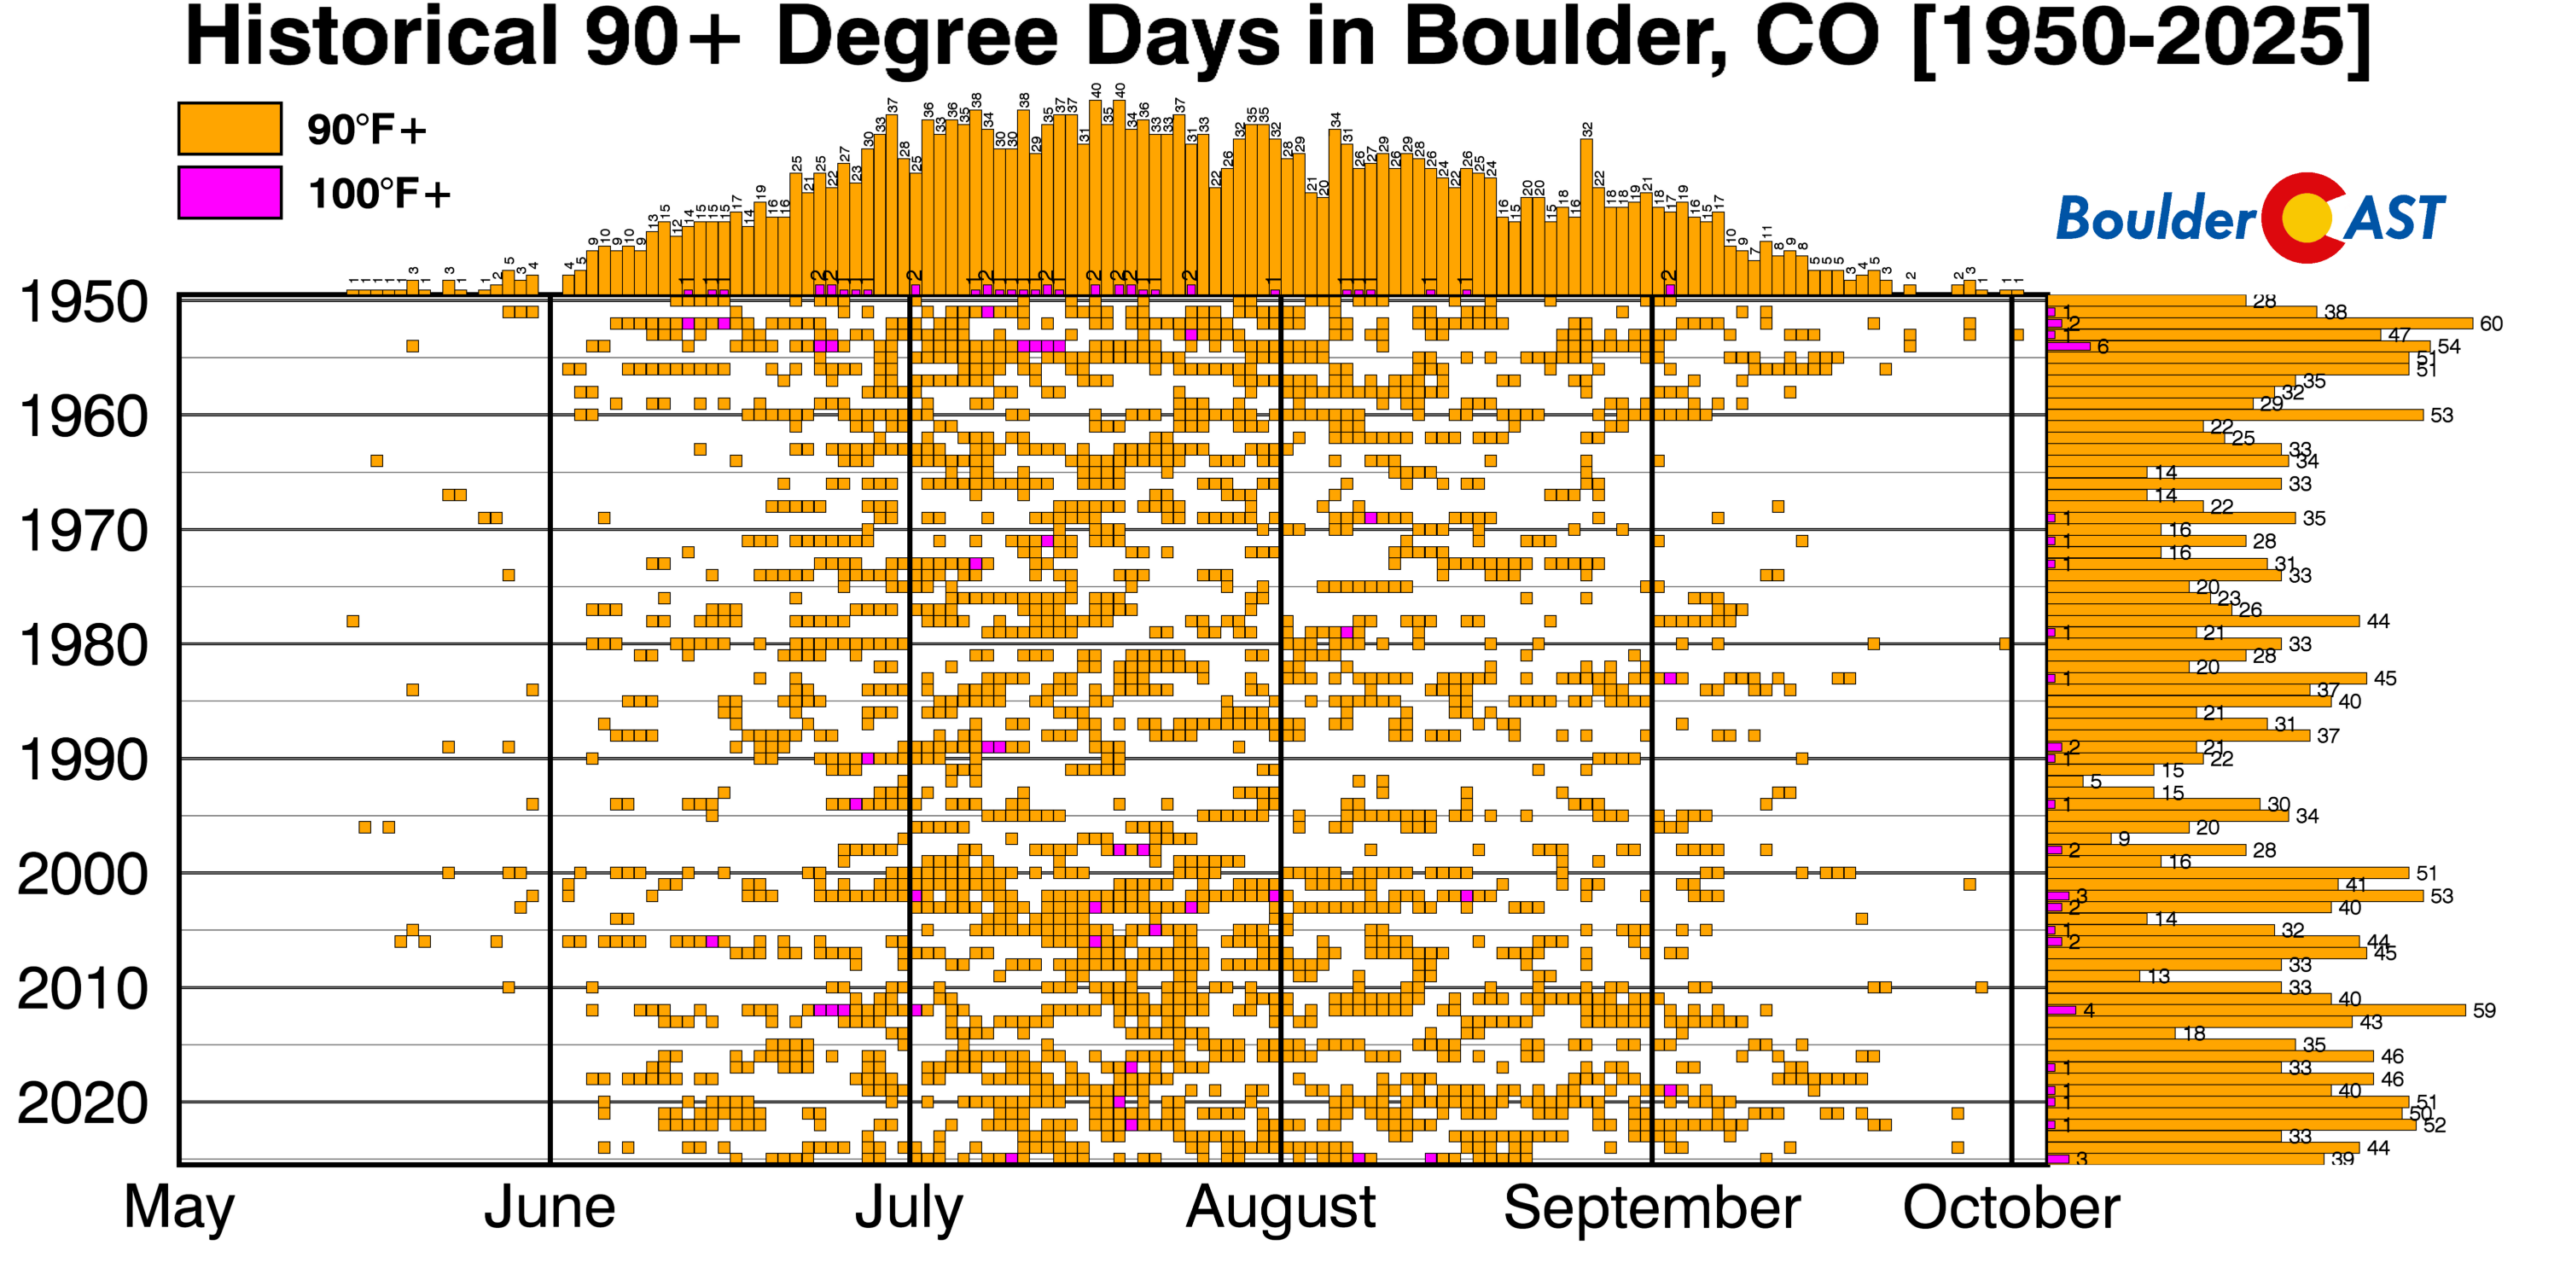
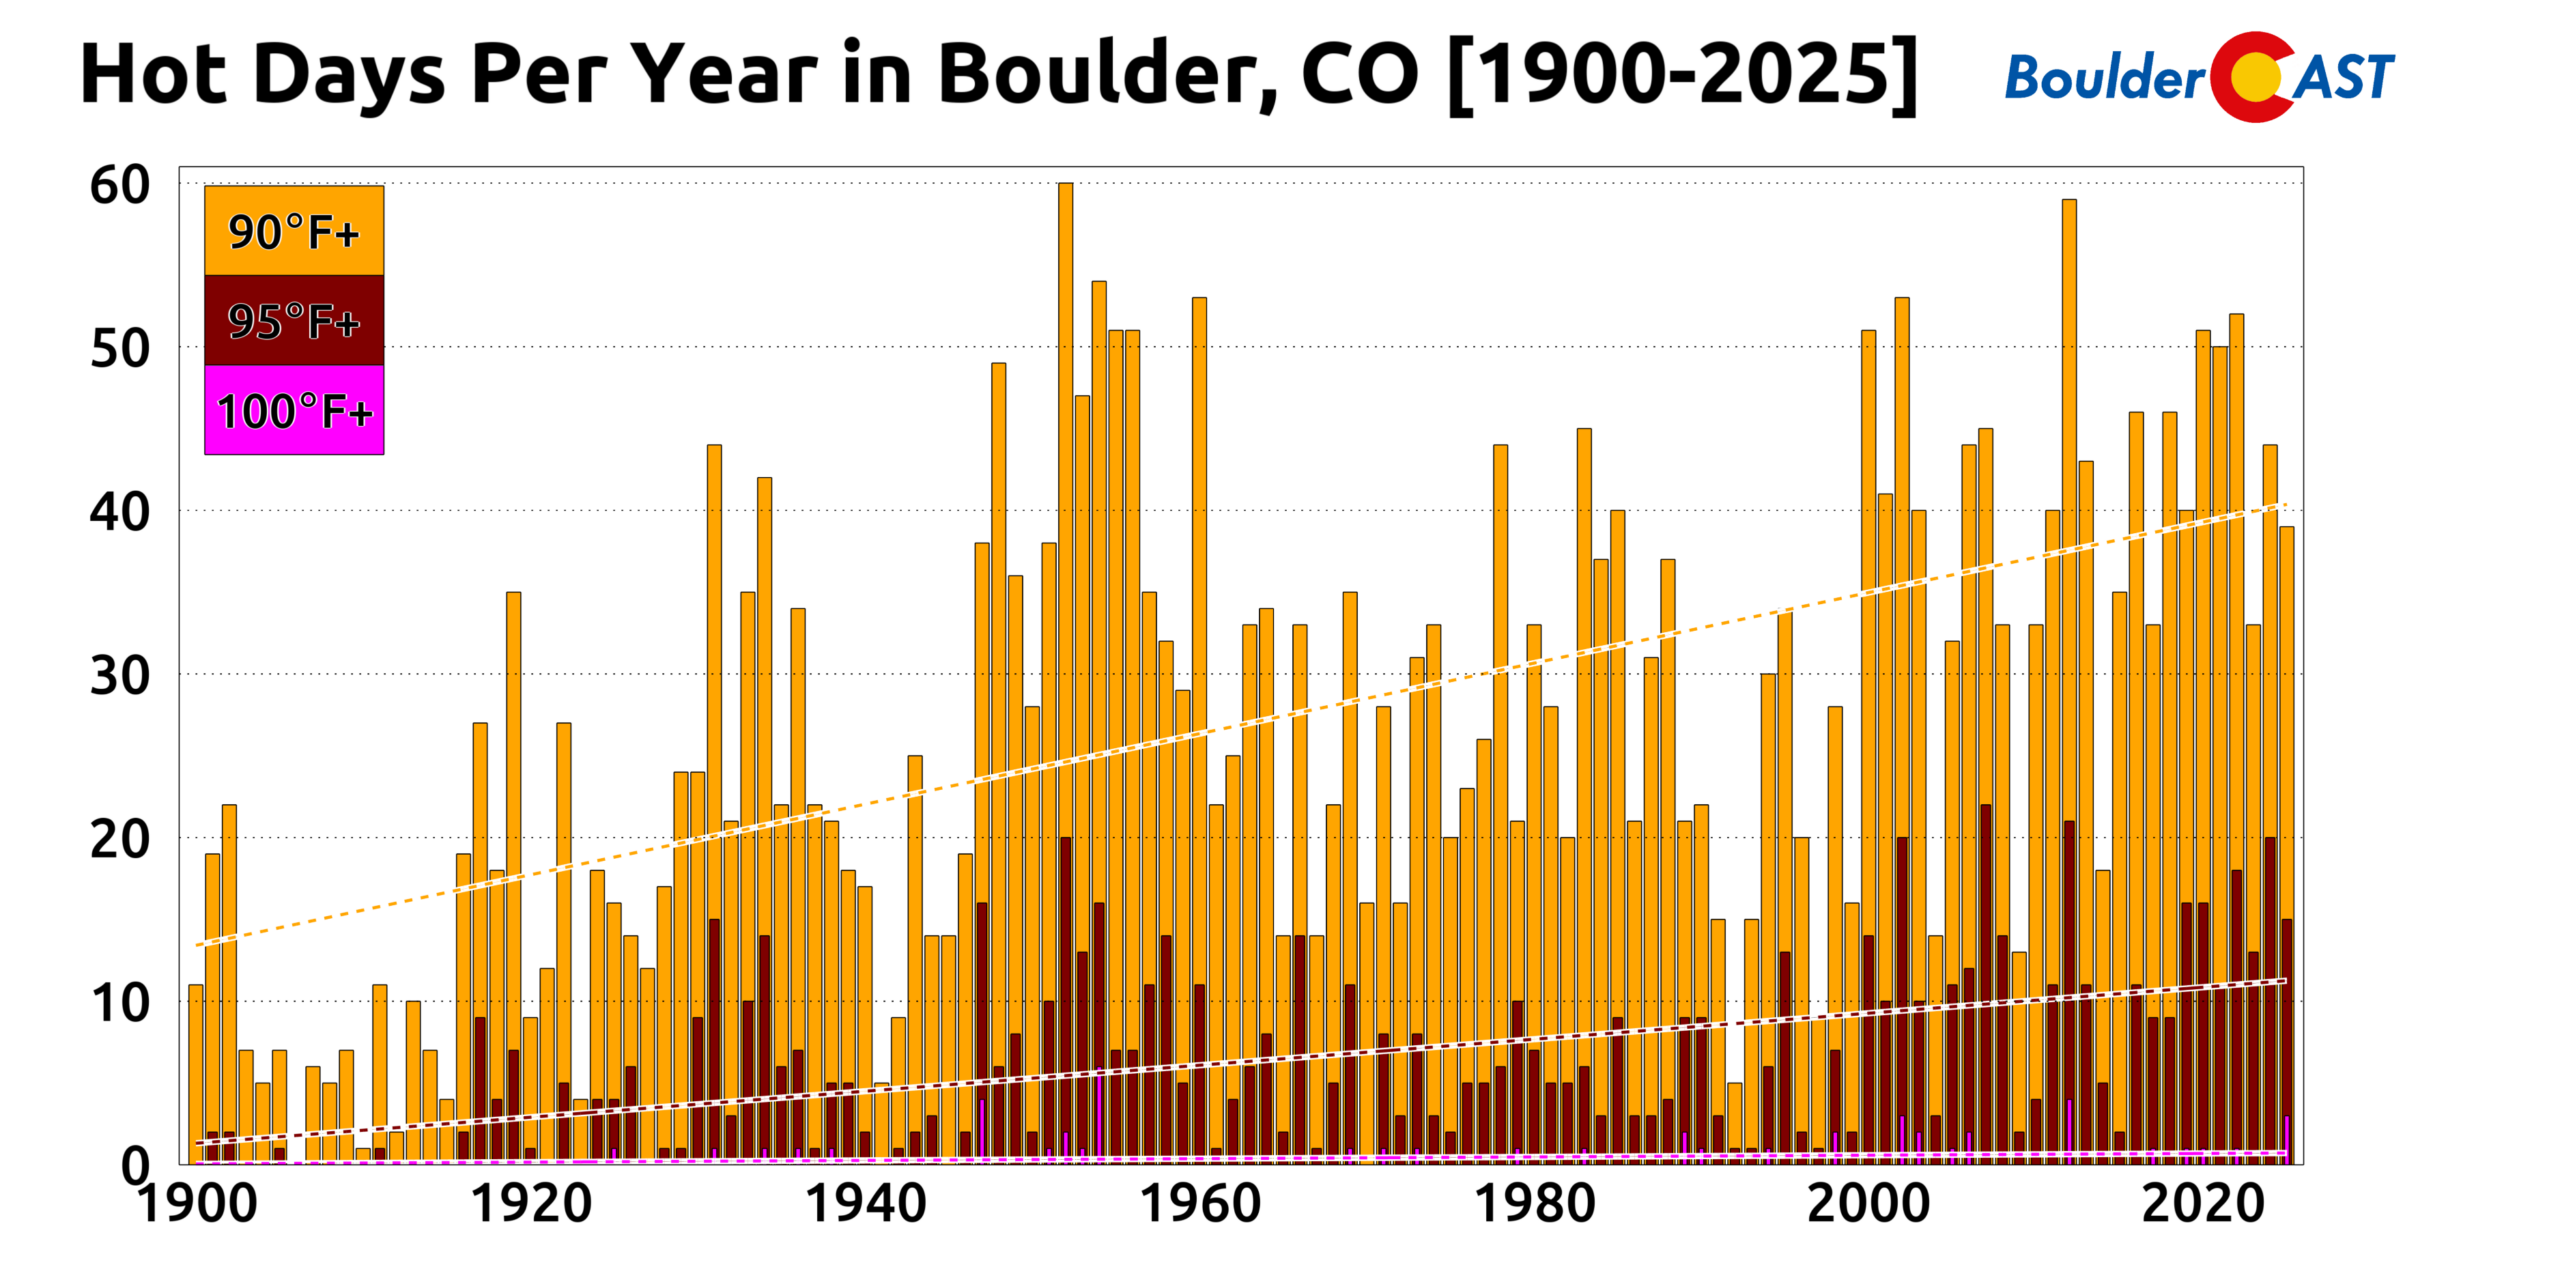
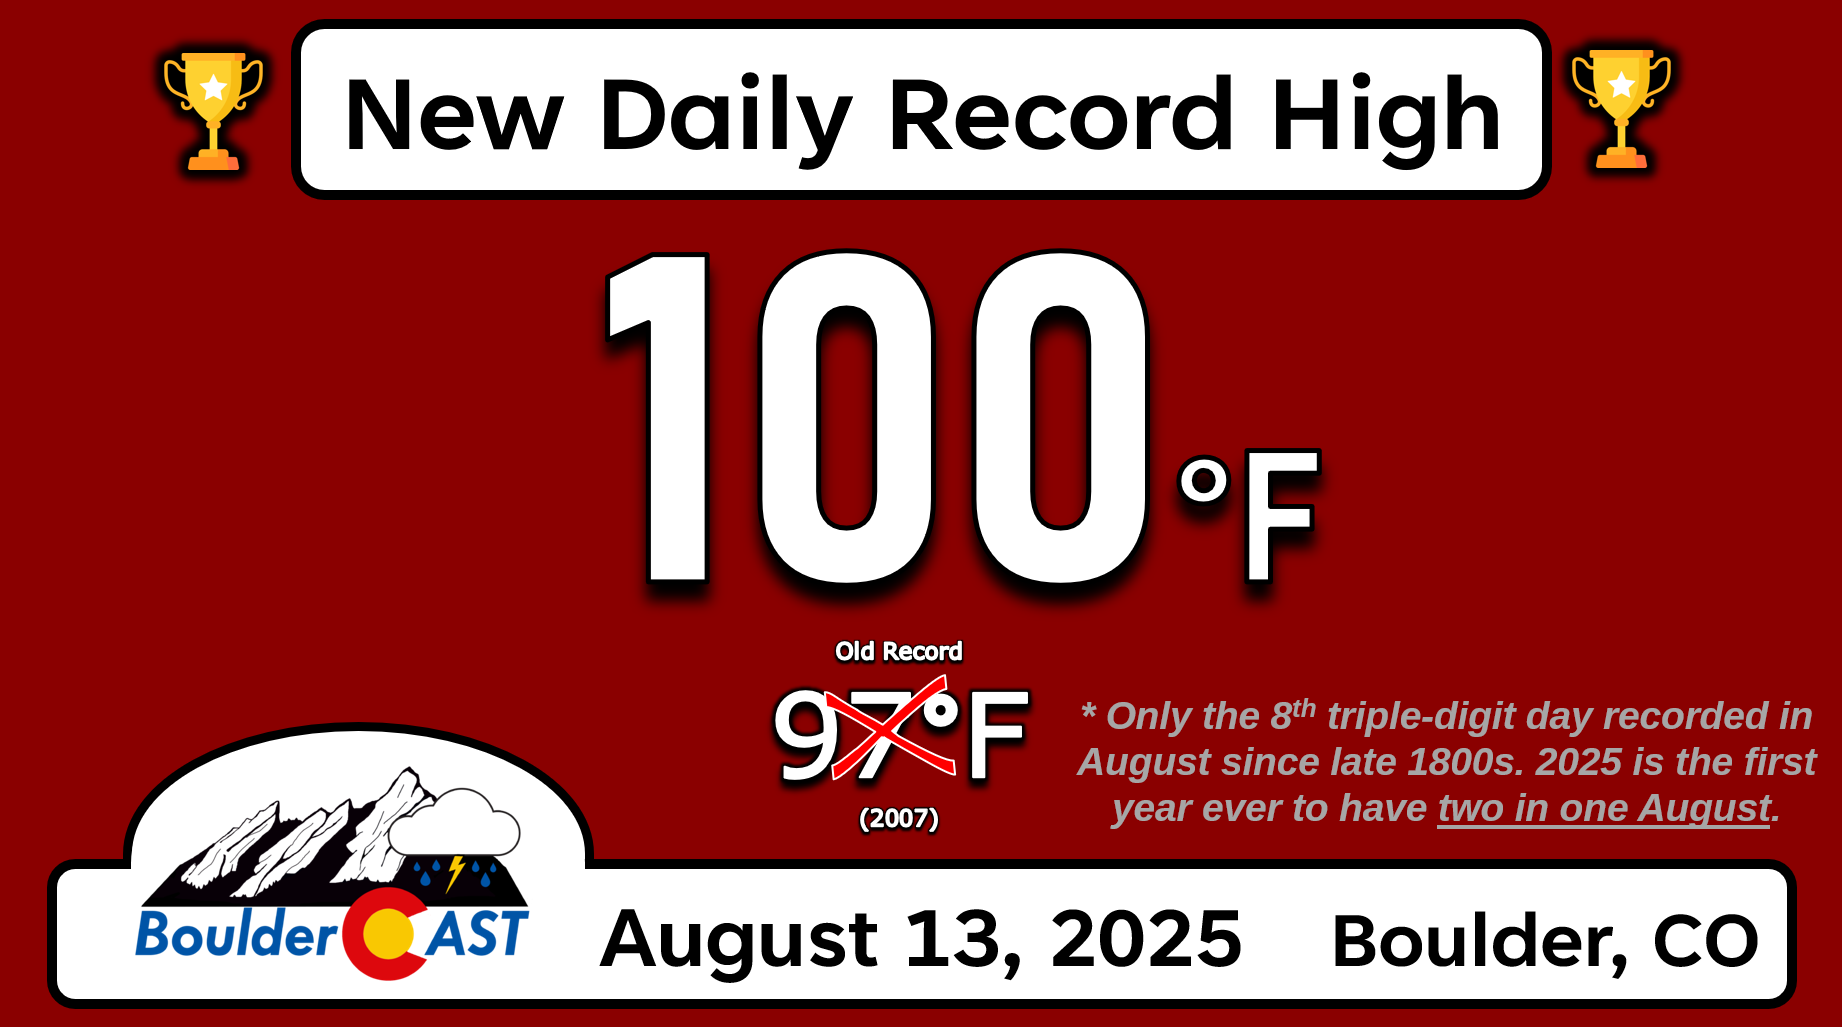
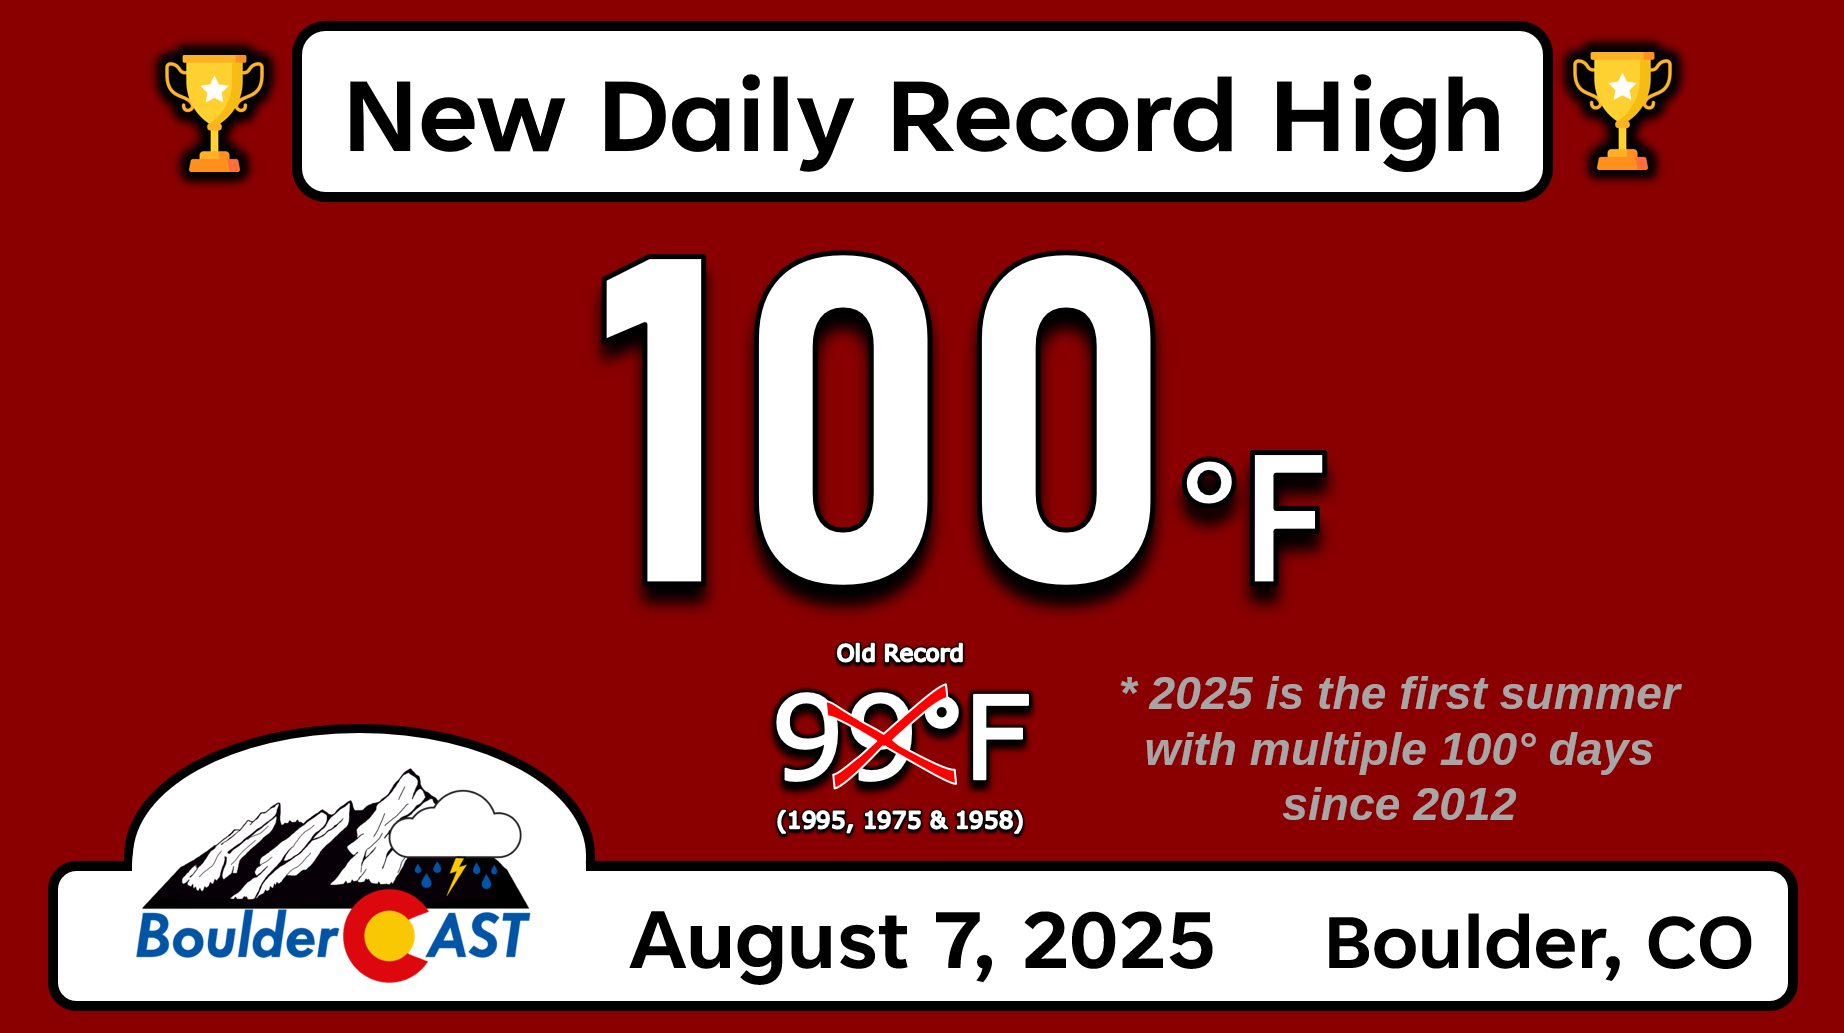
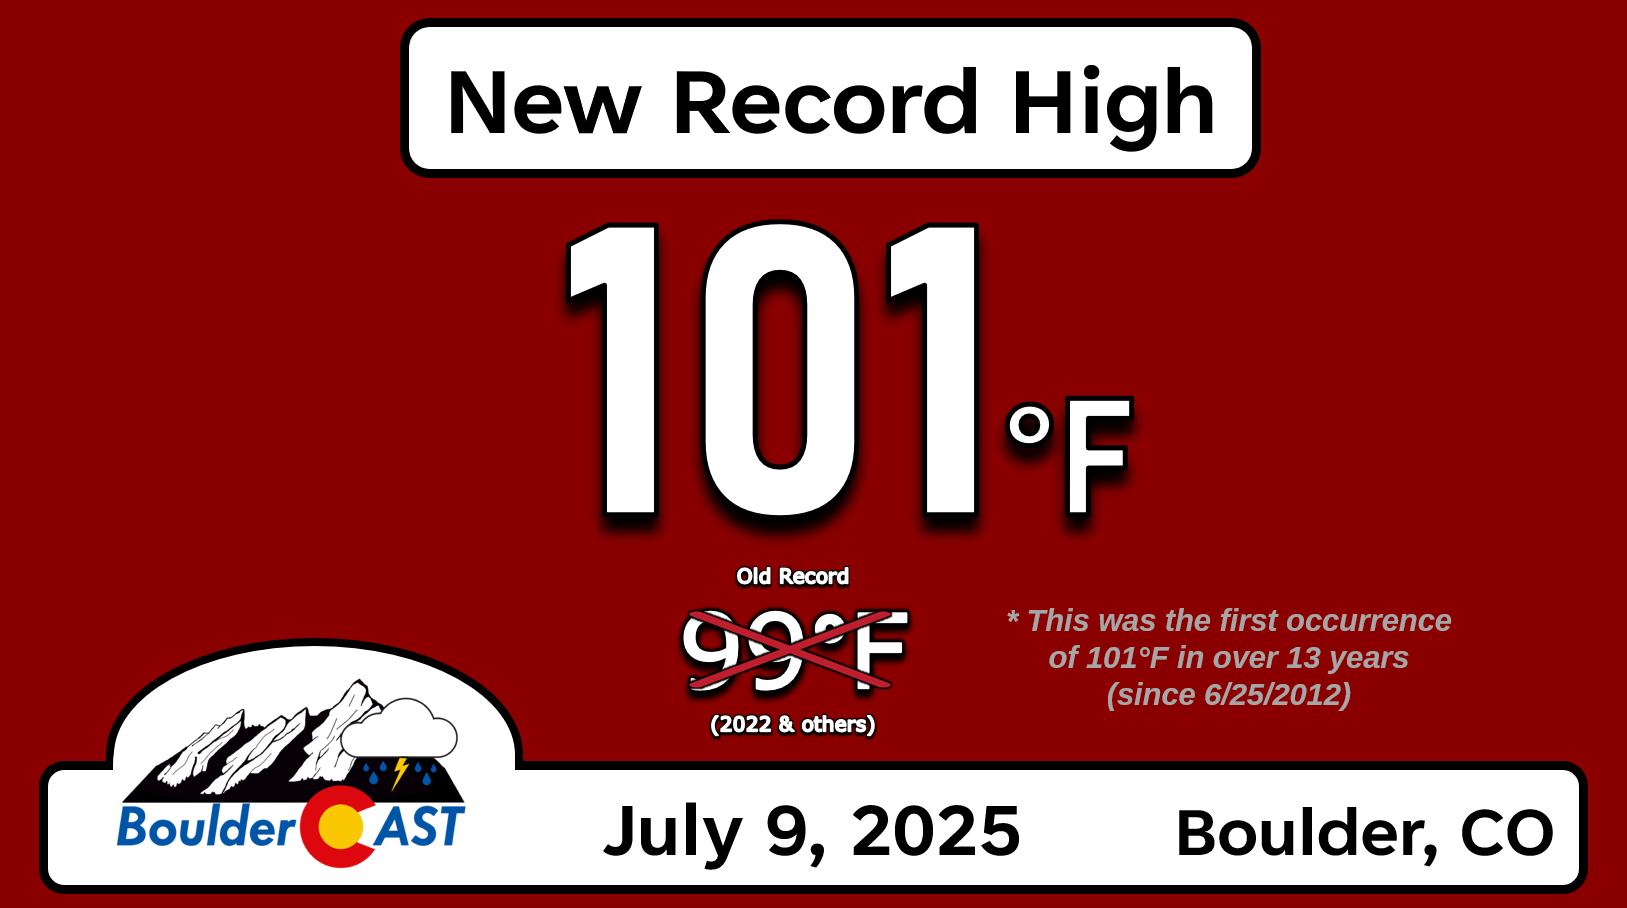
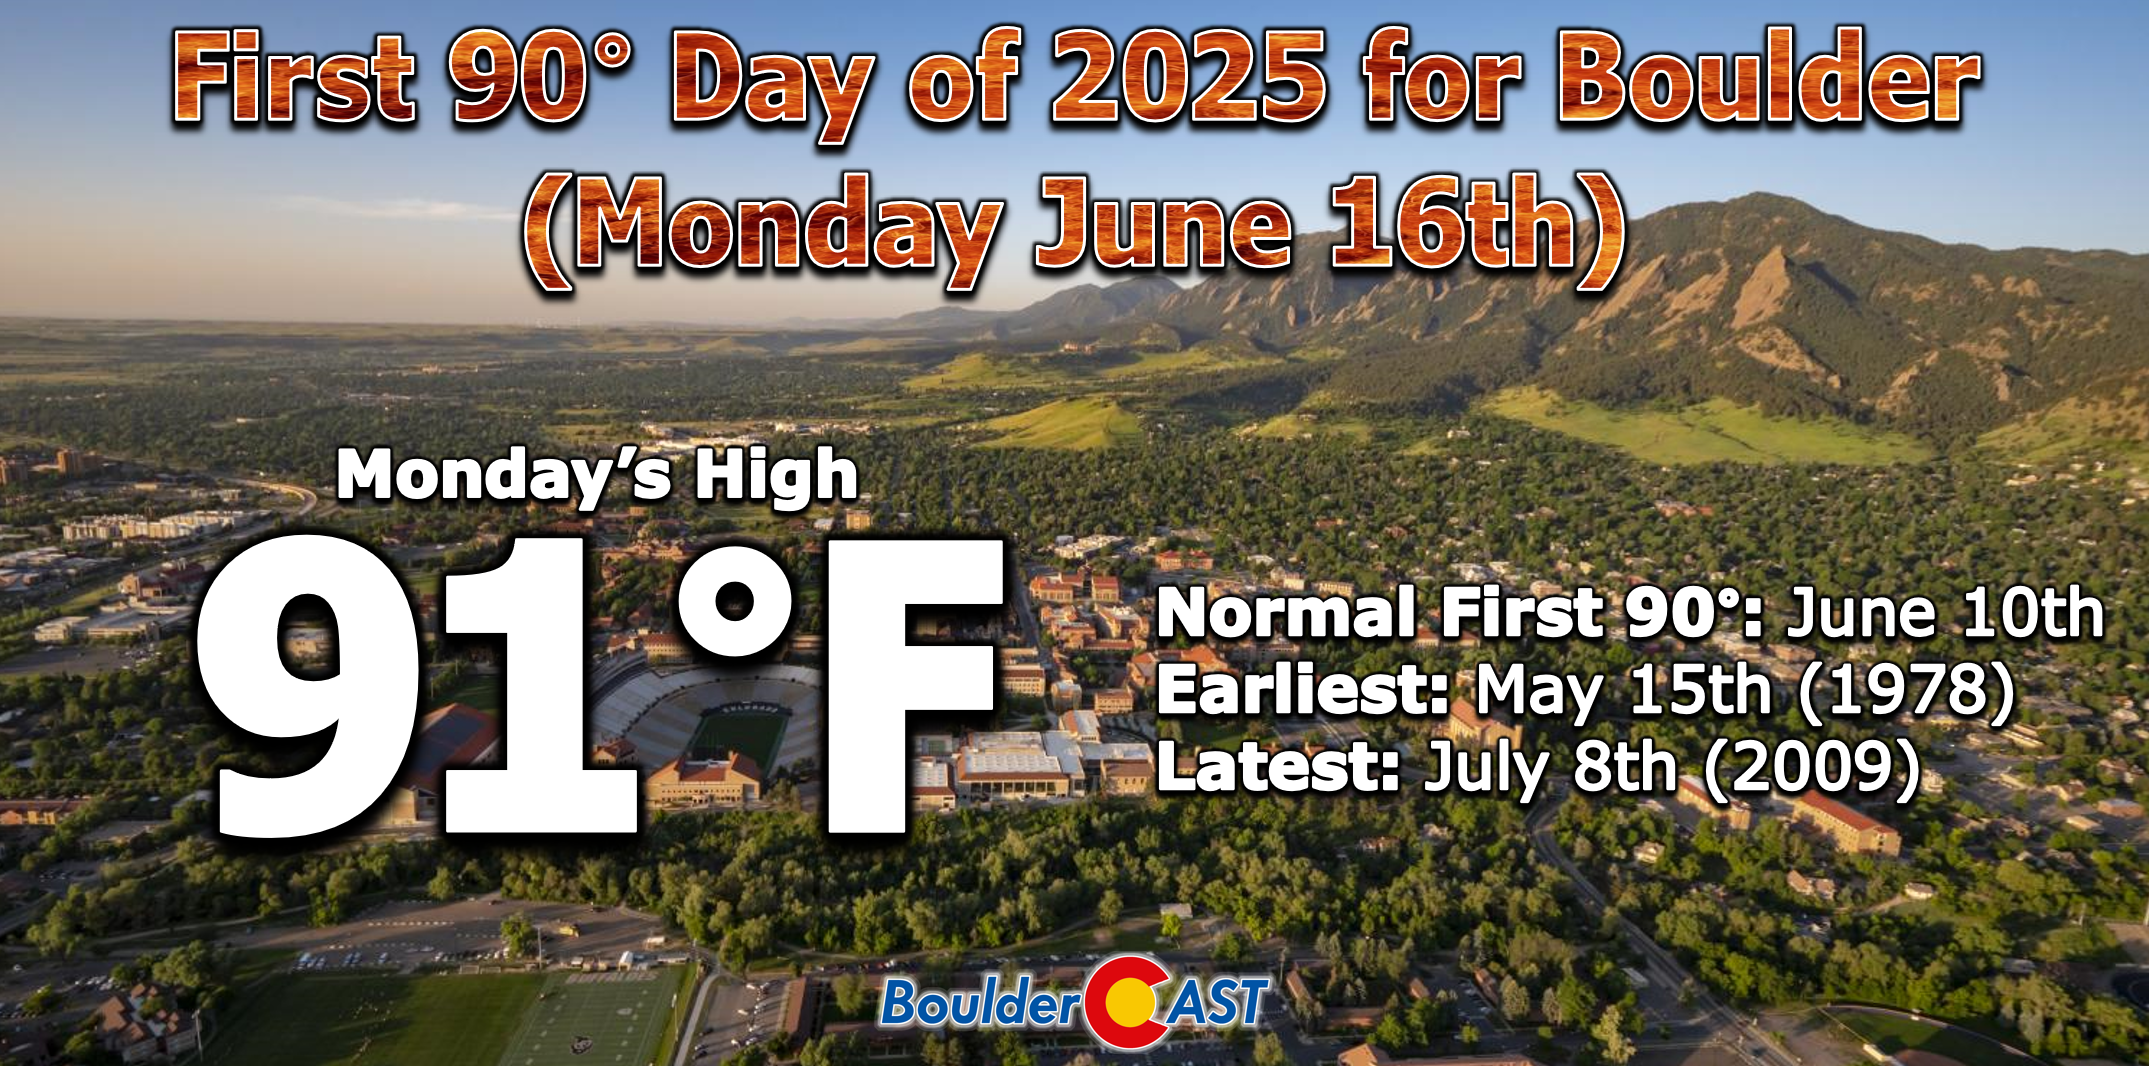
Summer 2025 flipped the script entirely. Boulder logged 39 days at or above 90°F and 15 days of 95°F+, both well above average. On July 9th, we hit 101°F, our hottest temperature since the fiery summer of 2012.
We also tallied three 100° days this year, tying for the third most in Boulder history.
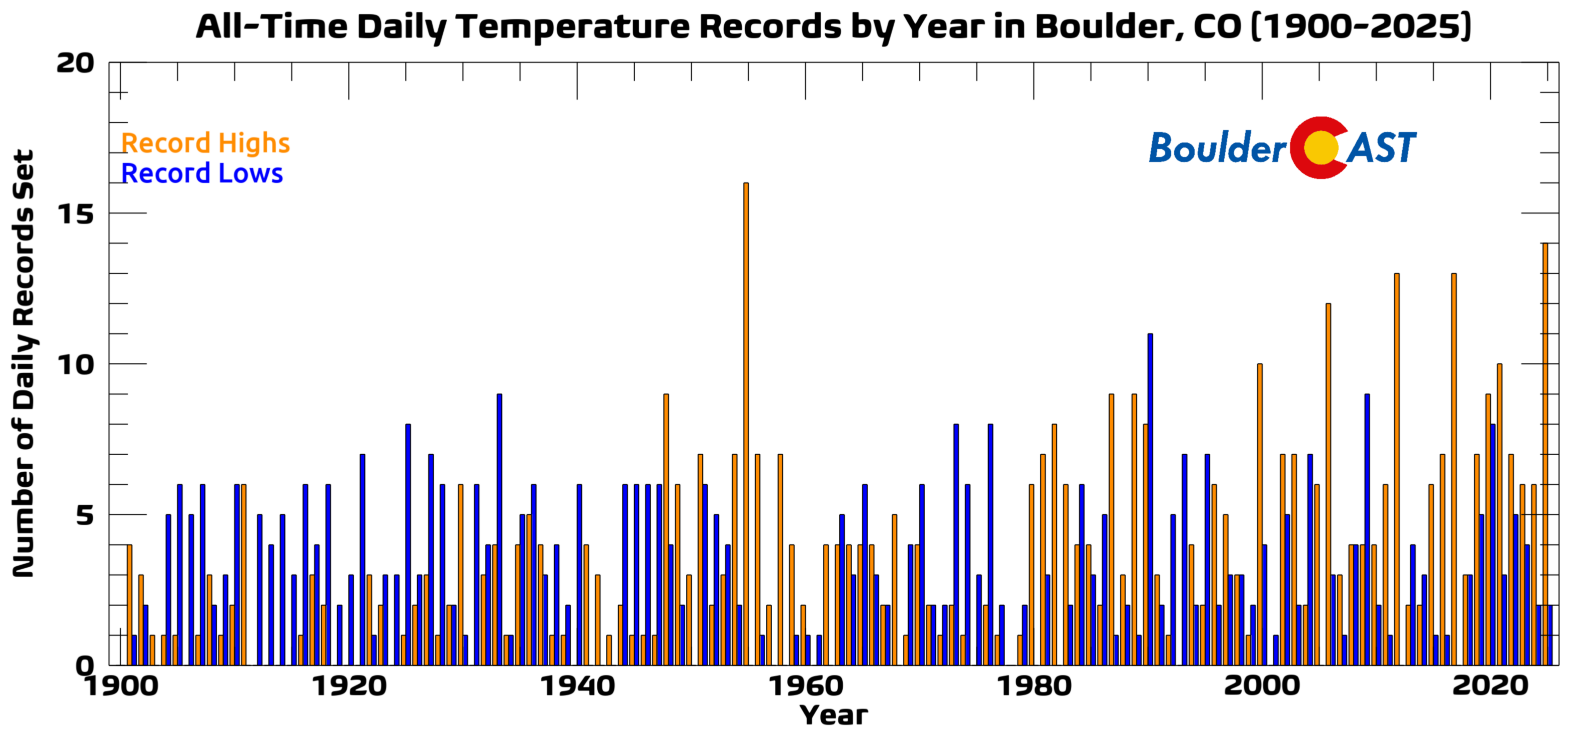
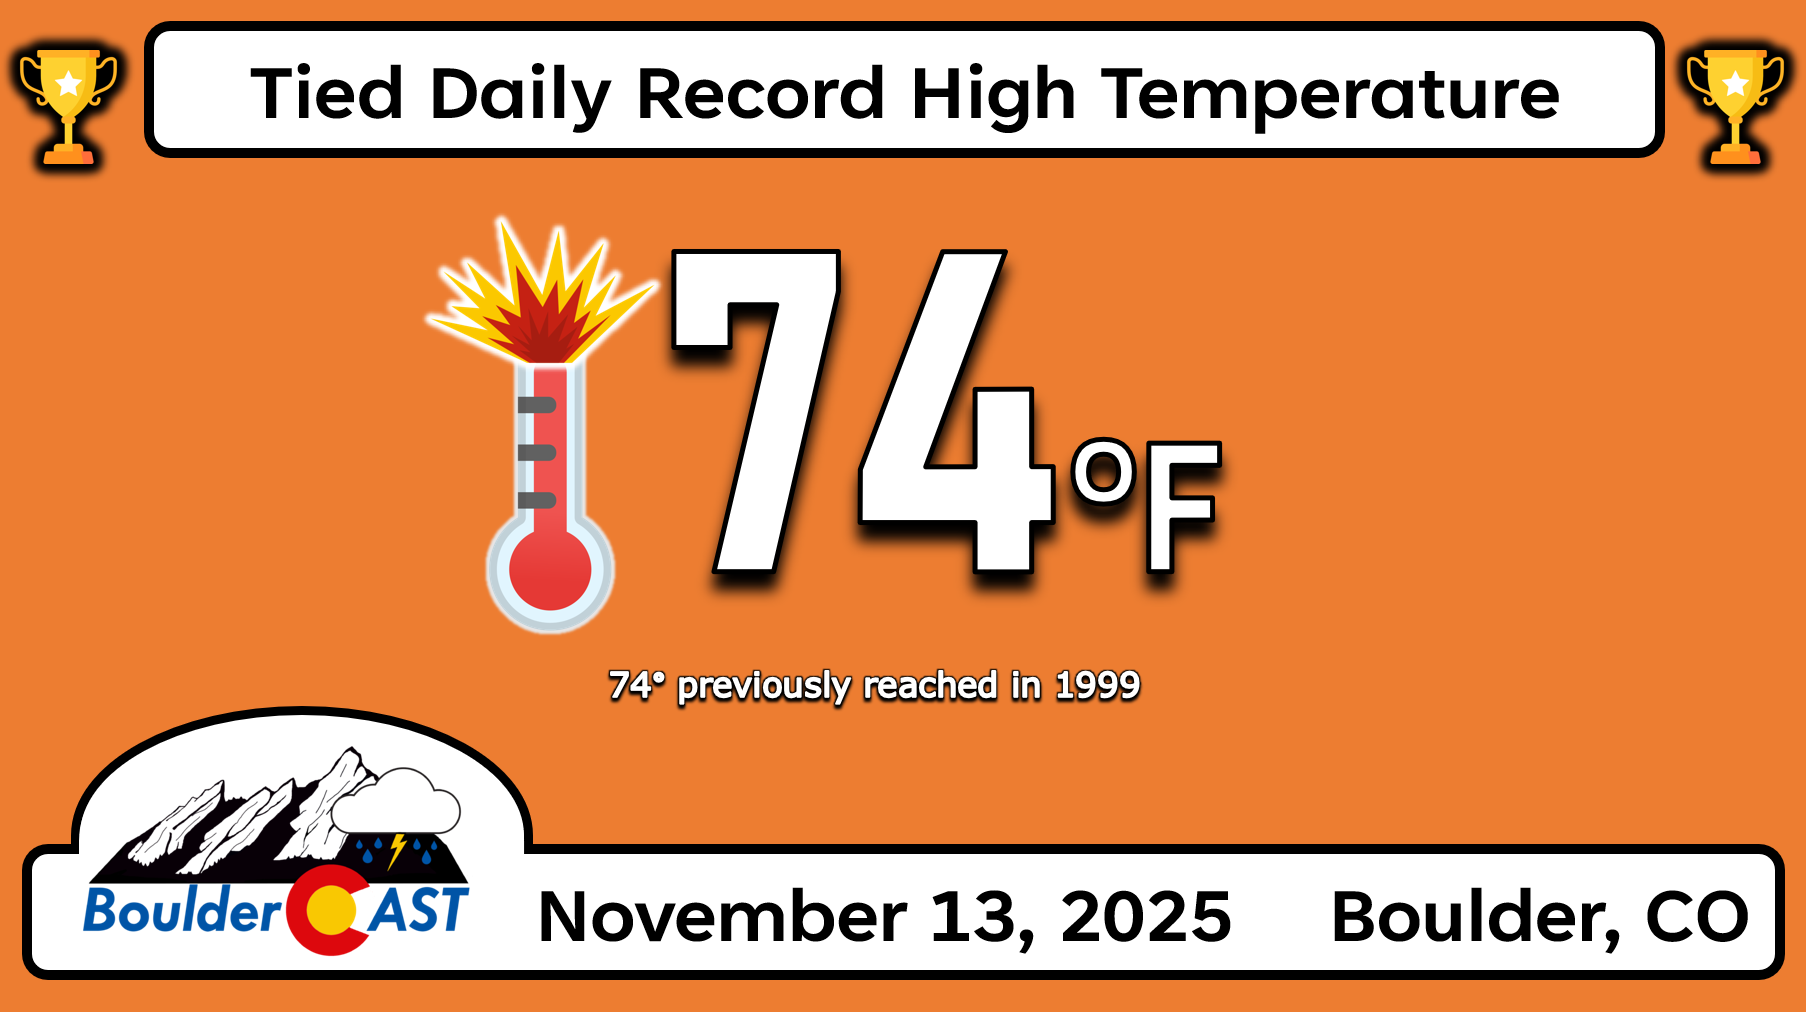
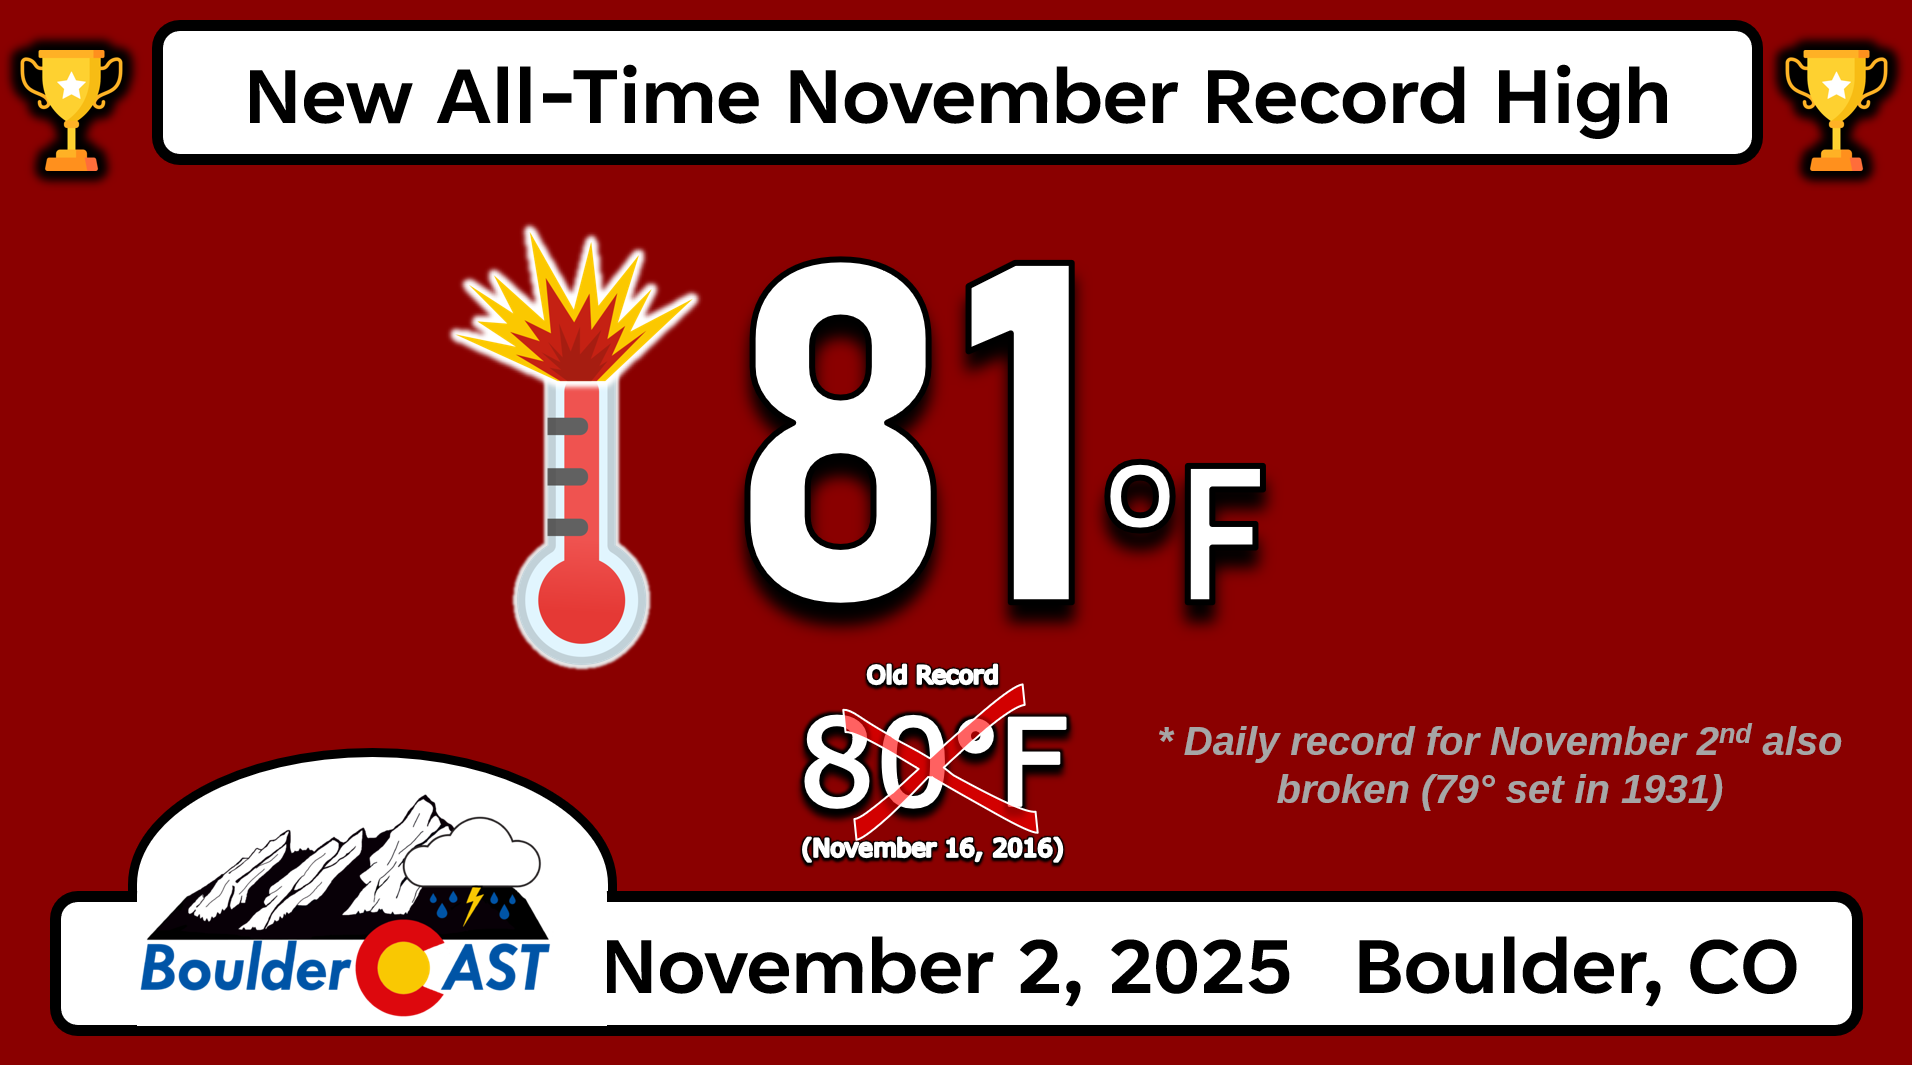
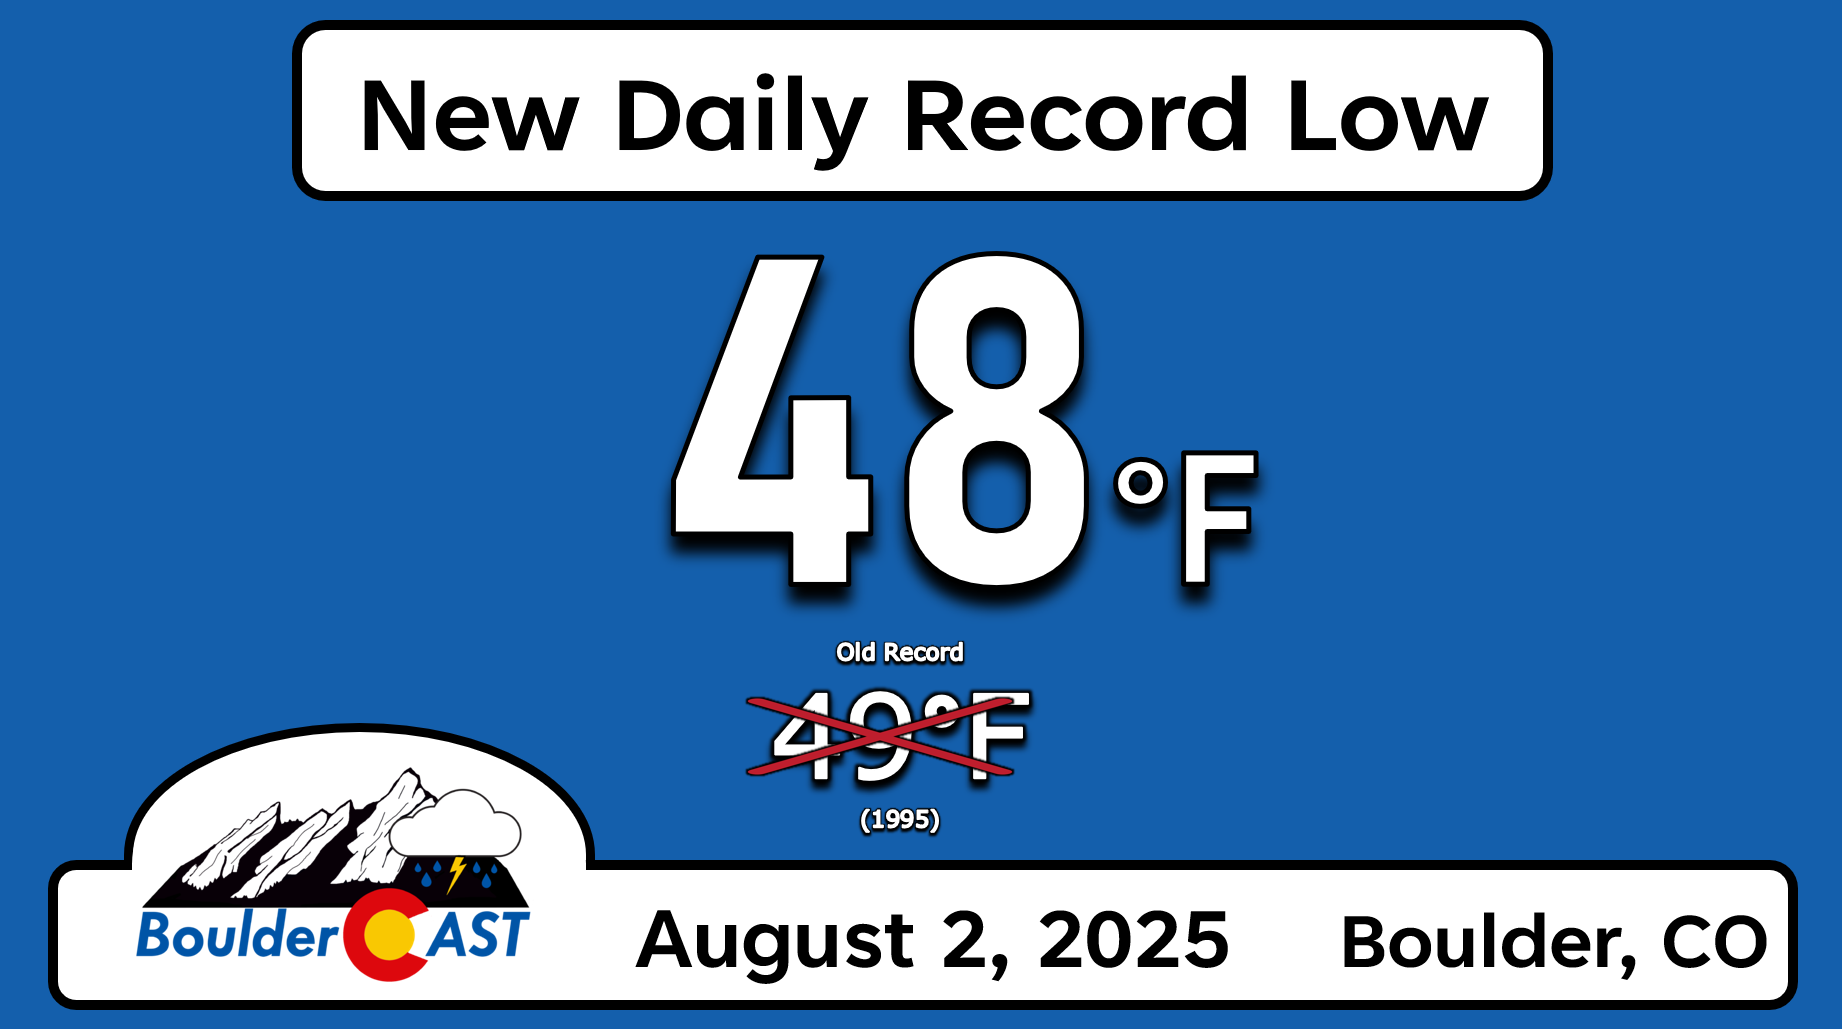
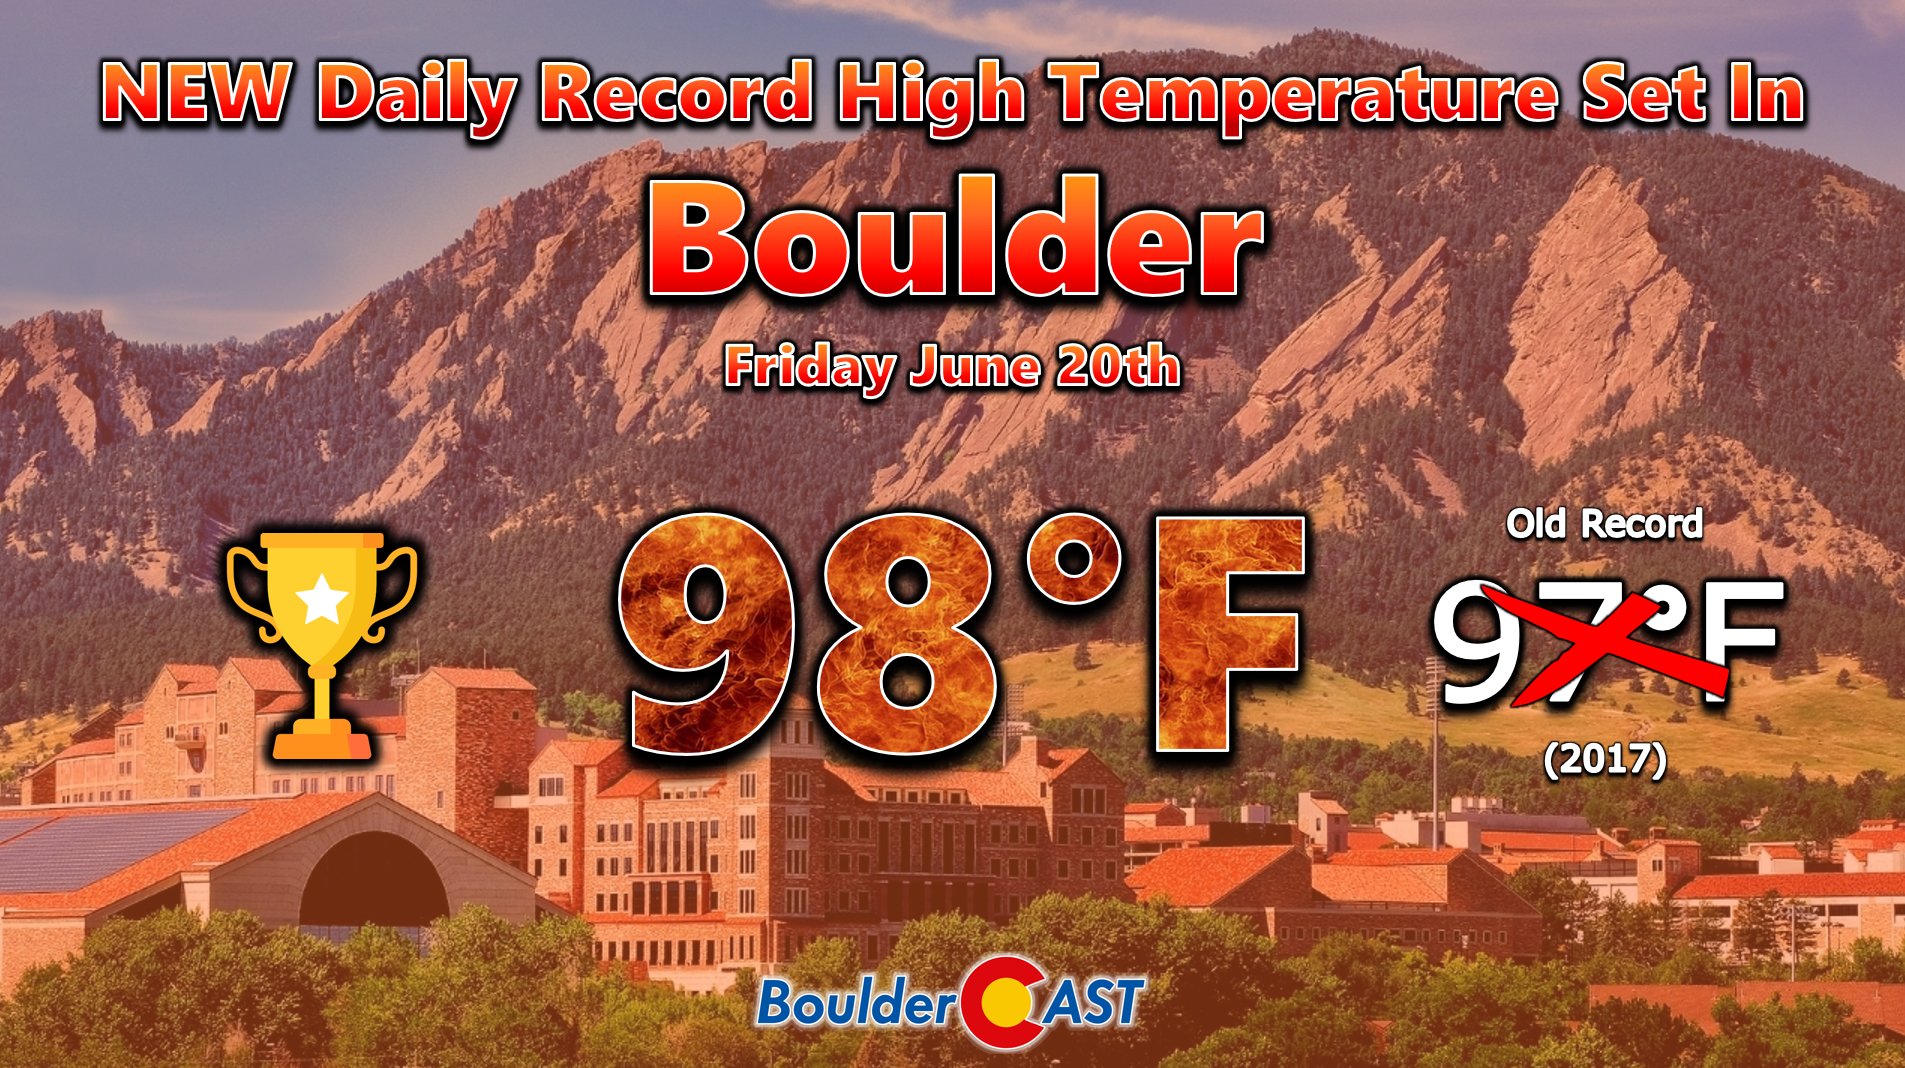
The year’s warmth wasn’t just persistent — it was record‑setting. Boulder notched 14 new daily record highs in 2025, compared to only two new record lows.
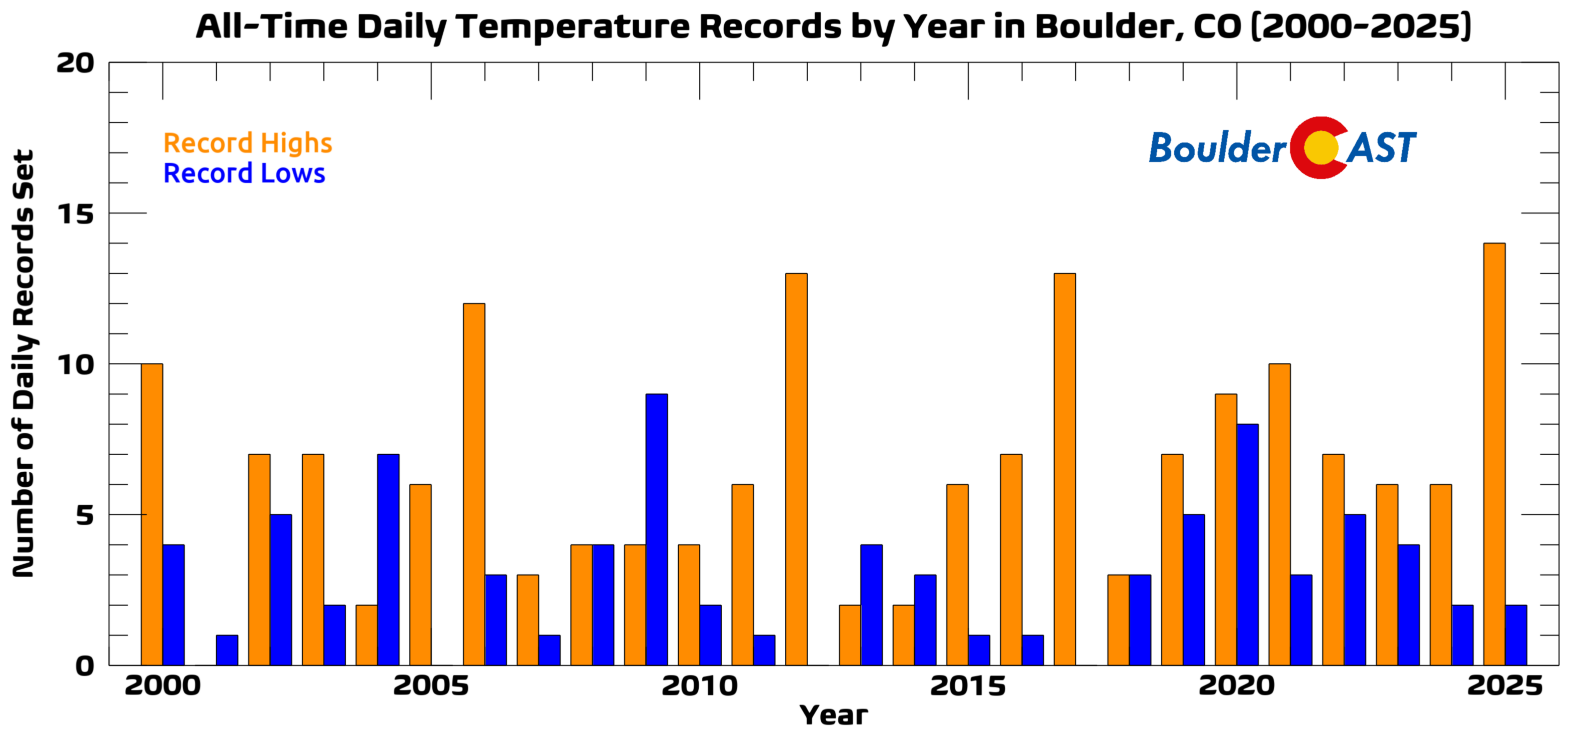
In fact, 2025 now ranks second all‑time for most record highs in a single year, trailing only 1955 — a decade known for warm observational bias thanks to temperature readings taken atop the old downtown fire station.
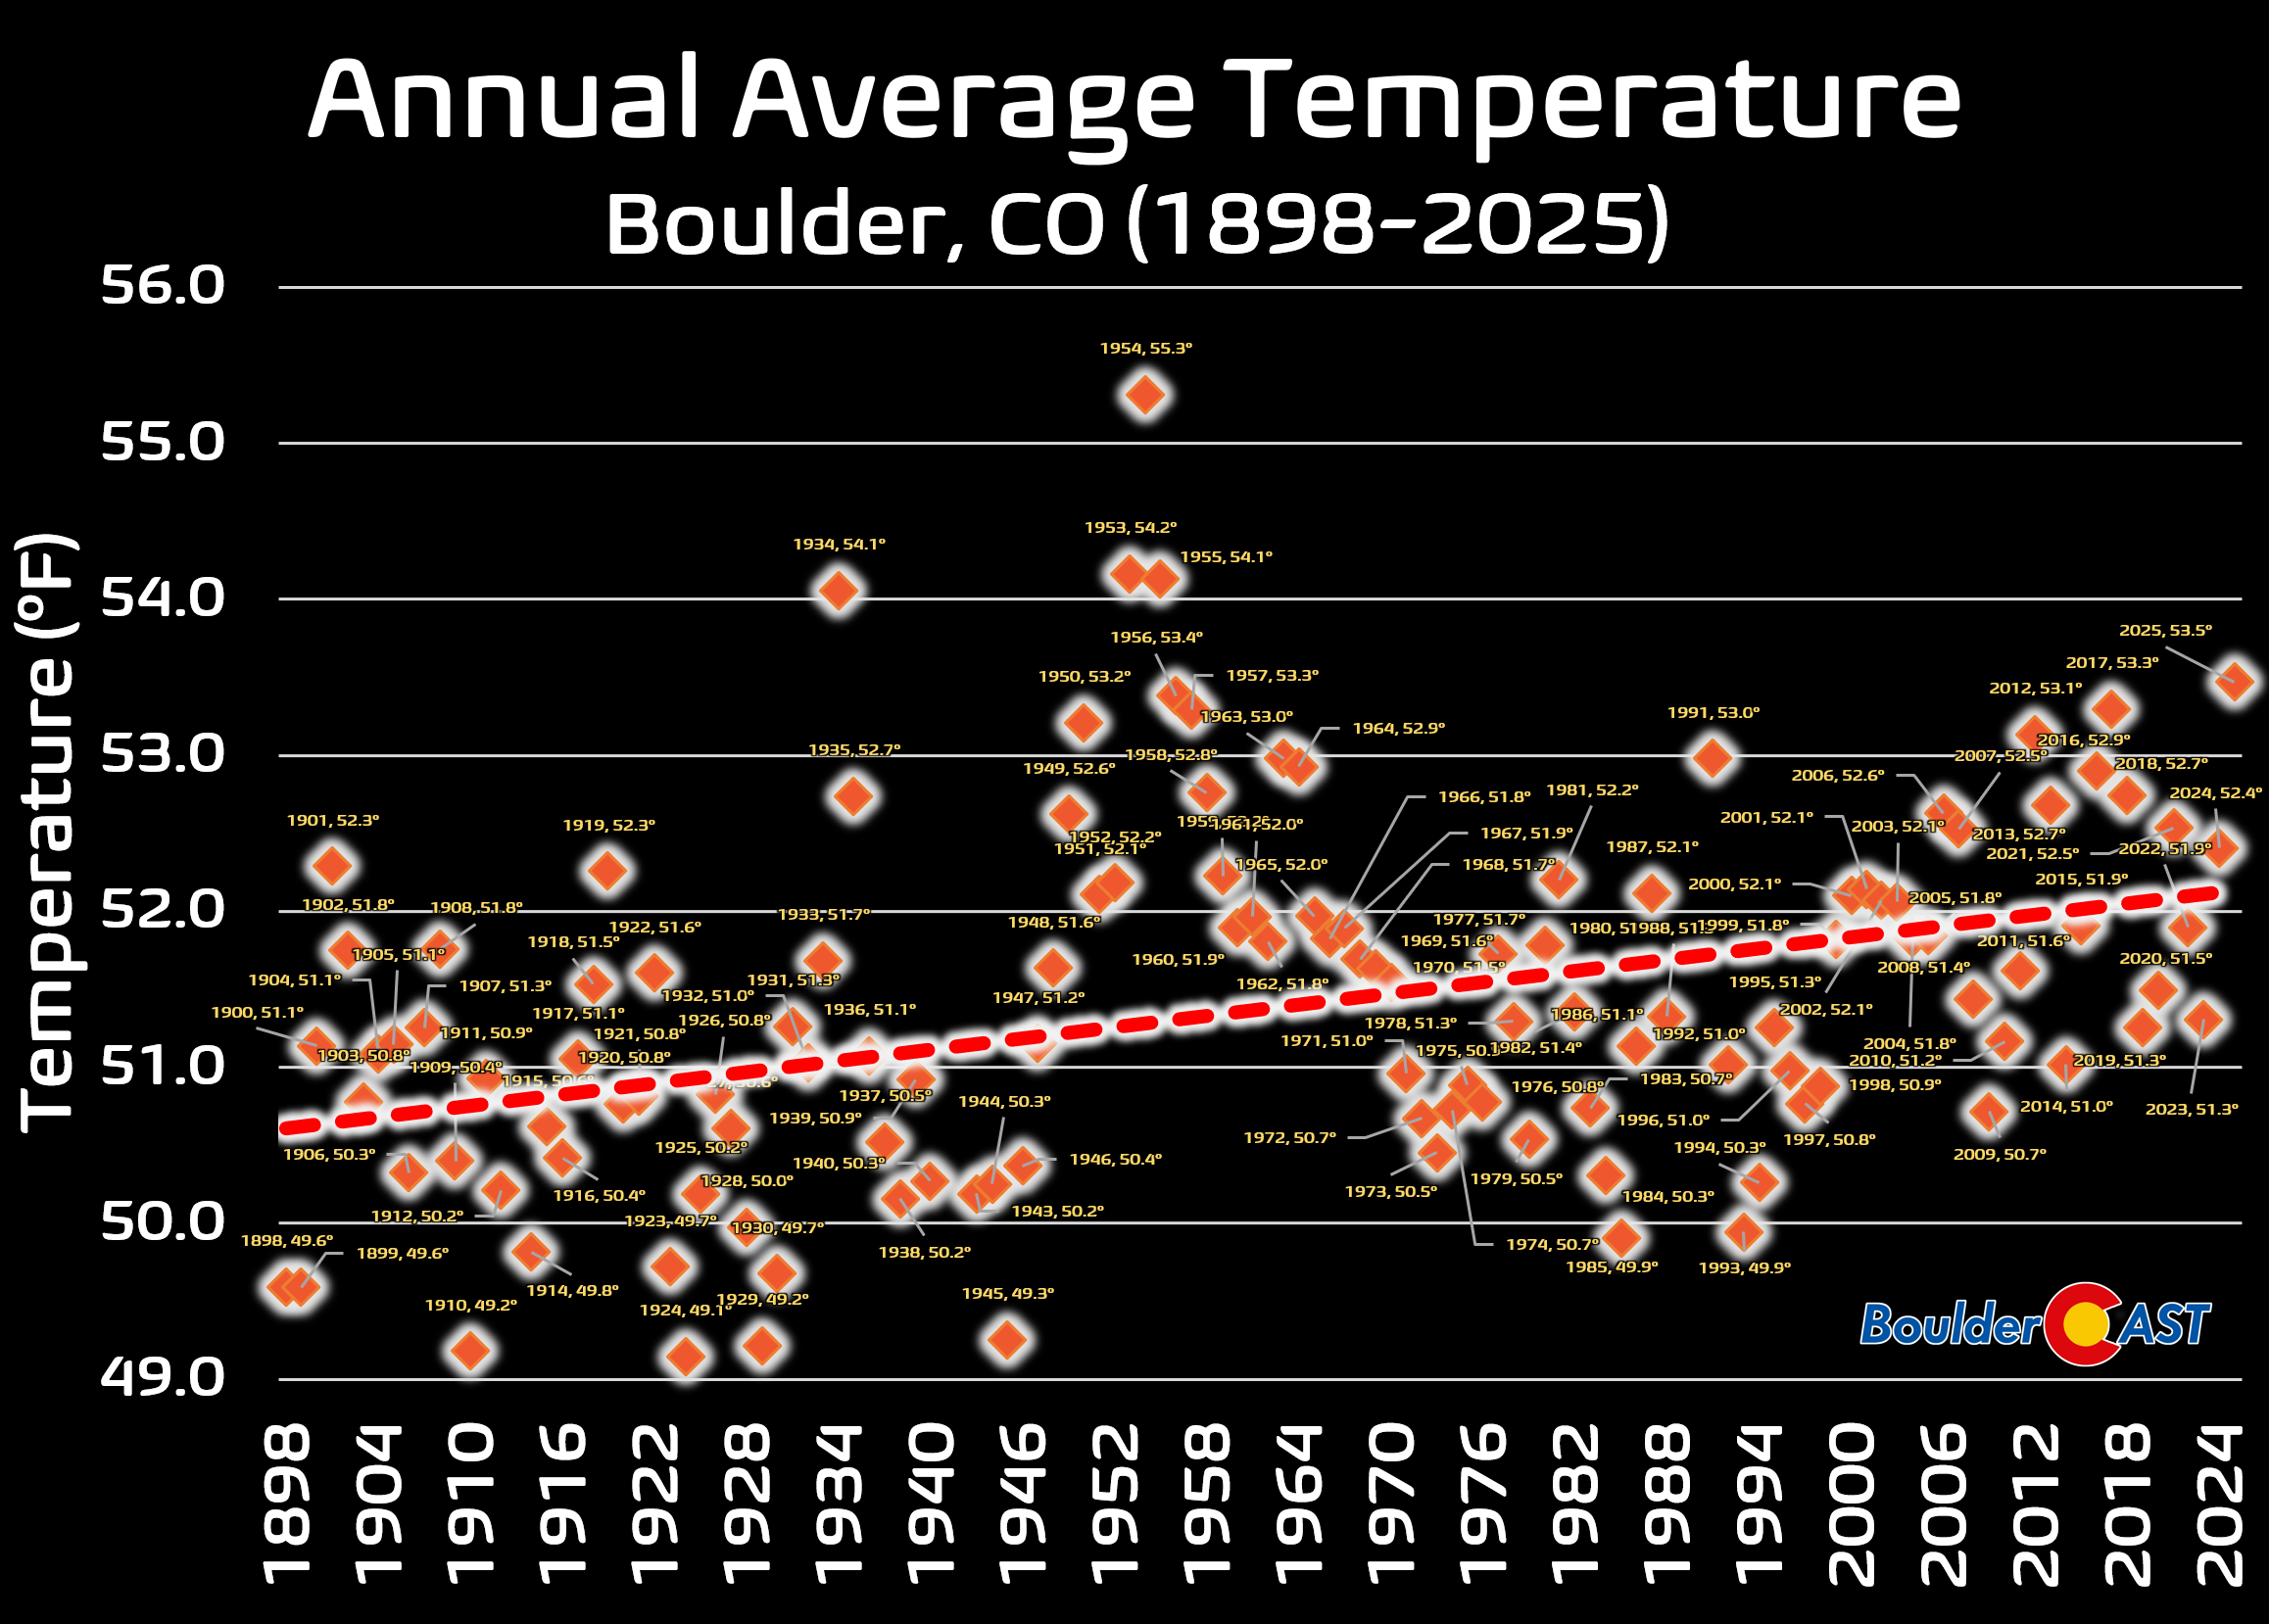
Long‑Term Warming: 2025 in Historical Context
Looking at Boulder’s ~130‑year temperature record, the long‑term warming trend is unmistakable. Our 2025 annual average temperature of 53.5°F was the warmest in 70 years, though we discount the warm‑biased 1947–1958 fire‑station era. Adjusting for that, 2025 becomes Boulder’s second warmest year on record, just behind 1934.
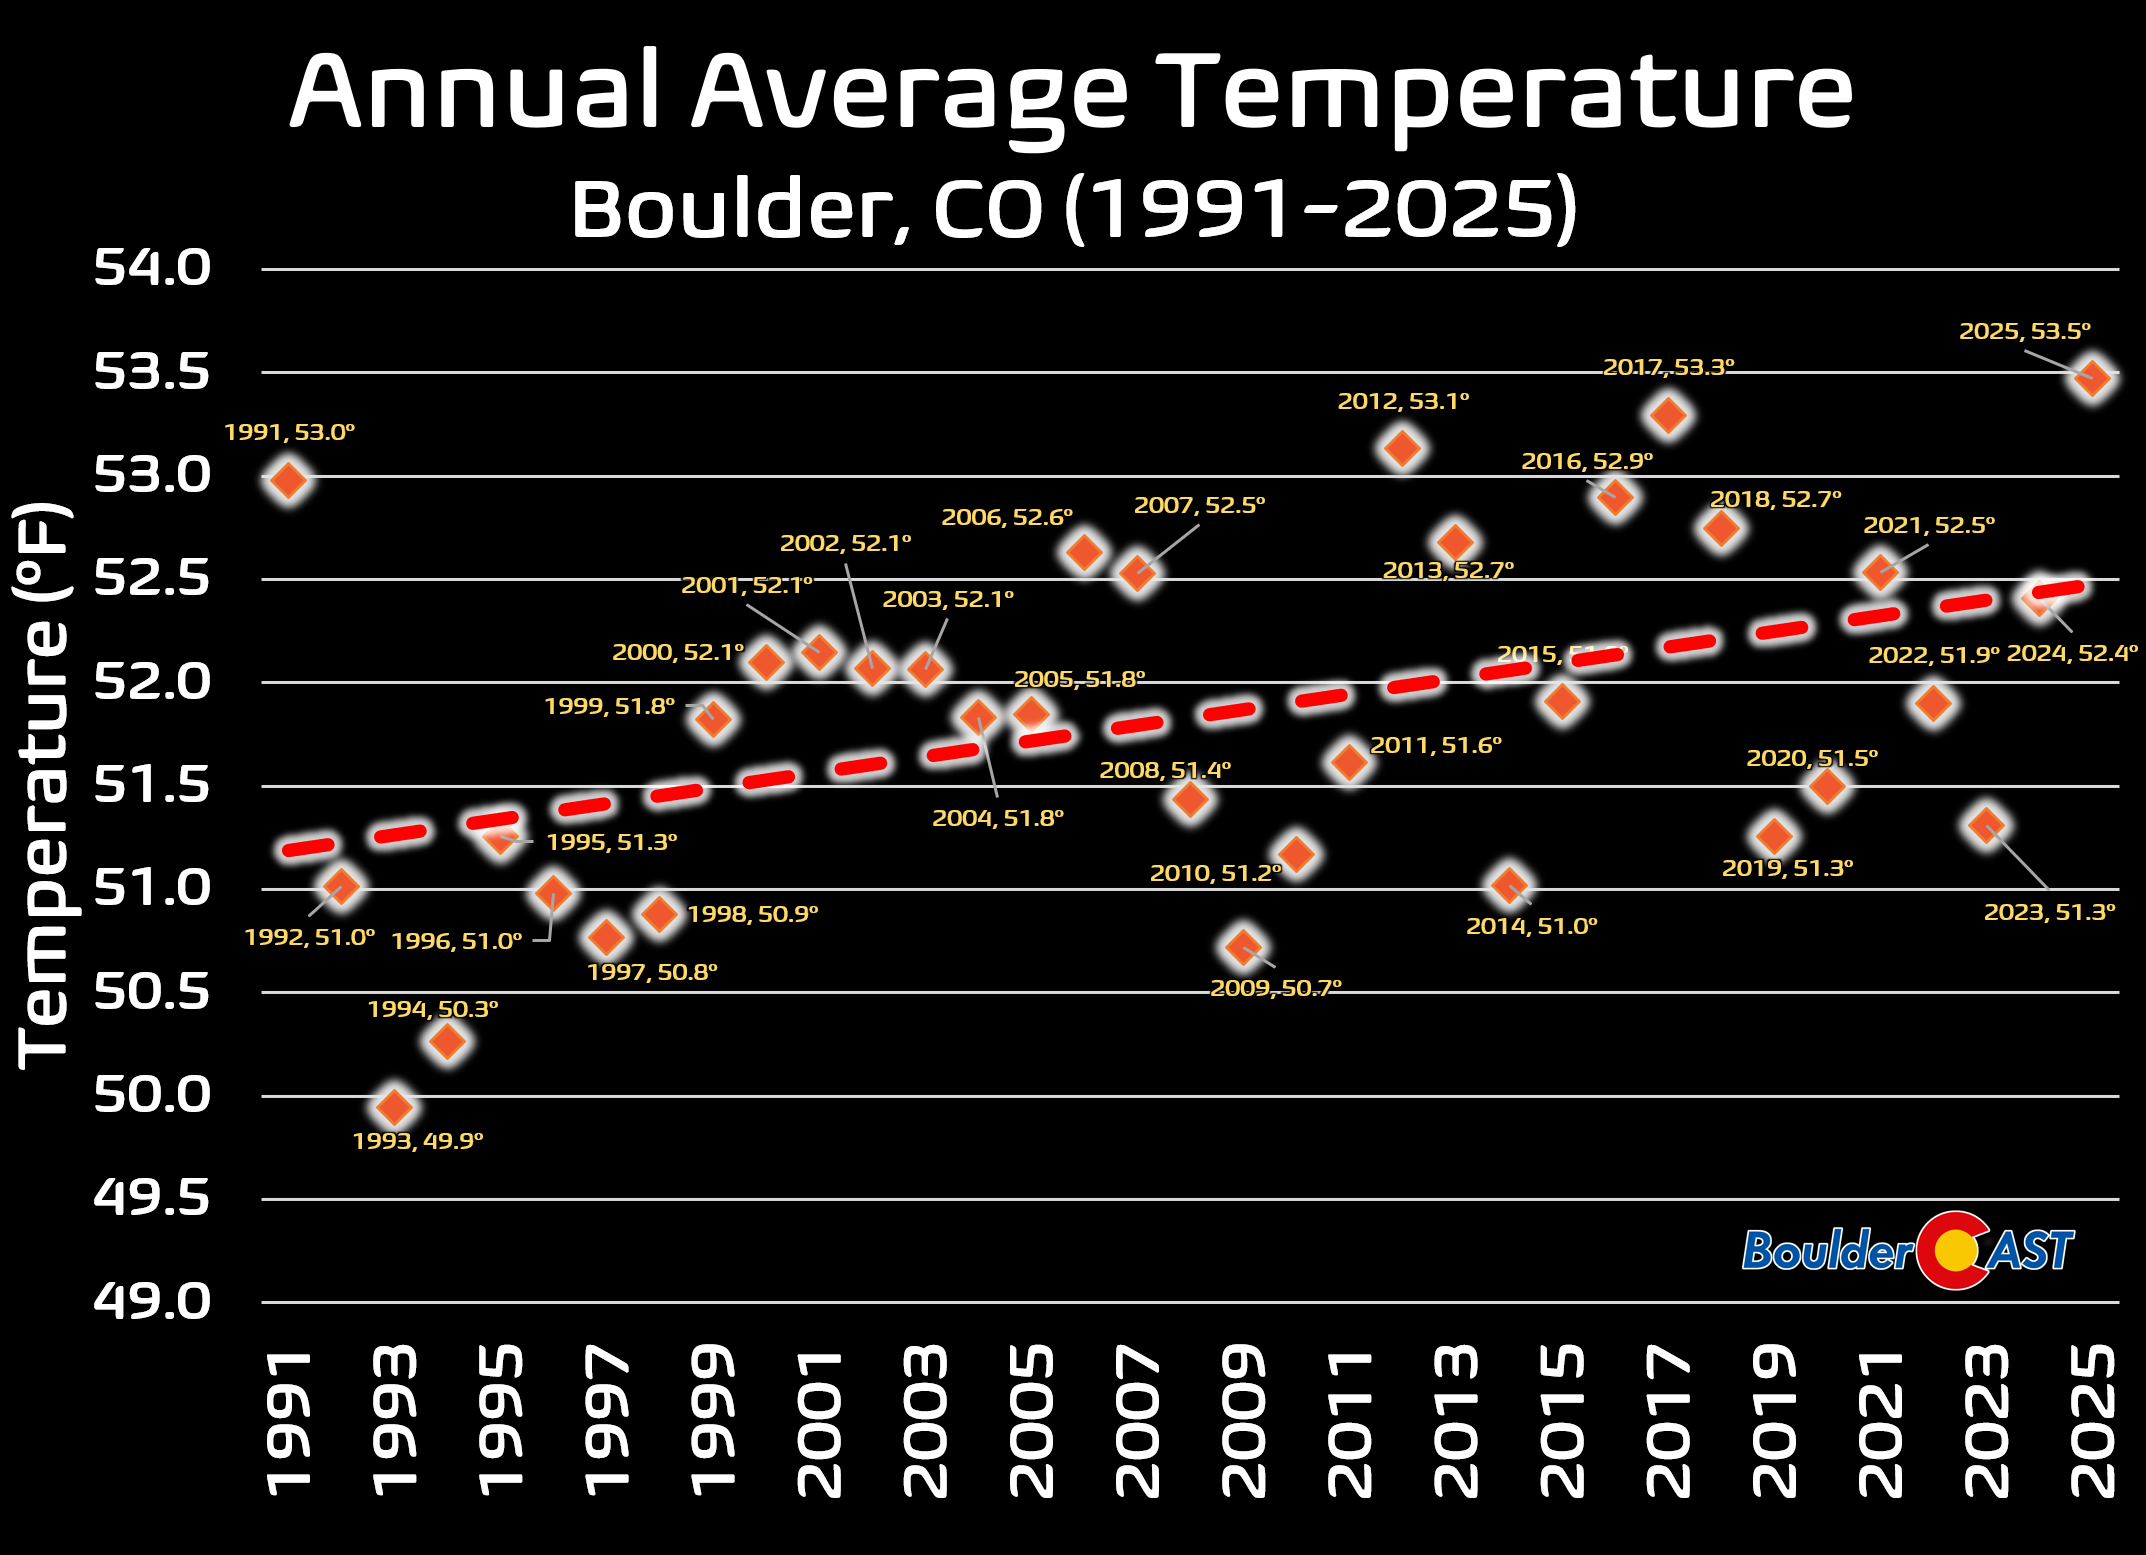
Zooming in further to only the modern NIST climate station (1991–present), 2025 stands alone as the warmest year in this apples‑to‑apples dataset. Boulder has warmed roughly 1.5°F over the last three decades.
Colorado Warmth
Colorado just wrapped up its 4th‑warmest year on record in 2025, running about 2.5°F hotter than the 20th‑century average. The Western Slope was the real standout, logging the most anomalous warmth anywhere in the state.
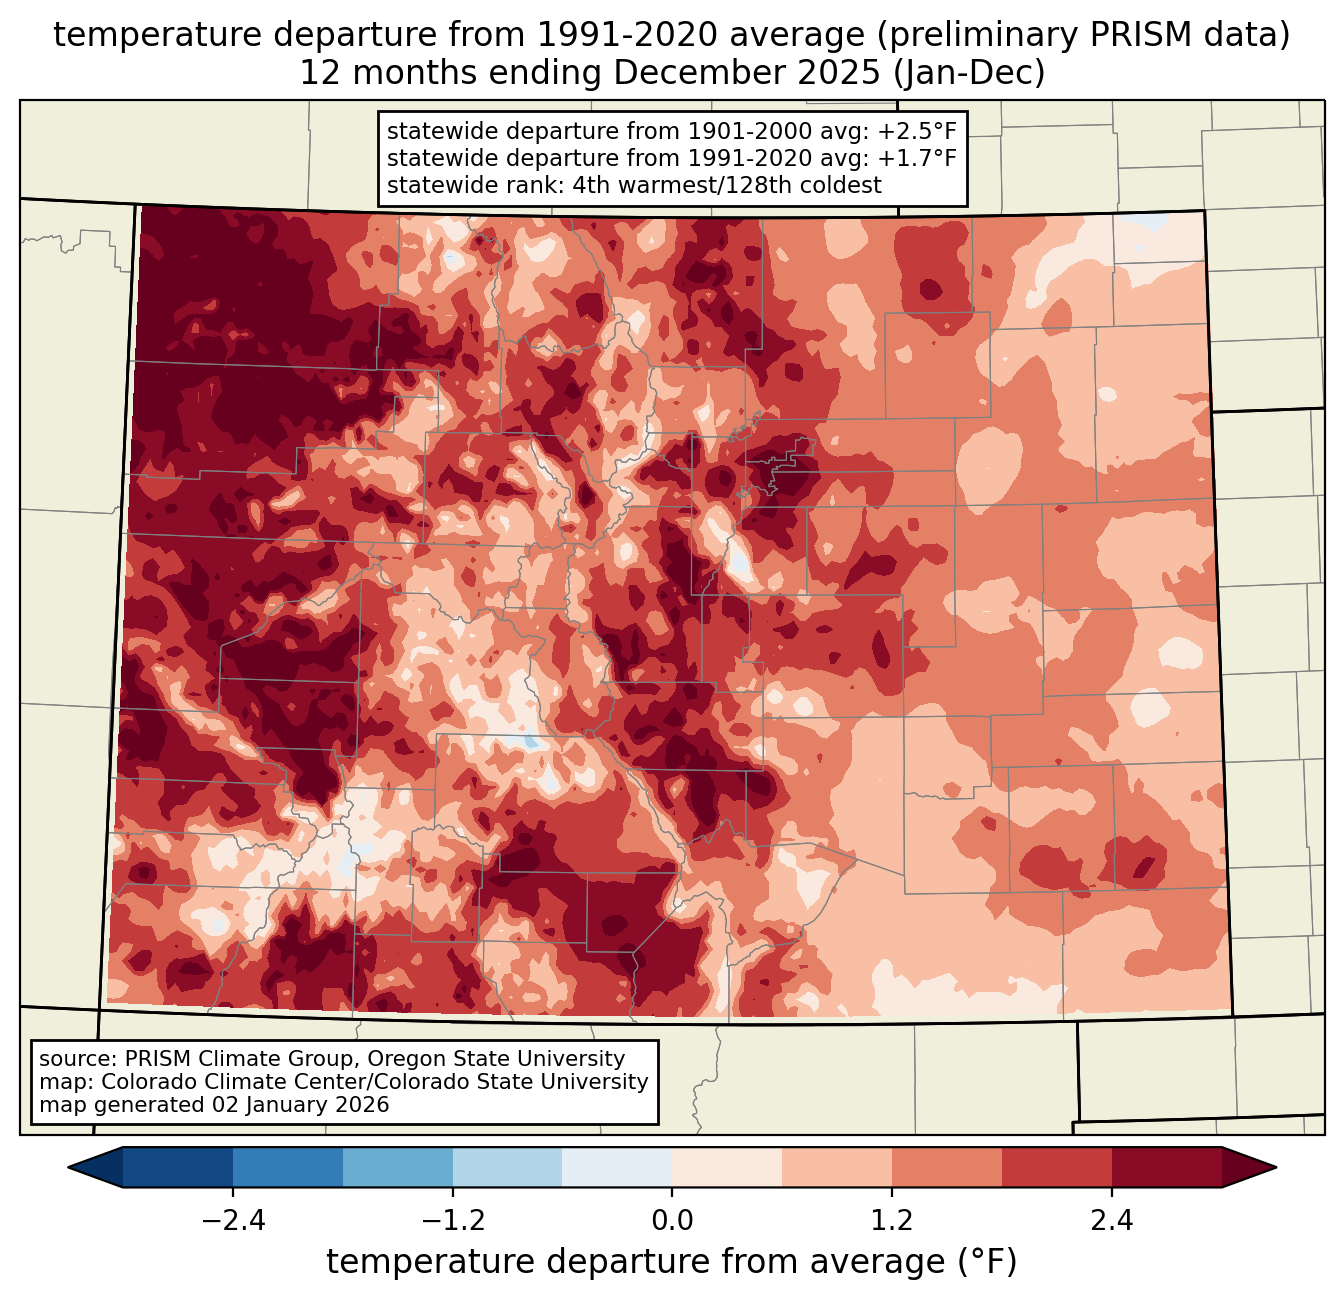
In fact, several Western Slope communities notched their warmest year ever recorded. Nearly everywhere else in Colorado still managed a top‑10 warm finish, underscoring just how persistently warm 2025 was from border to border.
![]()
Precipitation: A Wet Start, a Dry Finish
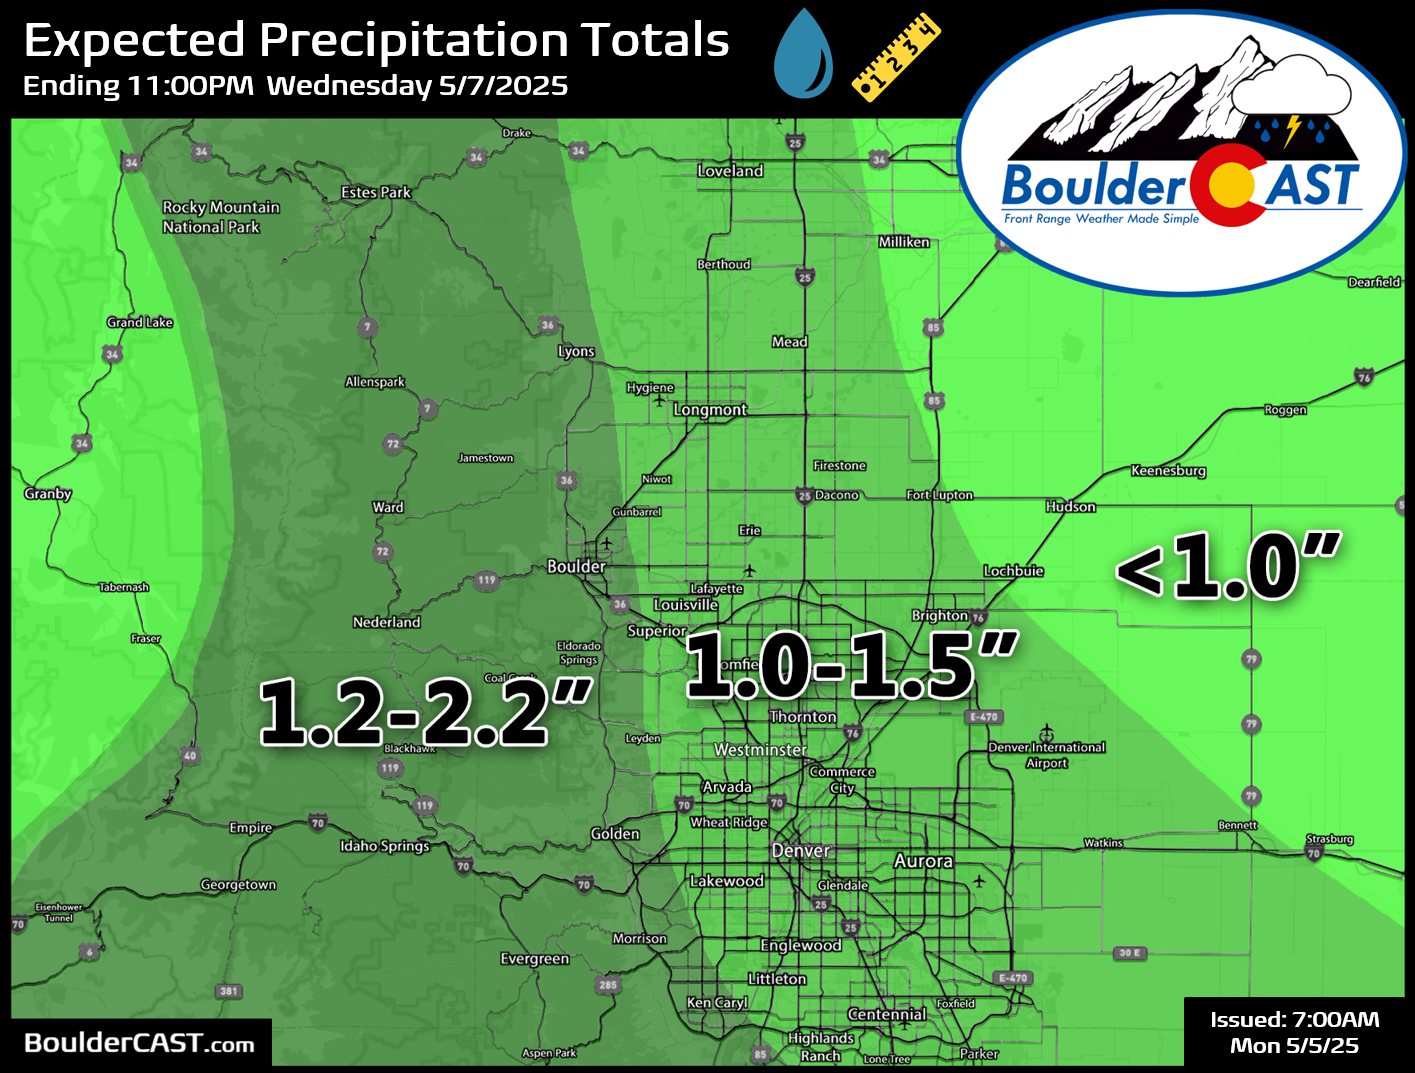
Switching gears now to precipitation, our cumulative timeline graph below shows Boulder ended 2025 with 18.81″ of total moisture. A soggy late spring gave us a healthy surplus heading into monsoon season.
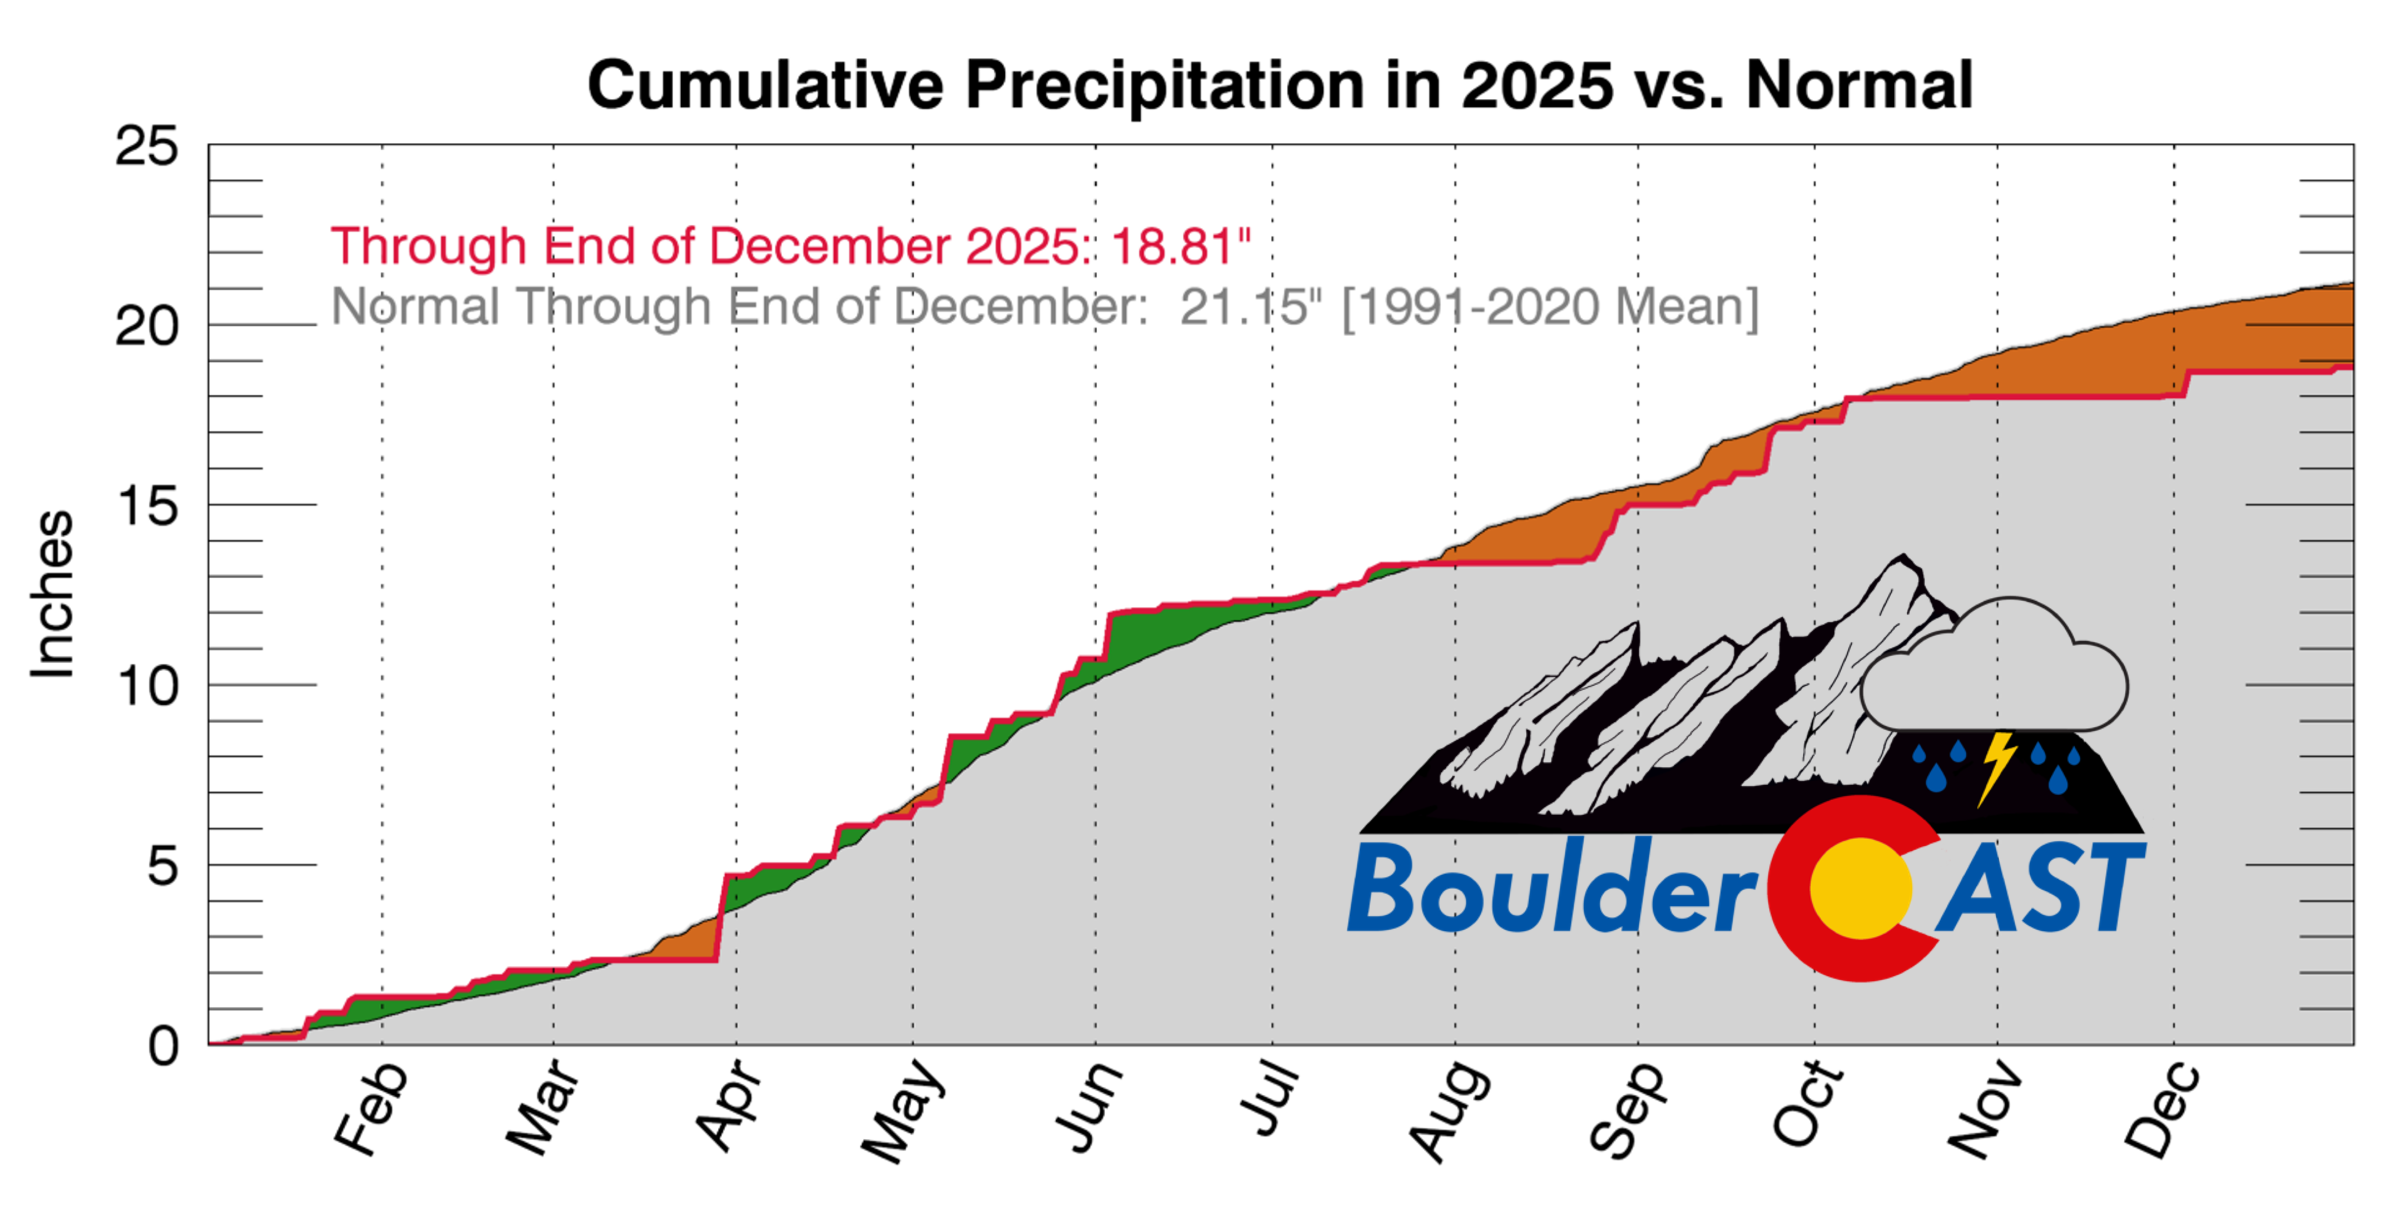
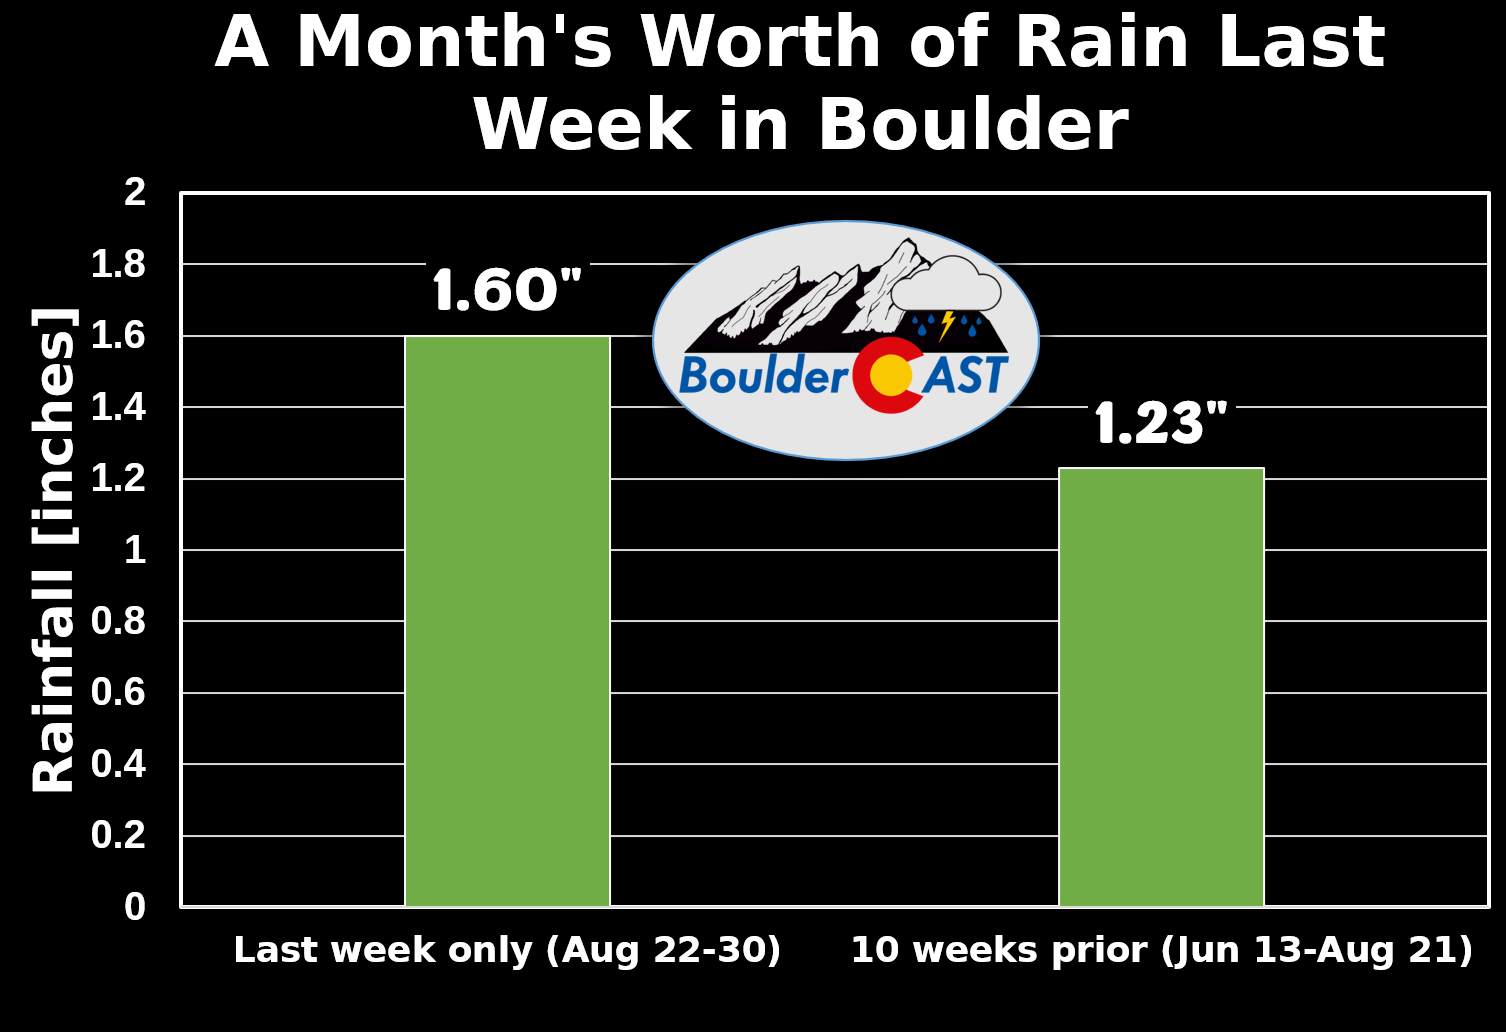
Monsoon storms were frequent — 26 days with measurable rainfall, right on par with normal — but they lacked oomph.

Total monsoon moisture came in at only 65% of average (2.80″ from June 15 to August 31), though monsoon season was salvaged a bit by a cool and rainy final week of August when more than half the summer’s rain actually fell.

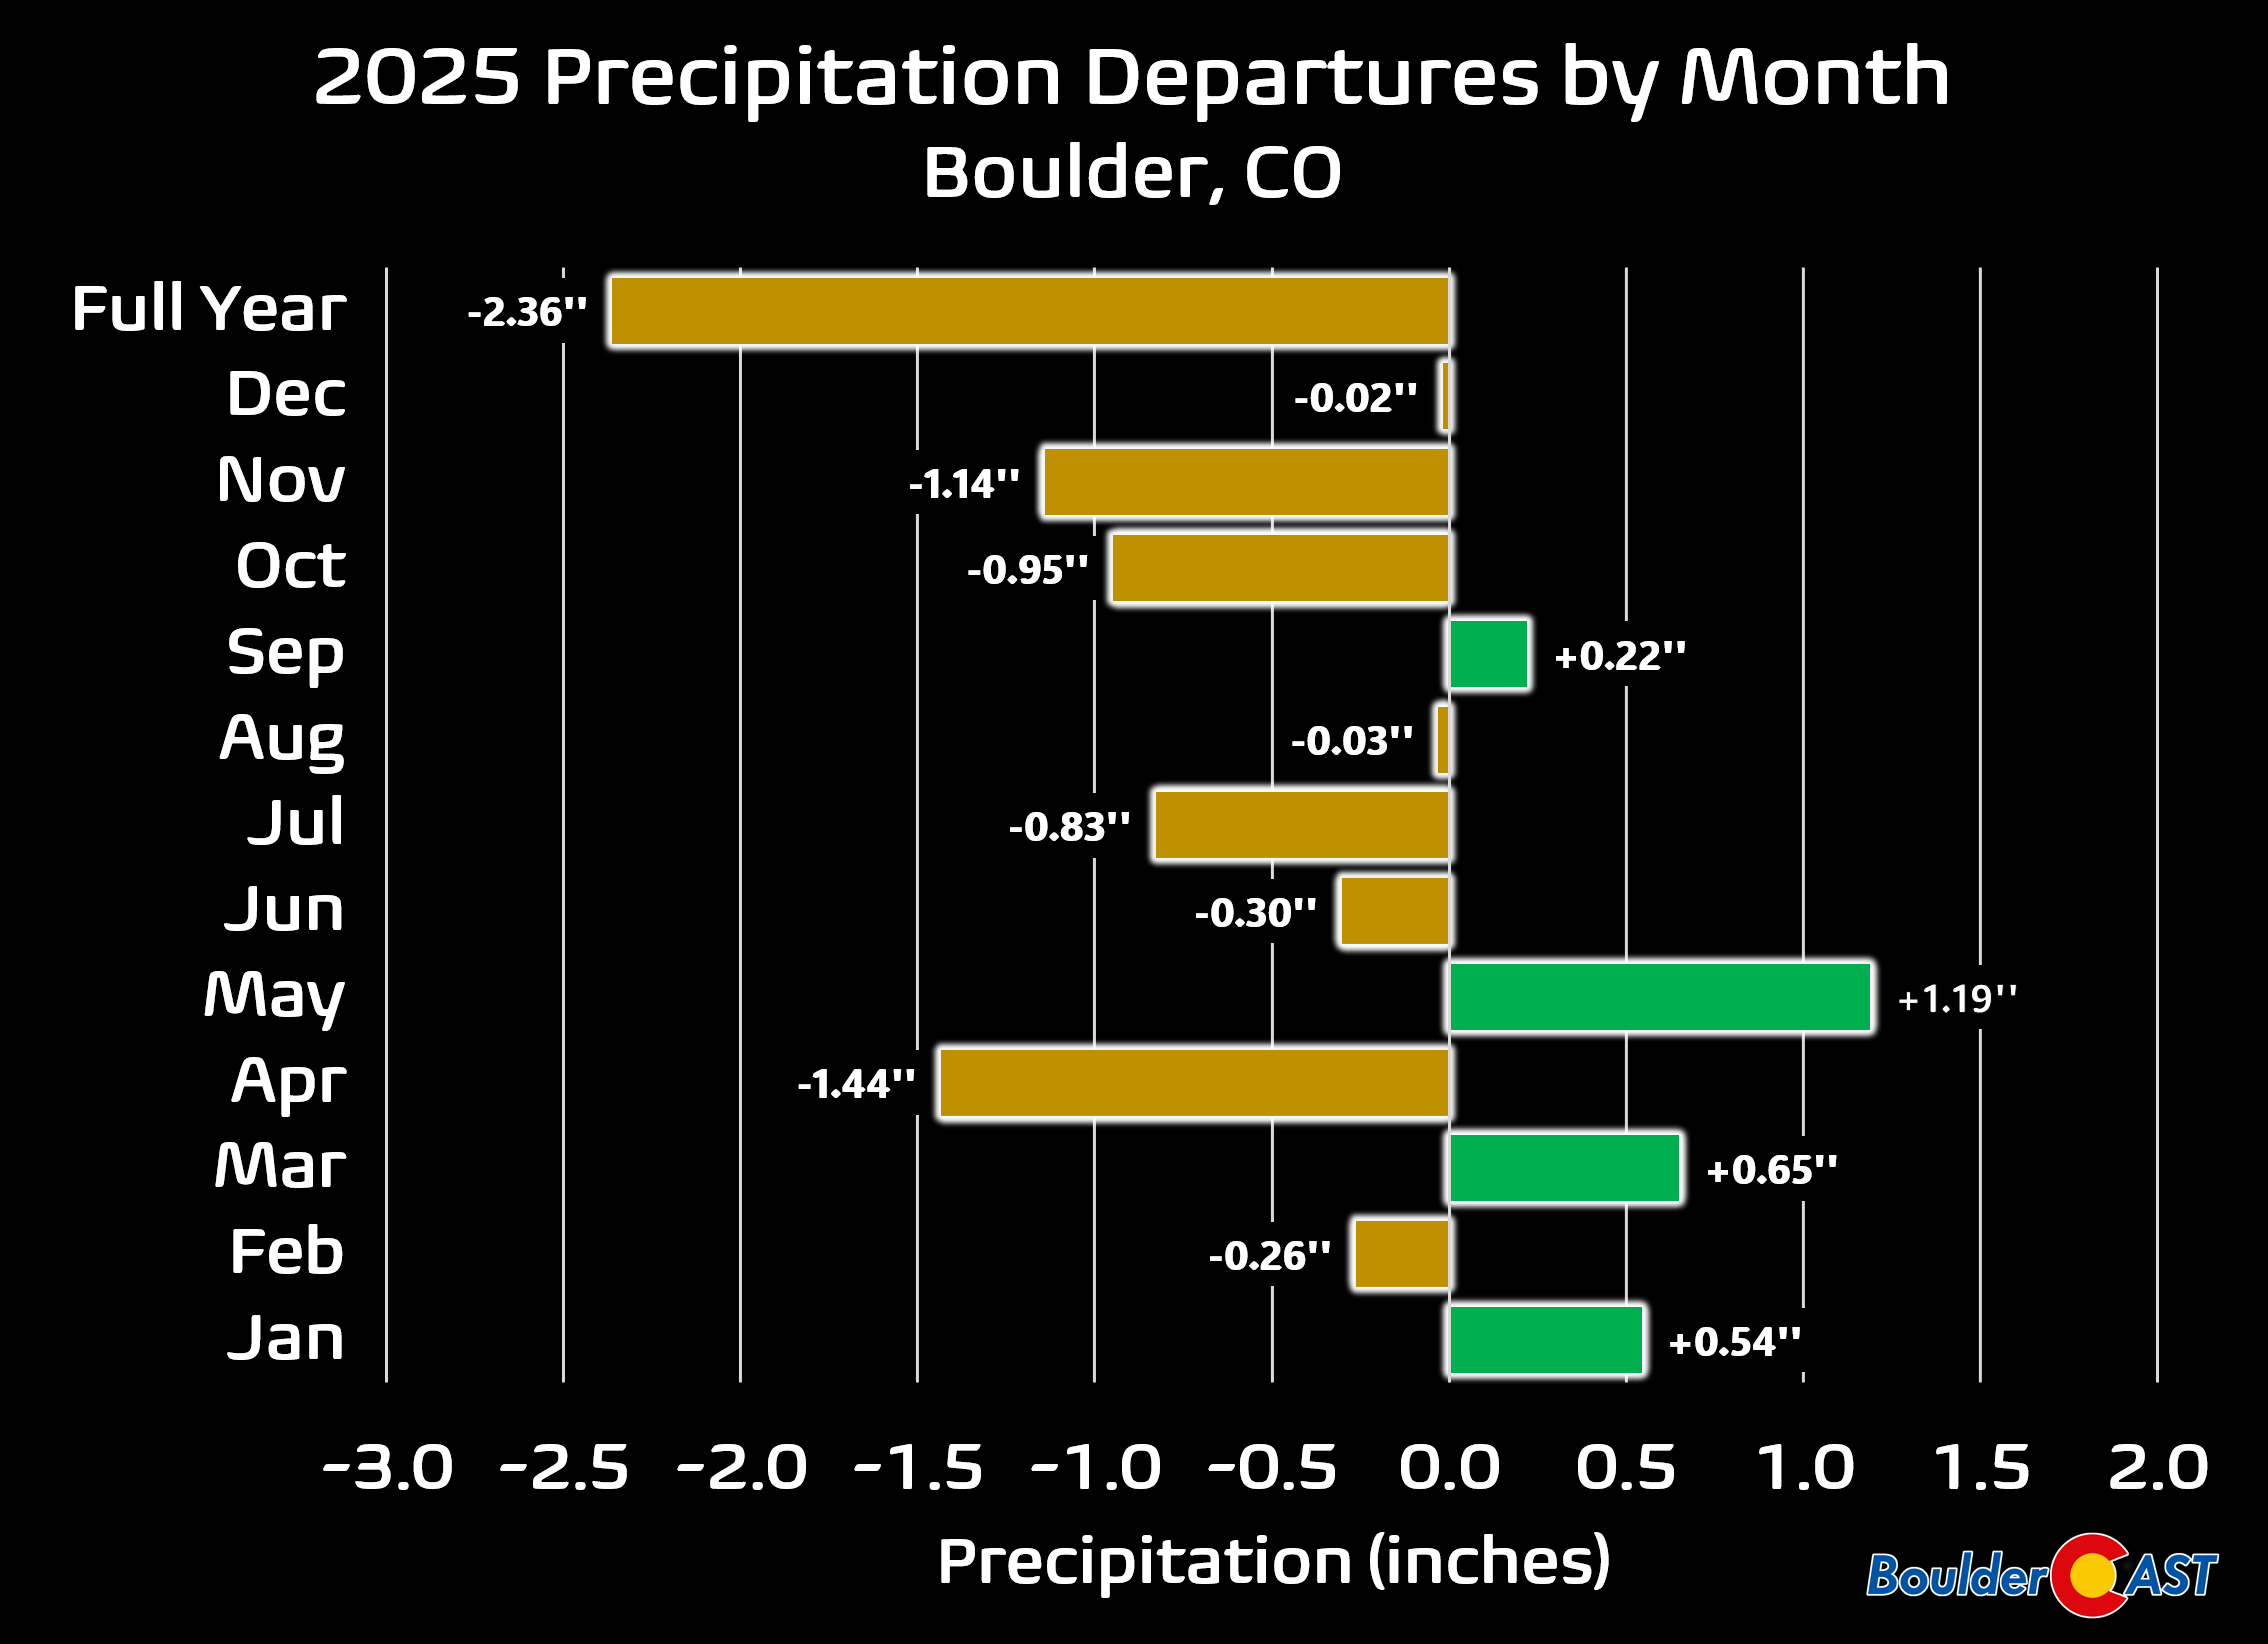
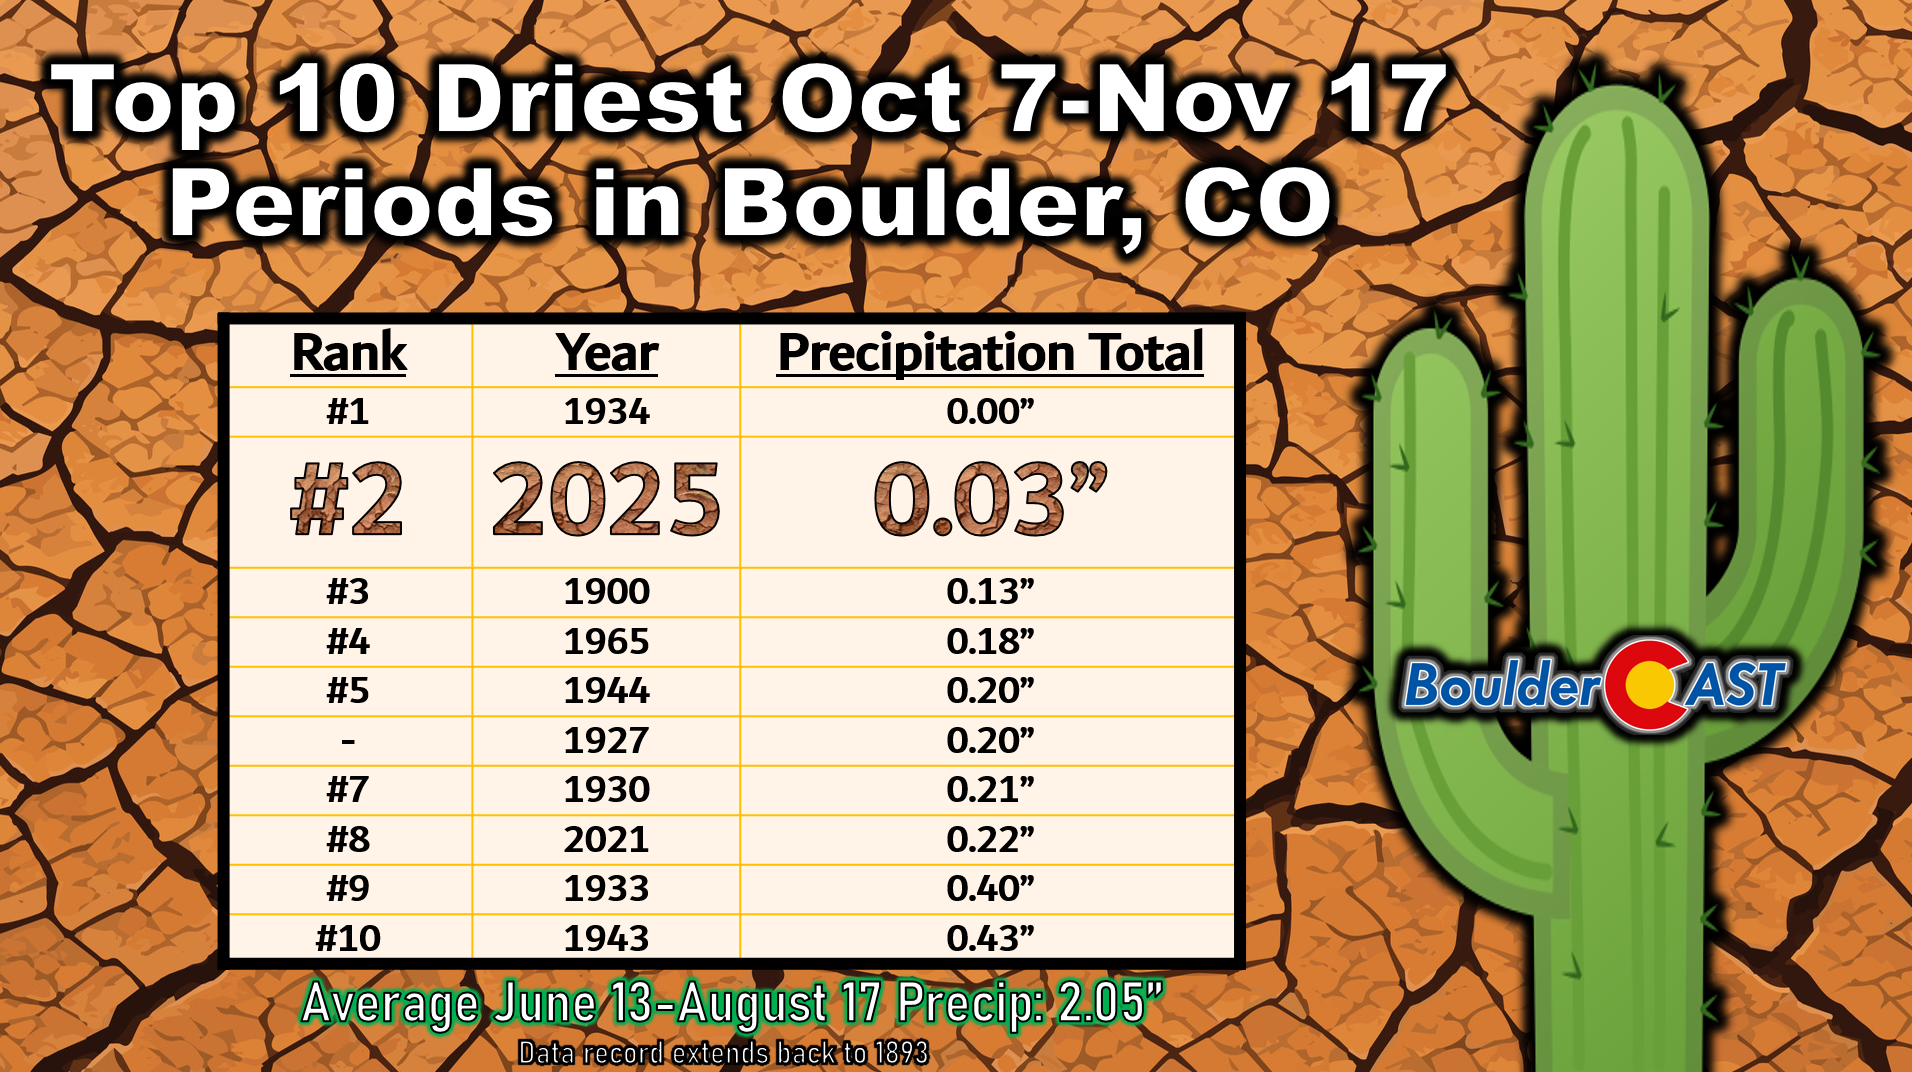
Dry conditions lingered into fall, ultimately pushing 2025 to 2.36″ below normal for the year. Eight months finished drier than average, though a couple were close to normal.
Over the full 130‑year record, Boulder shows a gentle upward trend in precipitation.
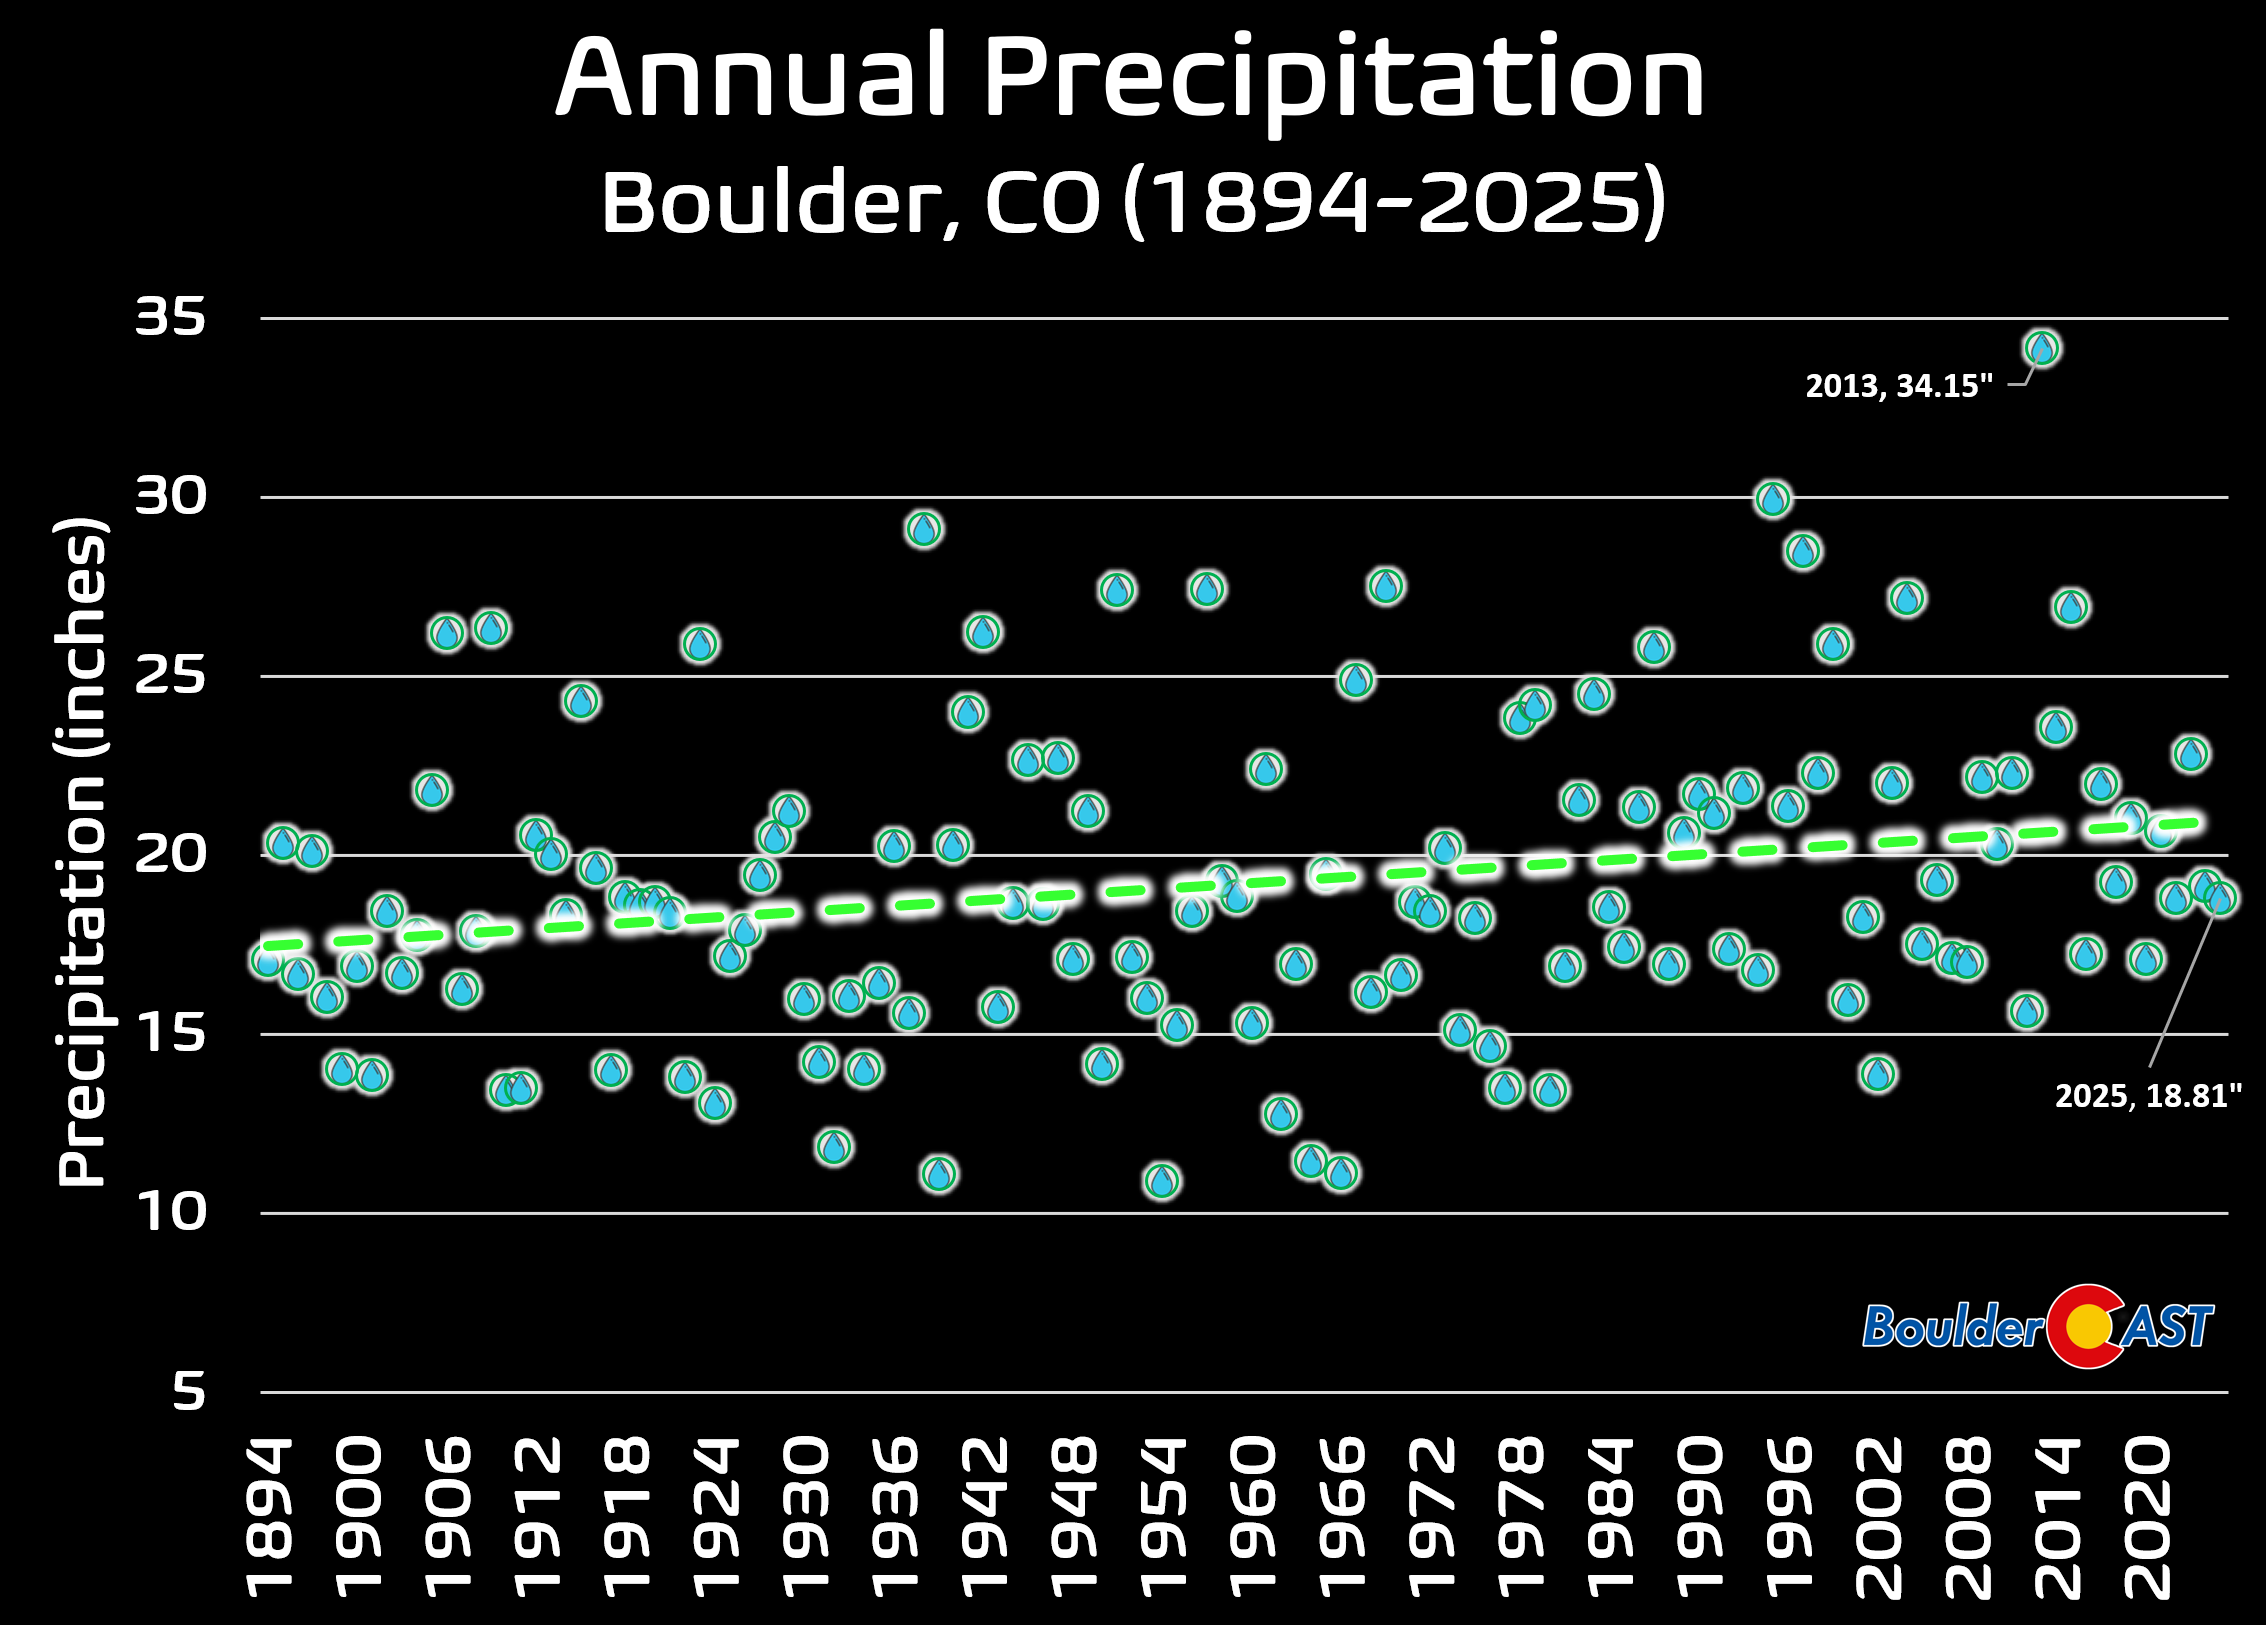
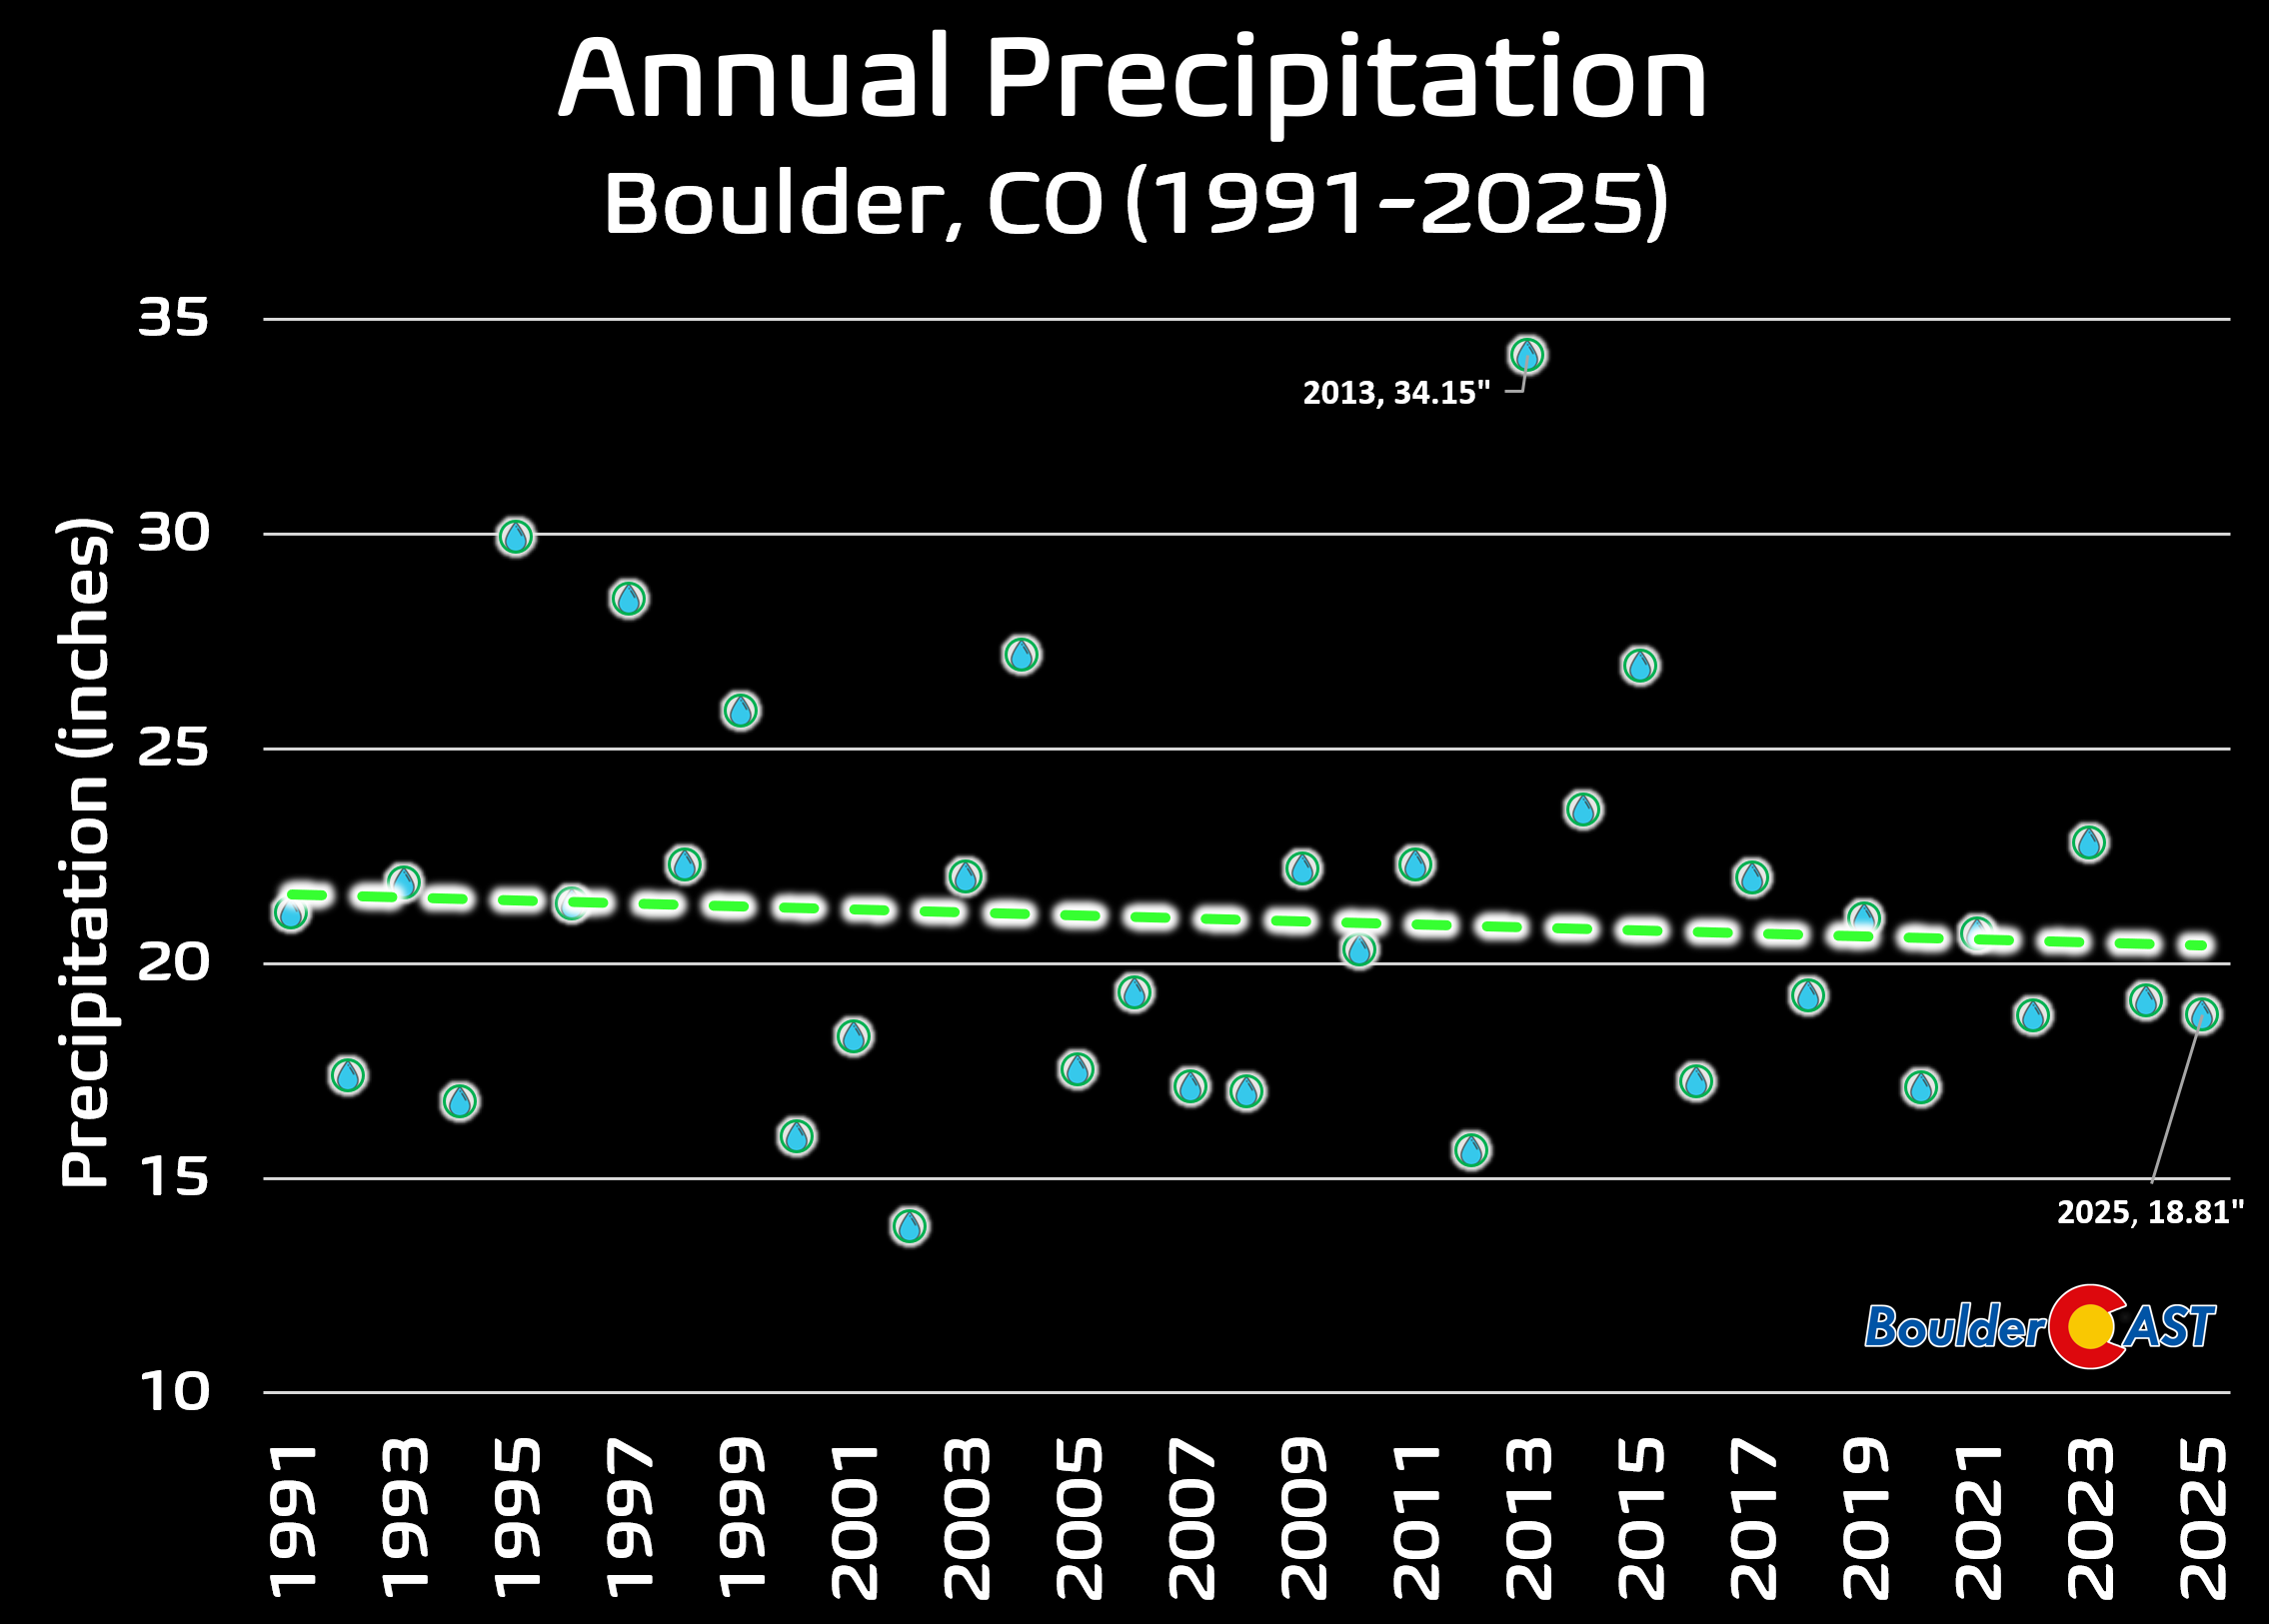
However, when just considering years where precipitation was measured at the current NIST climate station since 1991, the data shows a slight but statistically significant drying trend over the past 35 years. While year-to-year variability remains high (e.g., 2013’s extreme wet year due to the flood), the overall trajectory points toward mildly declining precipitation.
A Dry Western Slope
Colorado spent much of 2025 running on the dry side of the ledger. Statewide precipitation came in about 1.3″ below average, placing the year as the 41st driest since records began in 1893. The Mountains shouldered most of that deficit, while pockets of the Eastern Plains actually squeaked out an above‑normal year. The Denver Metro was mostly below normal.
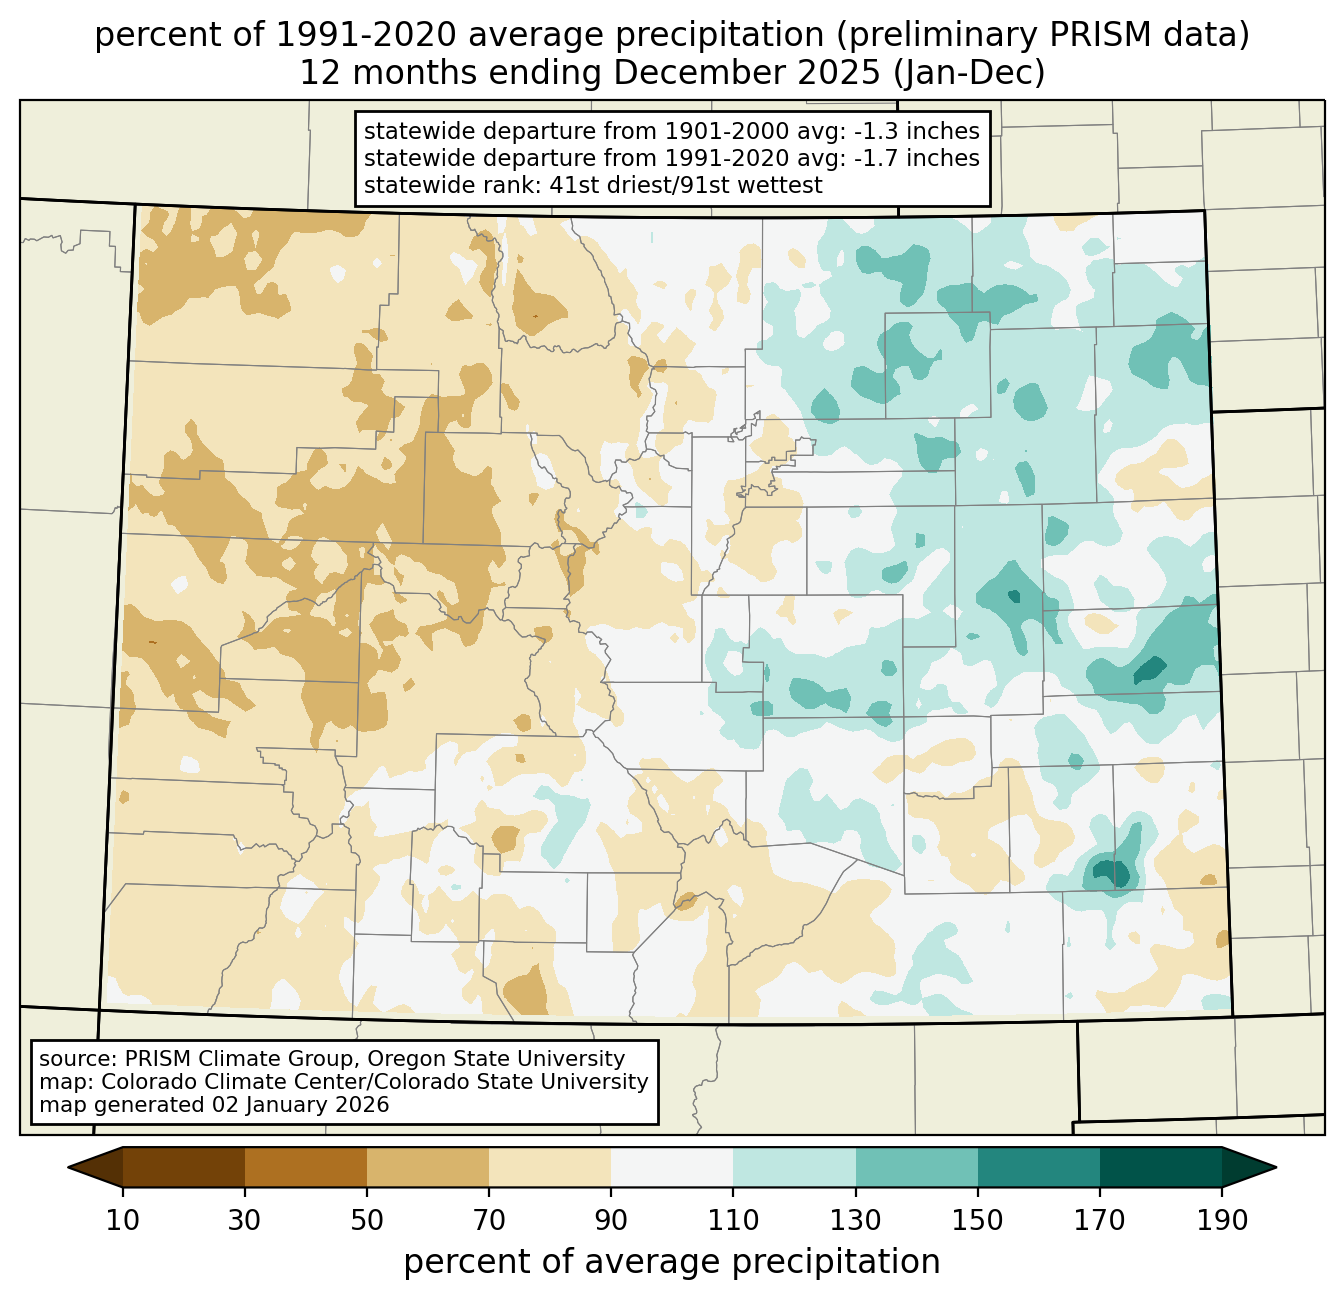
Up high, the story was even starker. Several mountain regions logged their driest year on record, with a much broader swath landing in the top‑10 driest. It was a tough year for snowpack, soil moisture, and anyone relying on consistent mountain precipitation—which, in Colorado, is basically all of us.
![]()
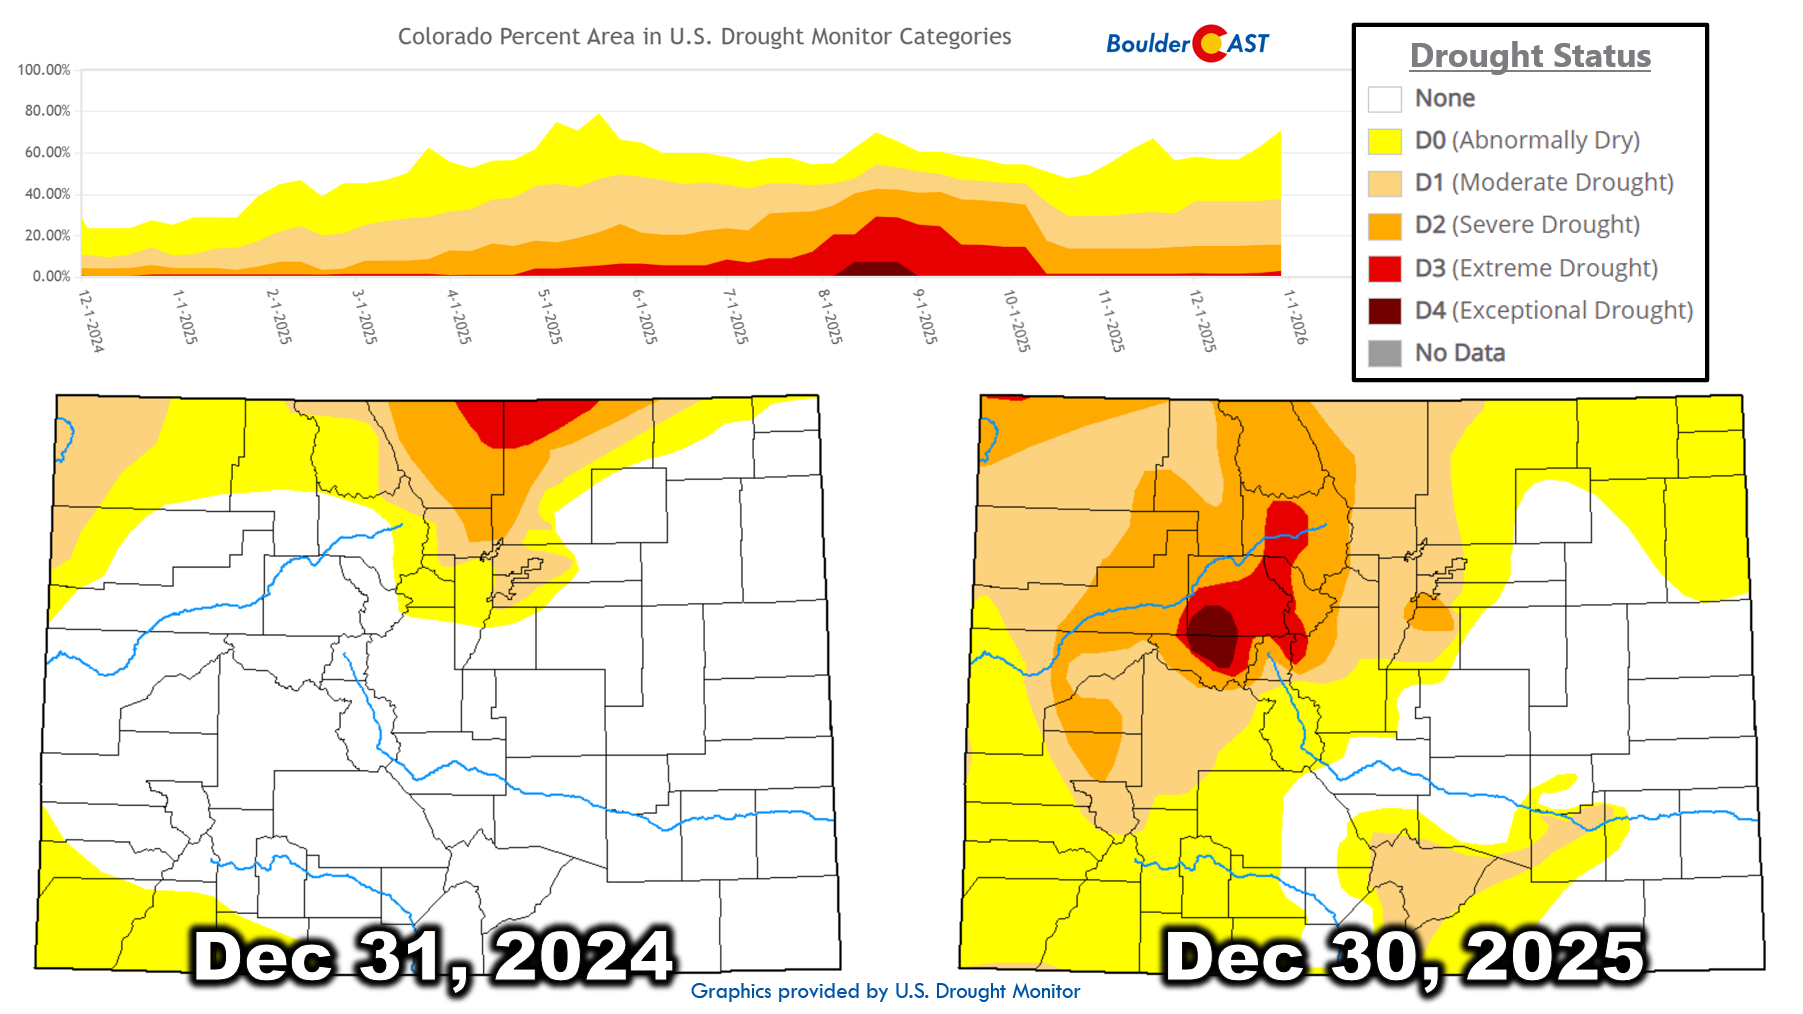
Drought conditions reflected that imbalance. Colorado ended 2025 in worse drought shape than it started, especially across the Mountains and the Front Range corridor. If there’s a sliver of good news, it’s that things were even worse midsummer. A respectable late-season monsoon revival in the High Country helped stabilize conditions just enough to keep the bottom from falling out. Still, a year this dry is never easy to swallow in a state so dependent on mountain snow and carefully managed water supply. There is a bright side, perhaps. La Niña is fading, and with it comes at least a glimmer of hope that 2026 can steer us back toward a healthier moisture balance.
Climate Quadrants: Where 2025 Landed
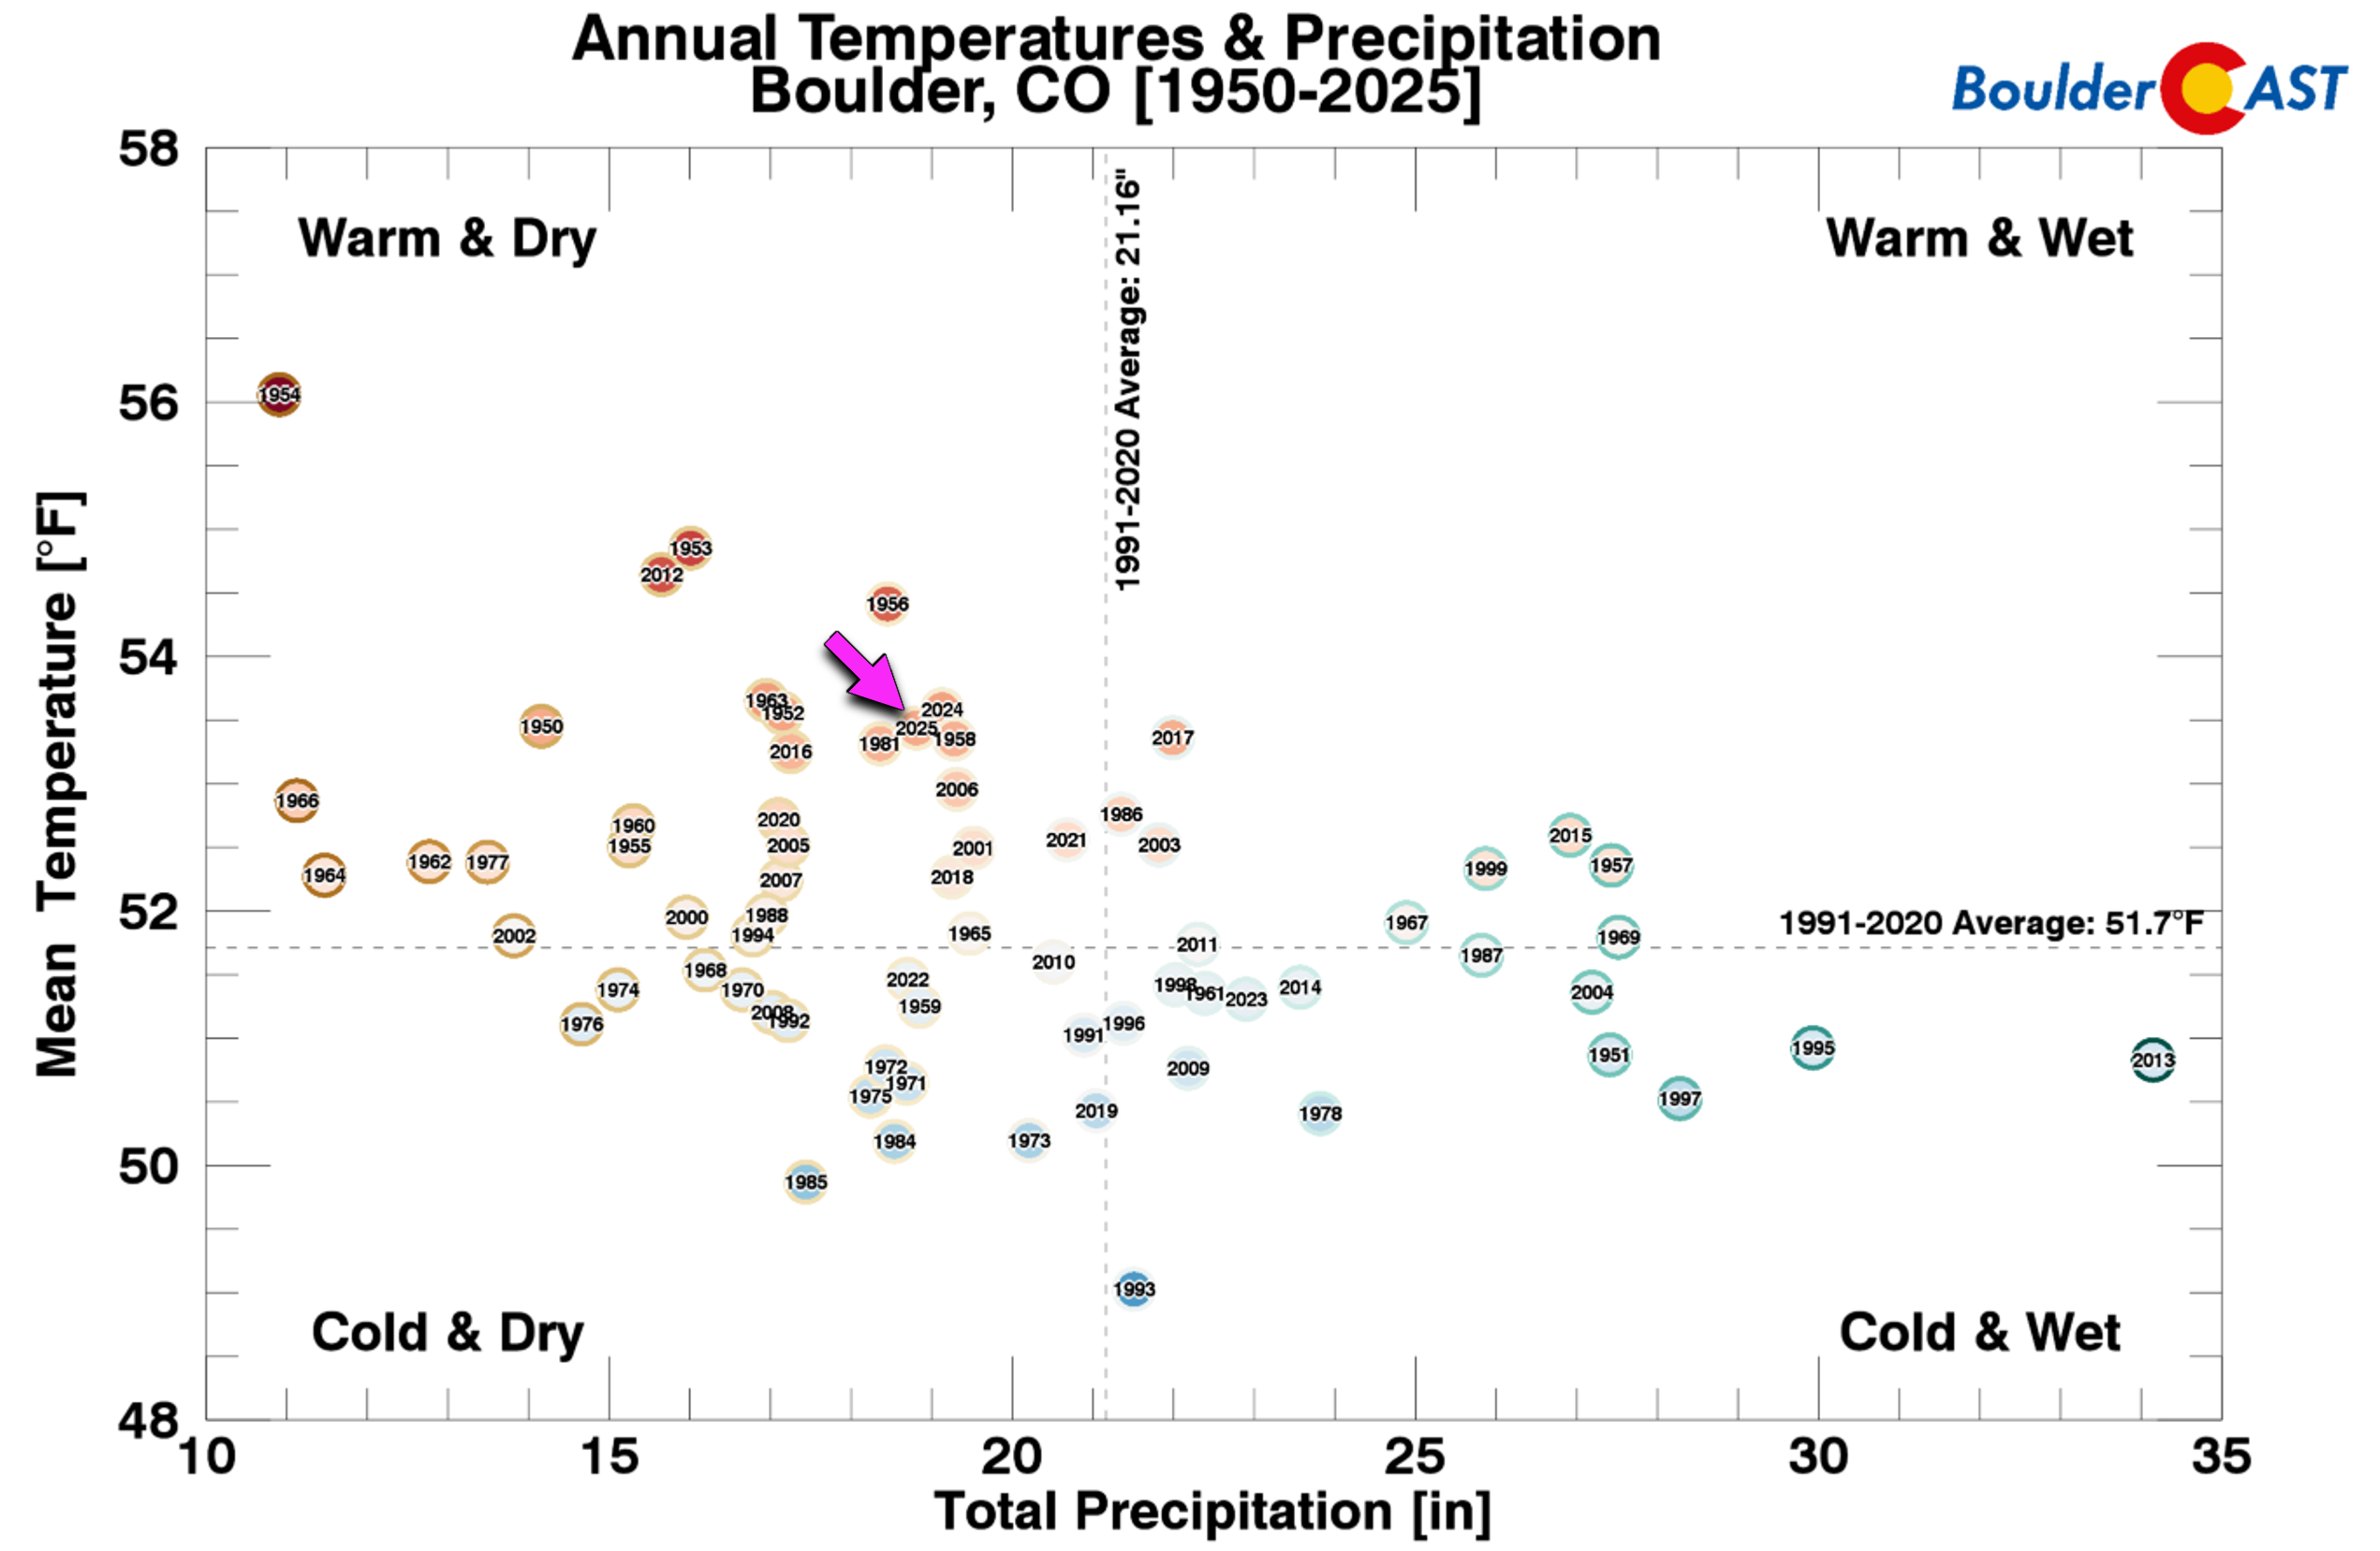
Using the 1991–2020 climate normals, Boulder’s 2025 weather can be grouped into four quadrants:
- Warm & Dry (top left): Years with above-average temperatures and below-average precipitation — a concerning combo for drought and fire risk, a quadrant that is becoming more common.
- Warm & Wet (top right): Hot years with generous moisture — fairly rare but often impactful.
- Cold & Dry (bottom left): Chilly, parched years — often linked to snow droughts.
- Cold & Wet (bottom right): Cooler years with ample precipitation.
Unsurprisingly, 2025 landed squarely in the Warm & Dry quadrant, joining many recent years in the 2020s. This clustering reinforces the broader trend toward hotter, drier conditions along the Front Range.
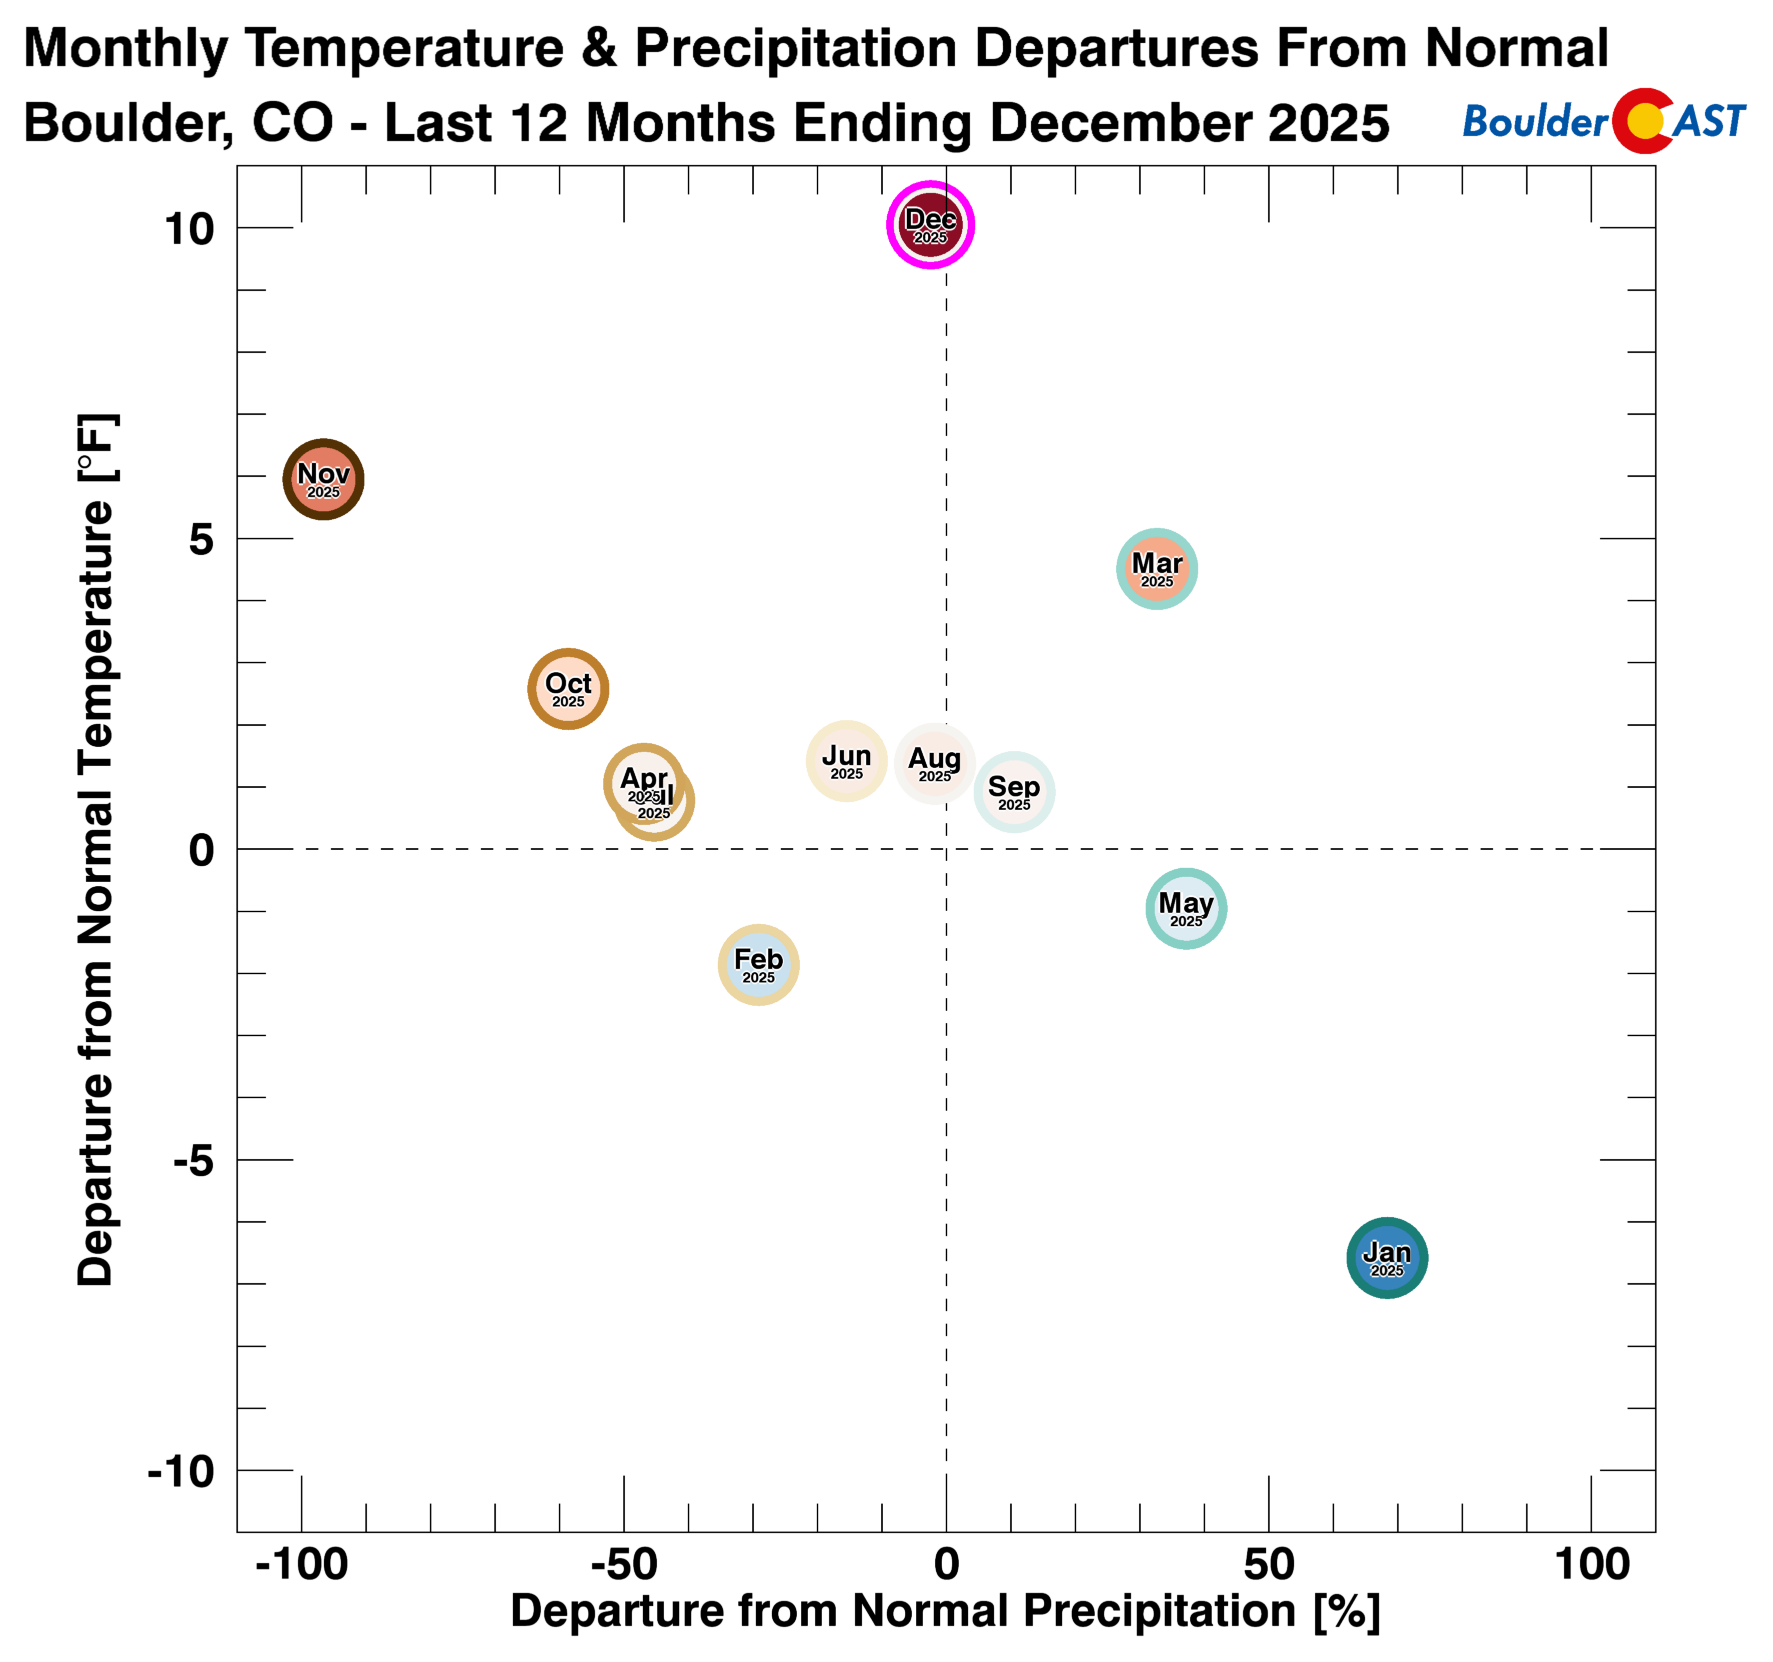
Here’s the same style of graphic, but now broken down by month in 2025 (sorry but July is obscured under April here). The anomalous cold/snowy January, the warm and (nearly) snowless November, and the over-baked month of December all clearly stick out.
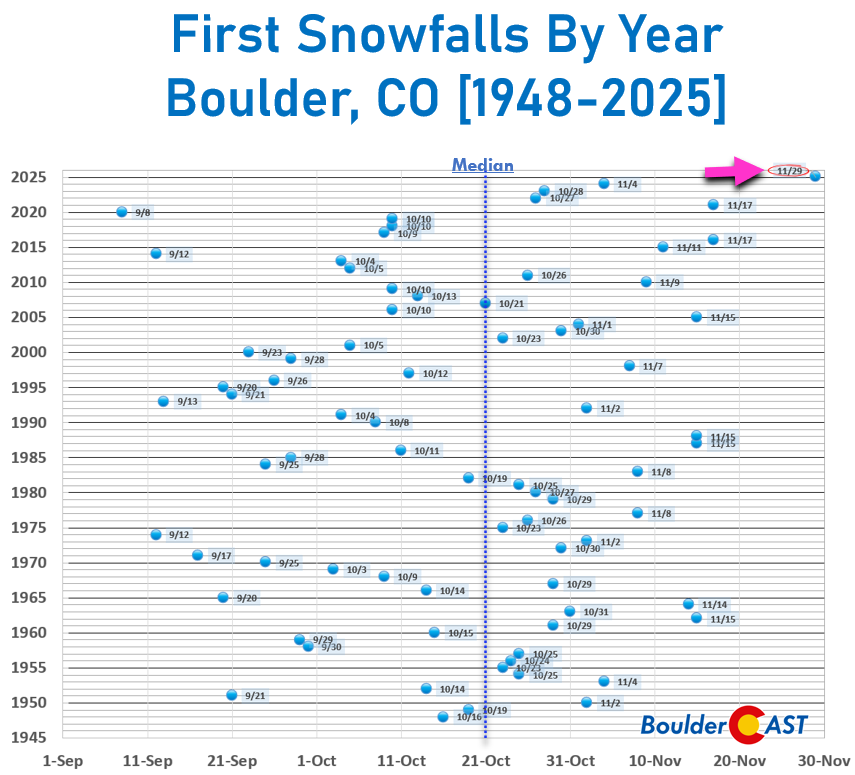
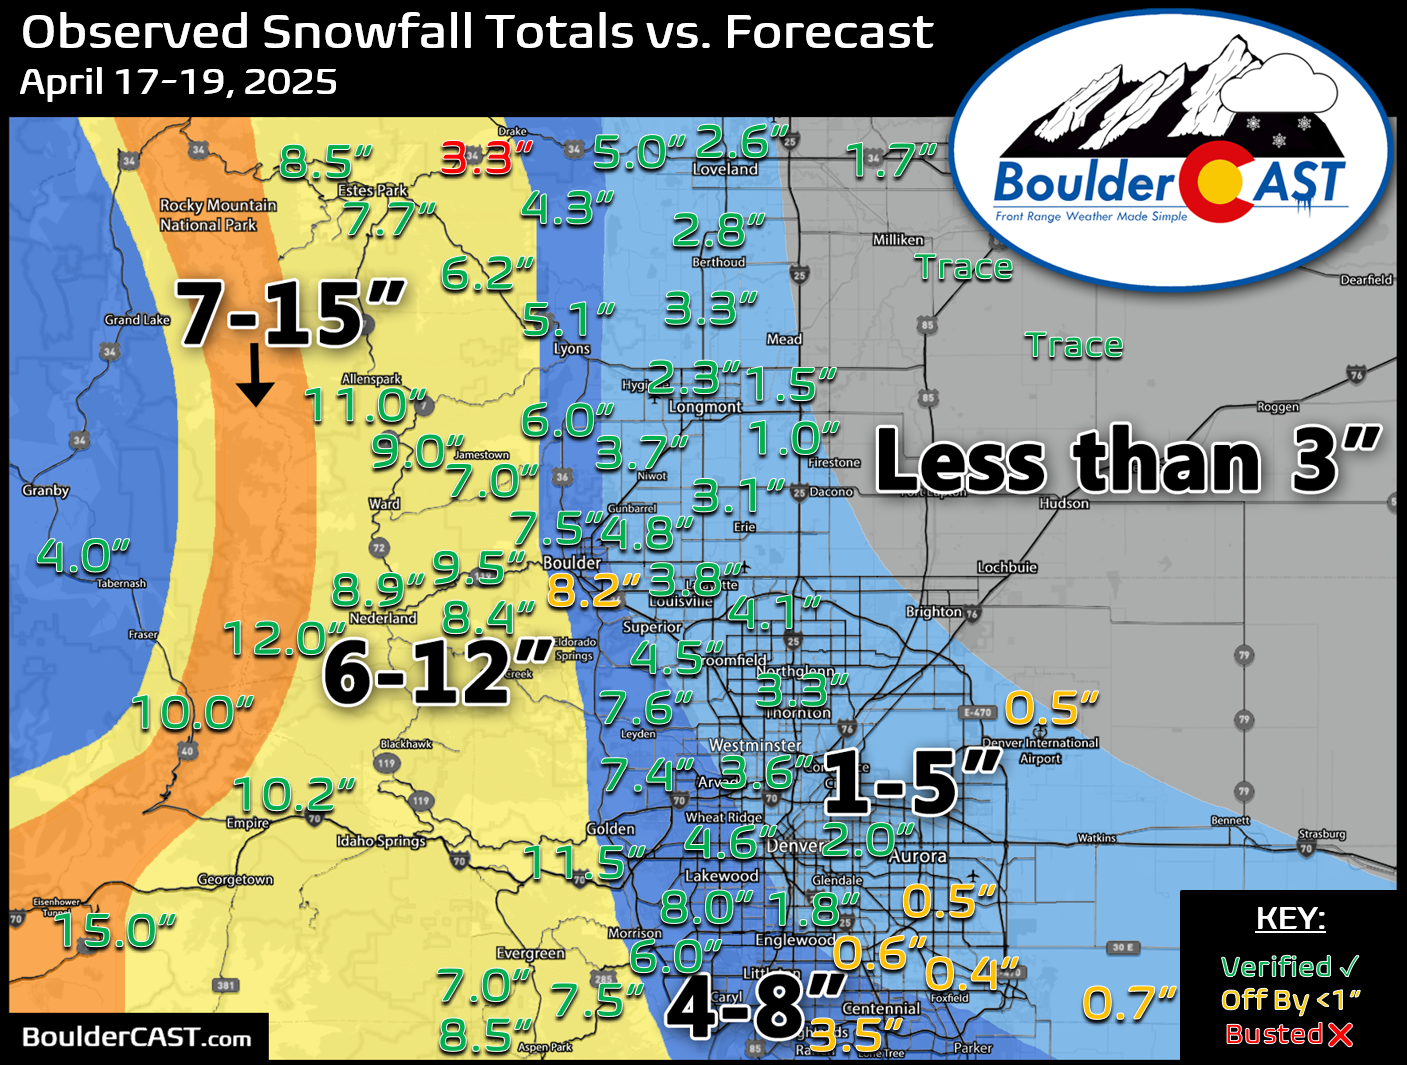
Snow: A Record Late Start and Low Year
Snow lovers had a rough go in 2025. Boulder’s first snow of the season didn’t arrive until November 29th, a paltry 0.3″ — smashing the previous record for latest first snowfall (November 17th) by nearly two weeks. This made for barely any excitement in our 11th Annual First Snow Contest.
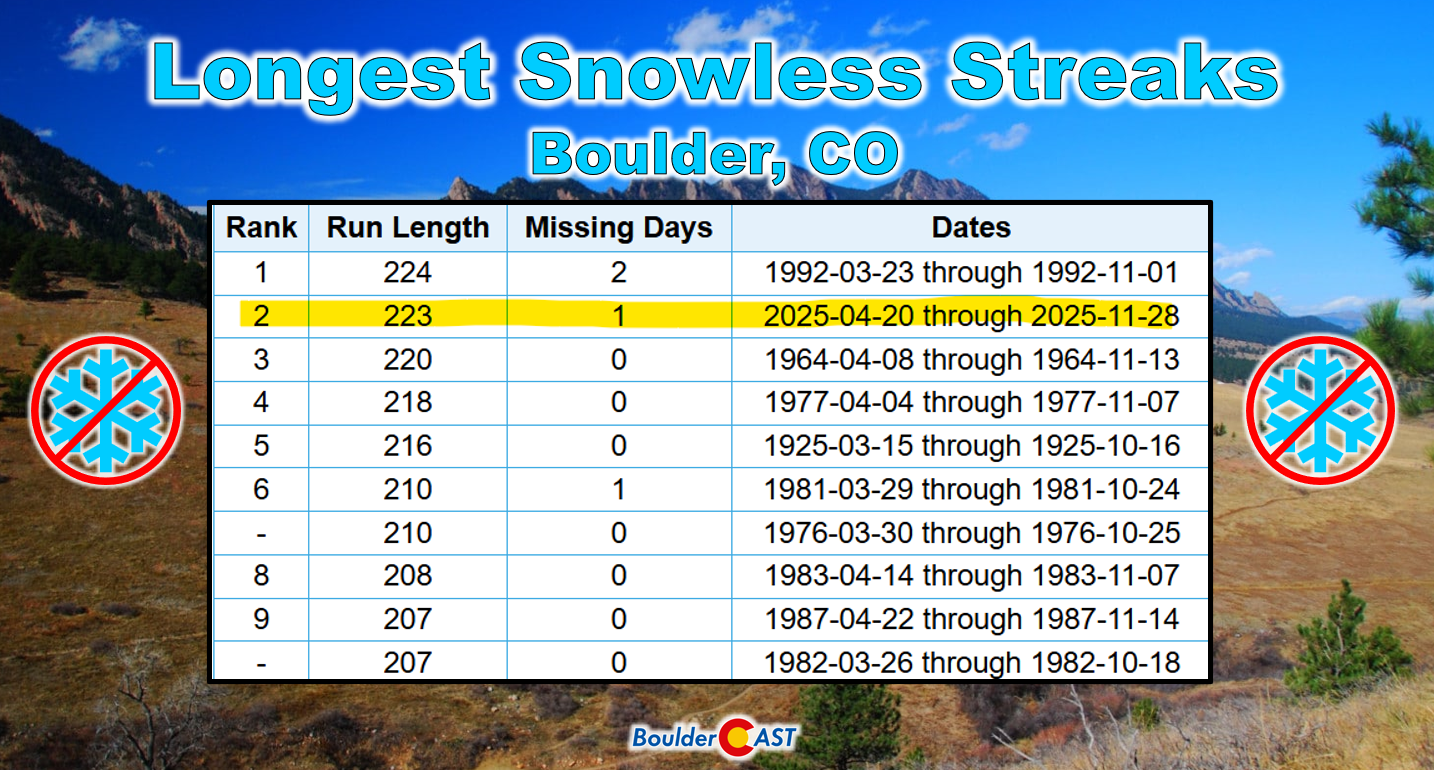
Combined with an earlier than usual final snowfall last spring, Boulder logged its second longest snowless streak on record, falling short of the 1992 record by just one day.
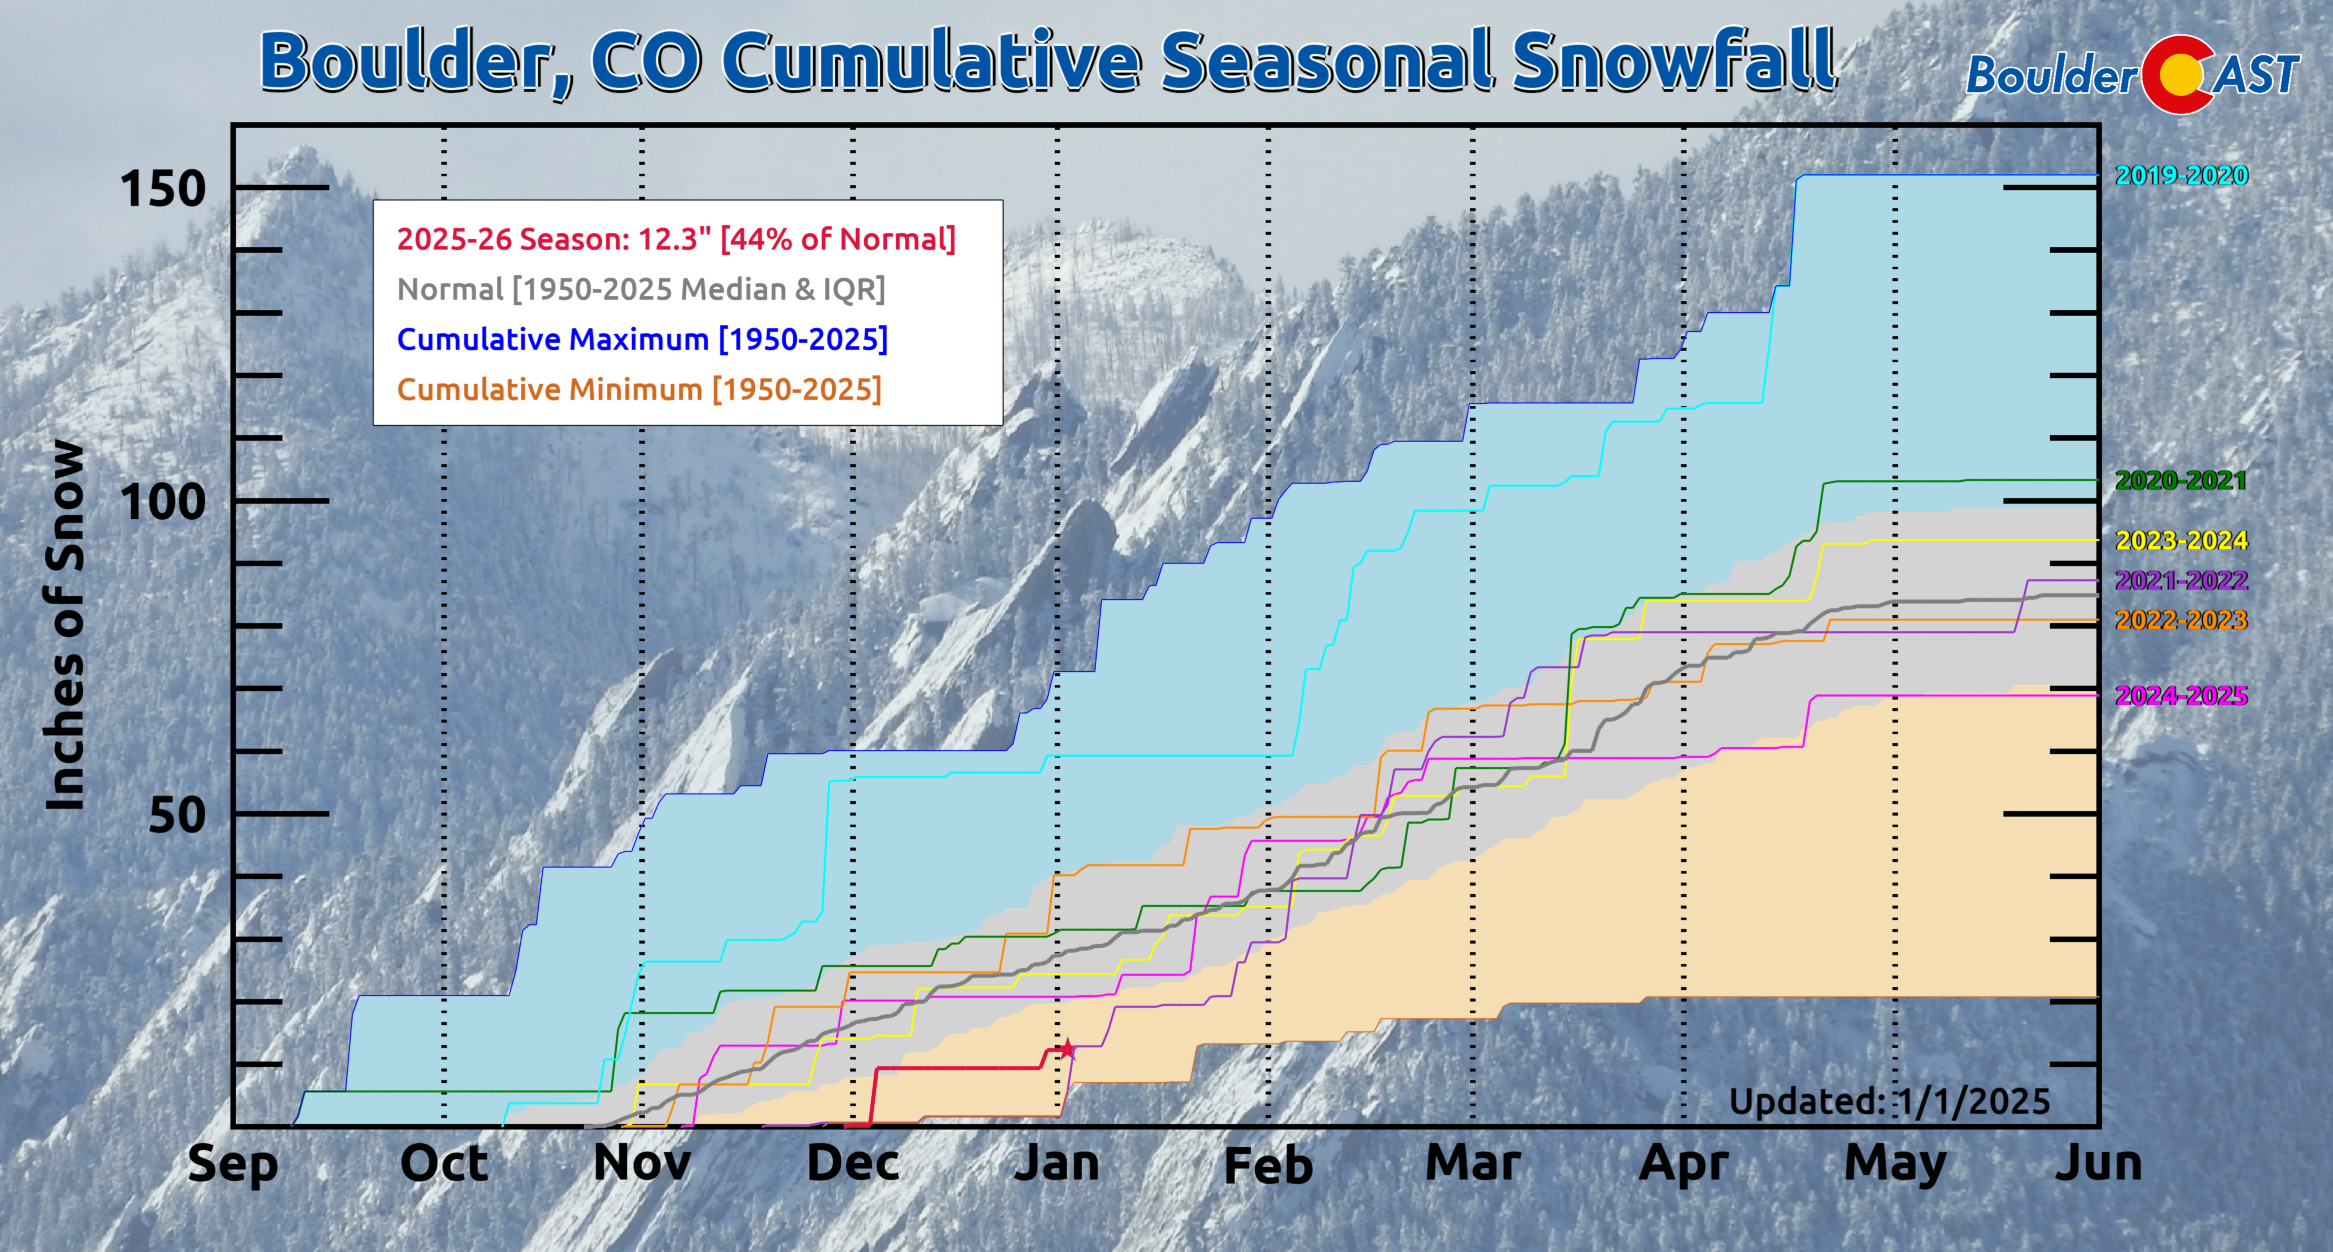
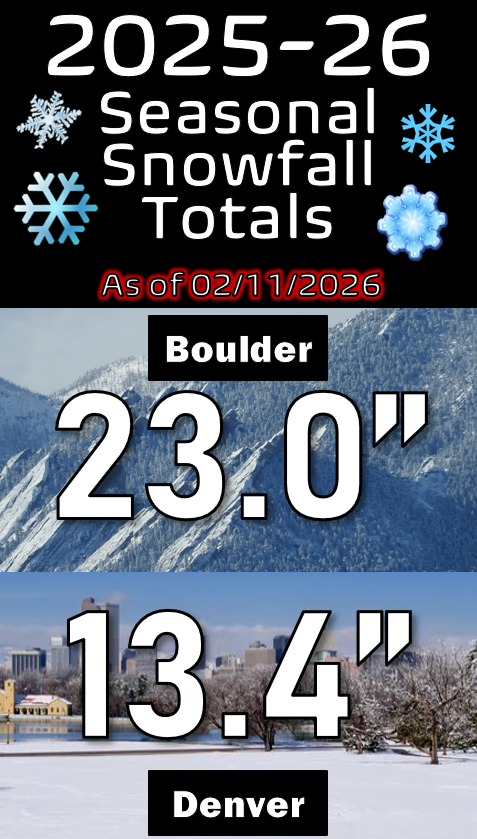
Following the record late first snow dusting, Boulder added 12″ of white stuff in the month of December, mostly from the well-forecasted event early in the month. The 2025-26 snow season is off to a slow start indeed, with only 44% of median snowfall through the end of December. Hopefully 2026 can turn things around!
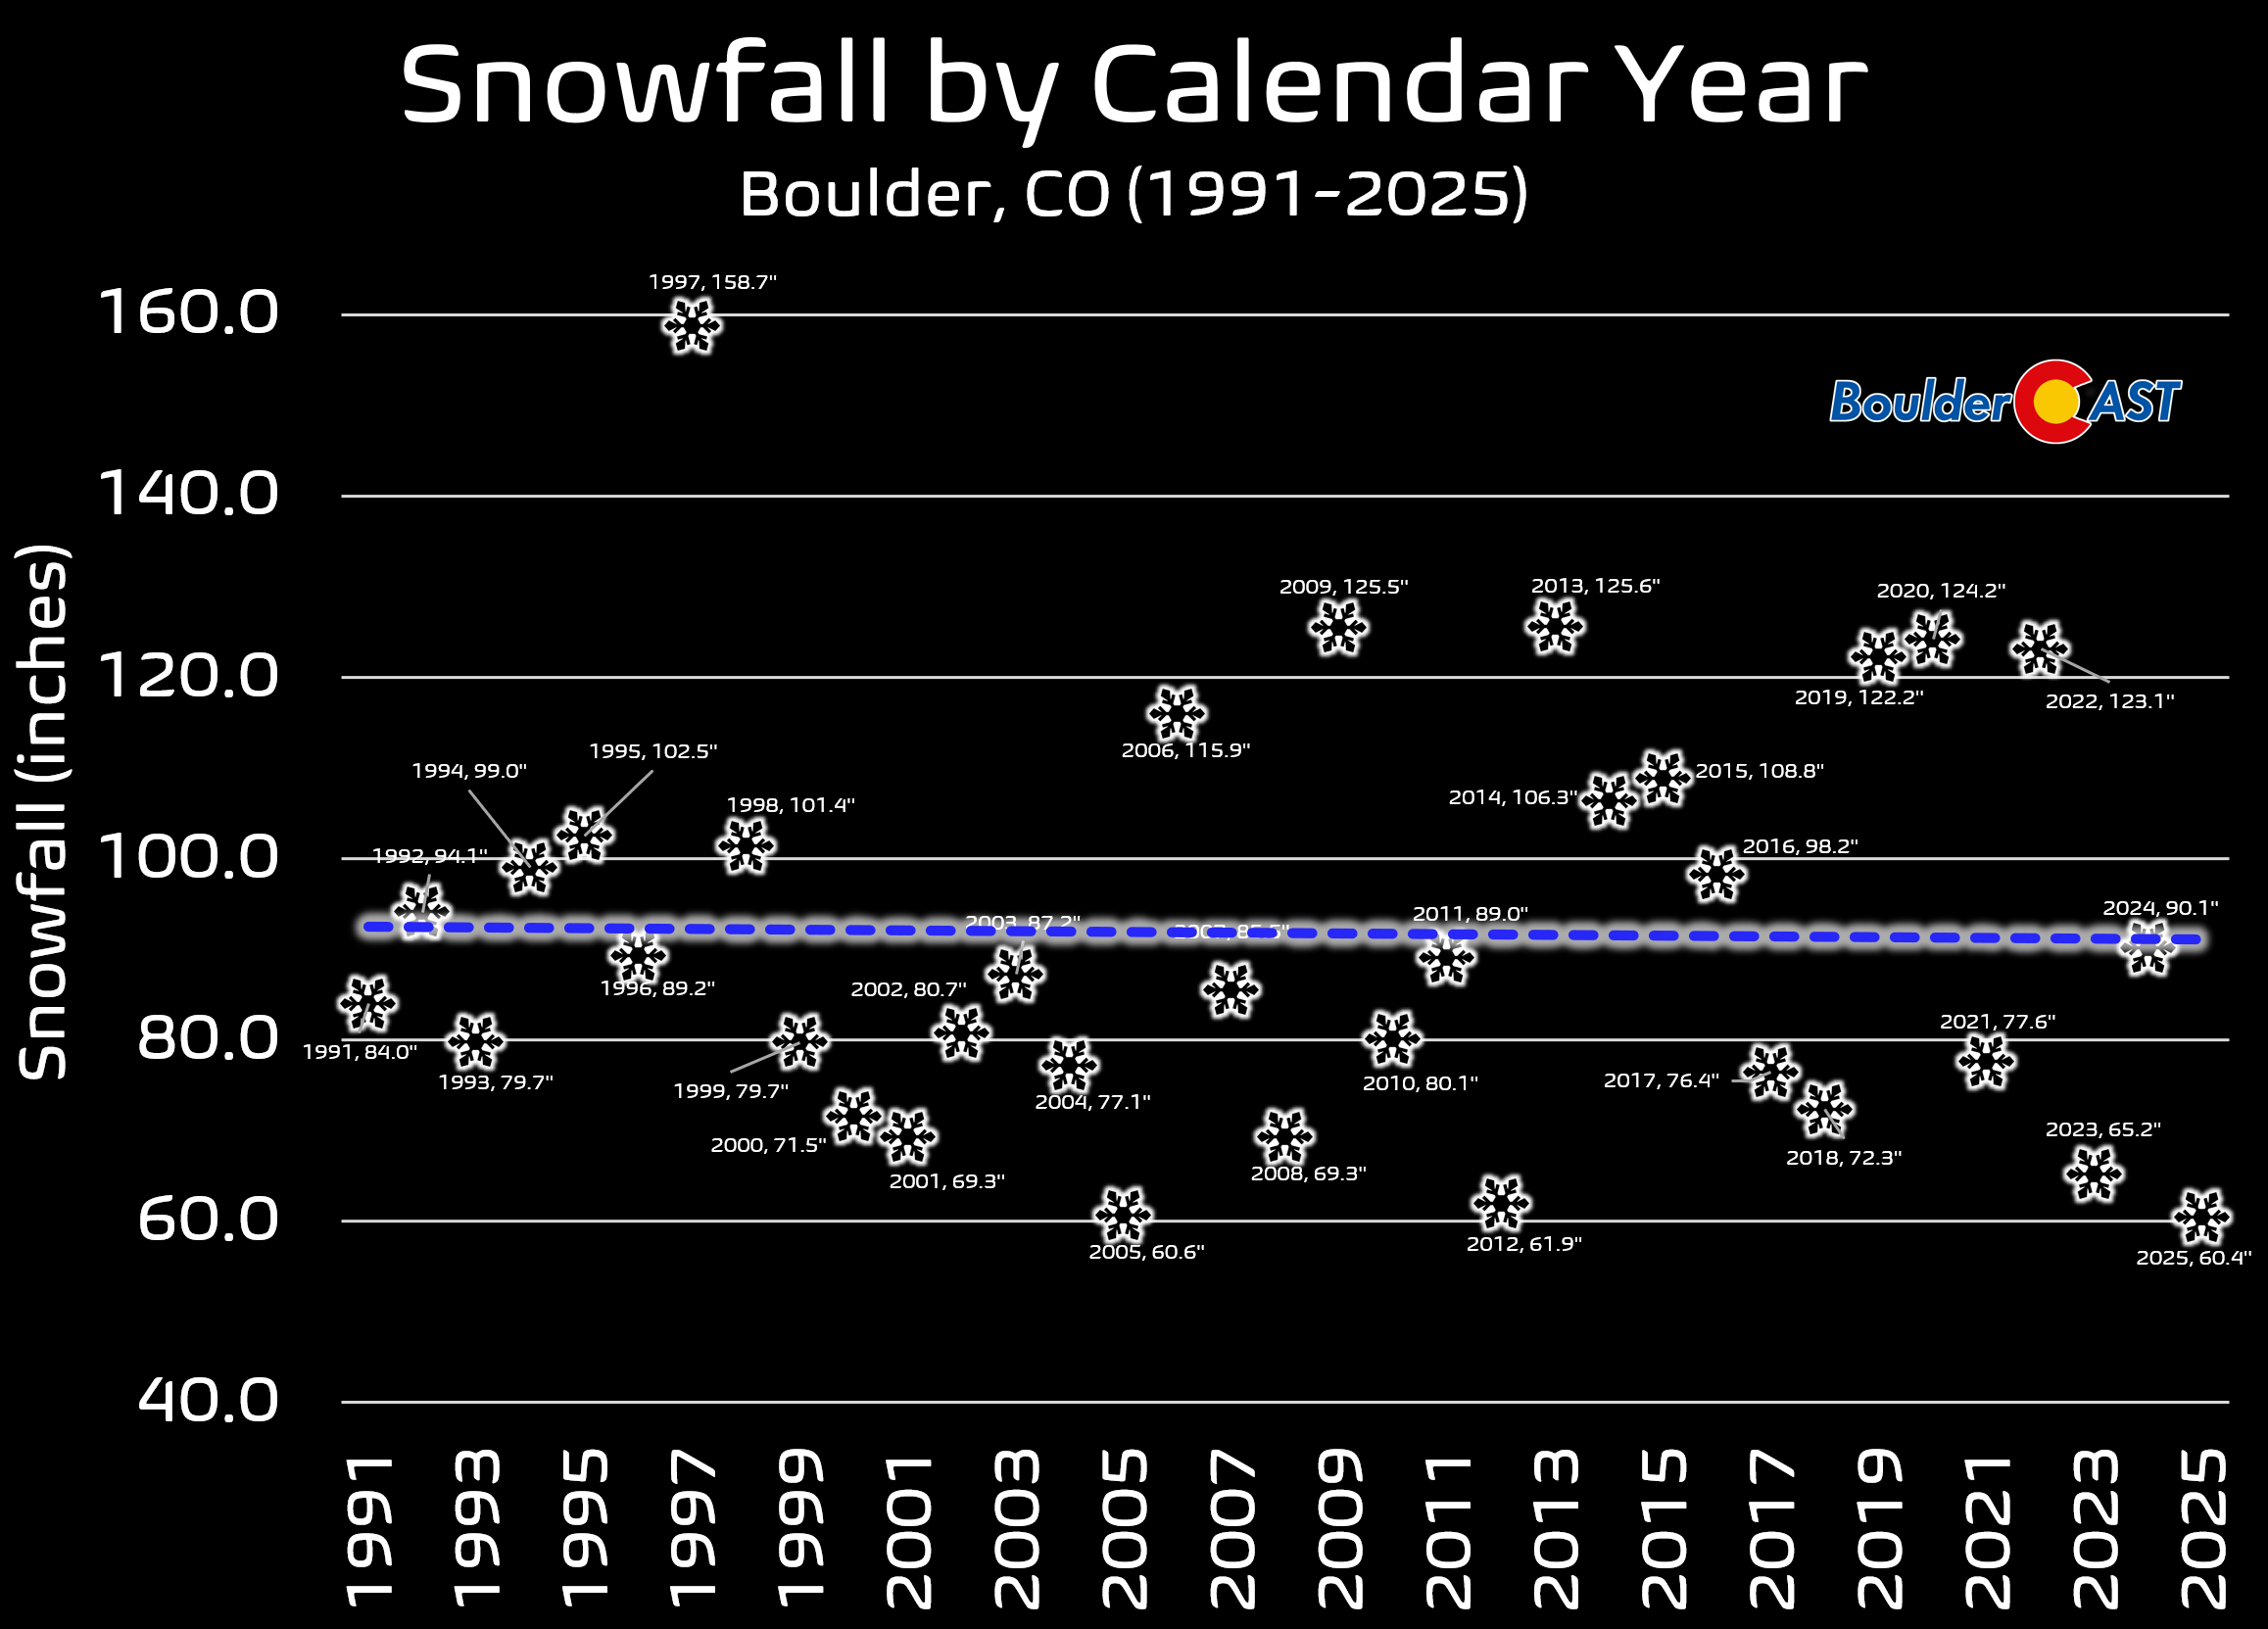
The entire calendar year of 2025 concluded with just 60.4 inches of snow, the lowest amount since 1982 and the 7th lowest all-time since daily snowfall observations began in 1948. Though there is a long-term upward trend in snow noted in Boulder climate record, this is once again likely a result of Boulder’s transient climate station.
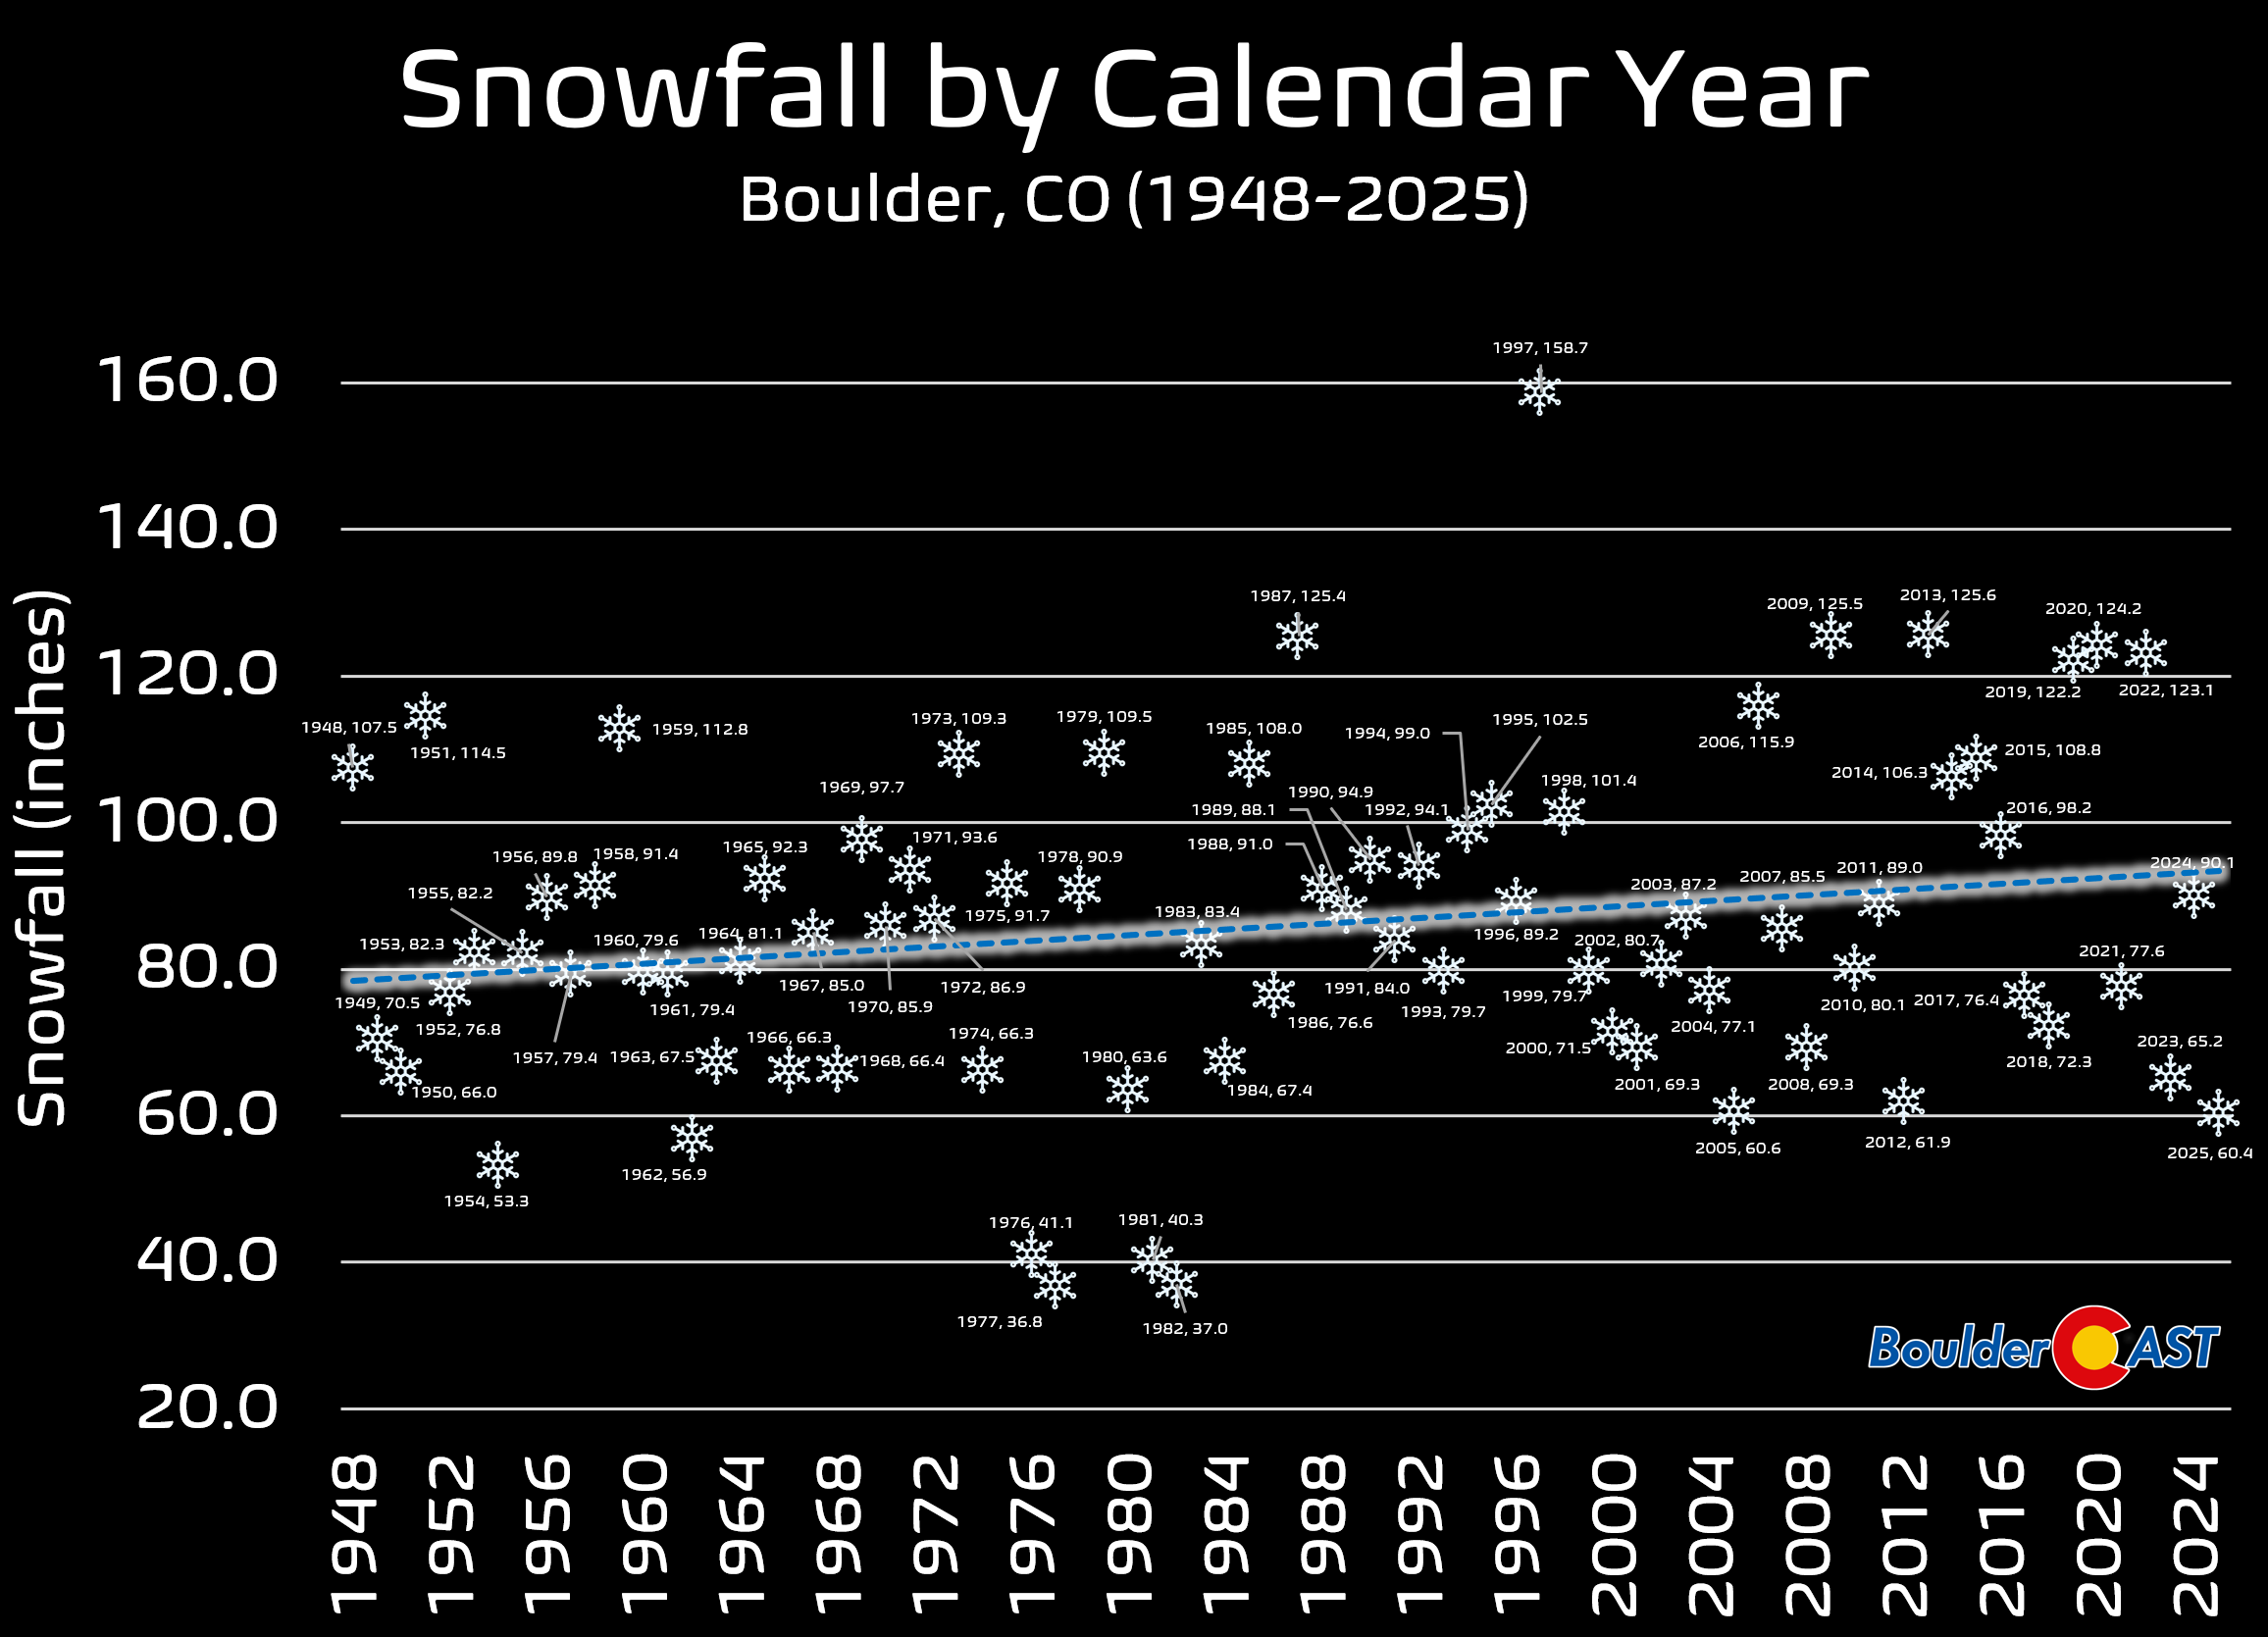
Long‑term snow trends are muddied by Boulder’s shifting climate station locations, but focusing solely on the NIST era (1991–present) reveals a slight — though not statistically significant — downward trend. More than anything, our snow totals have become more variable than they were back in the 1990s.
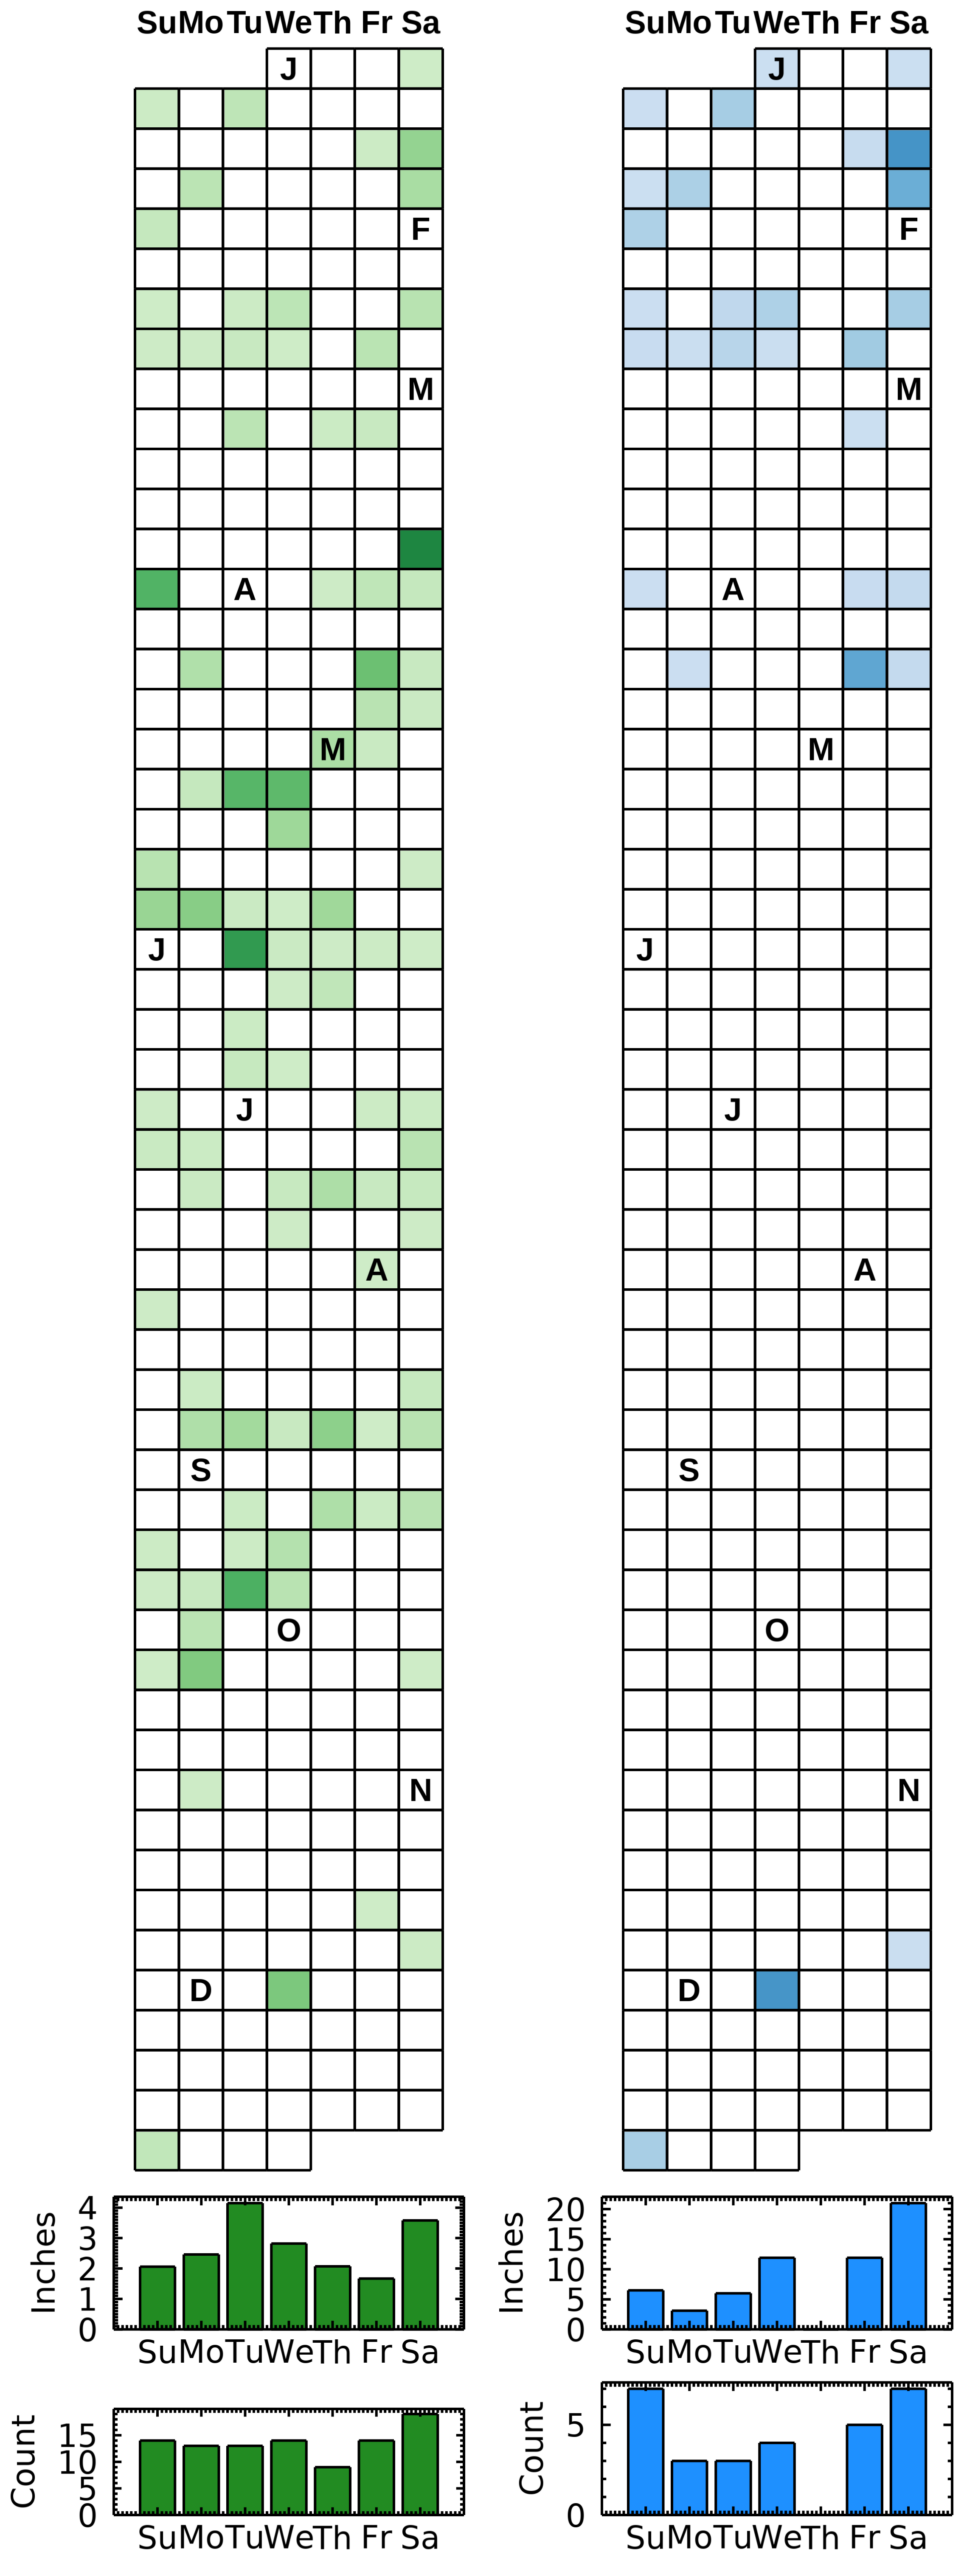
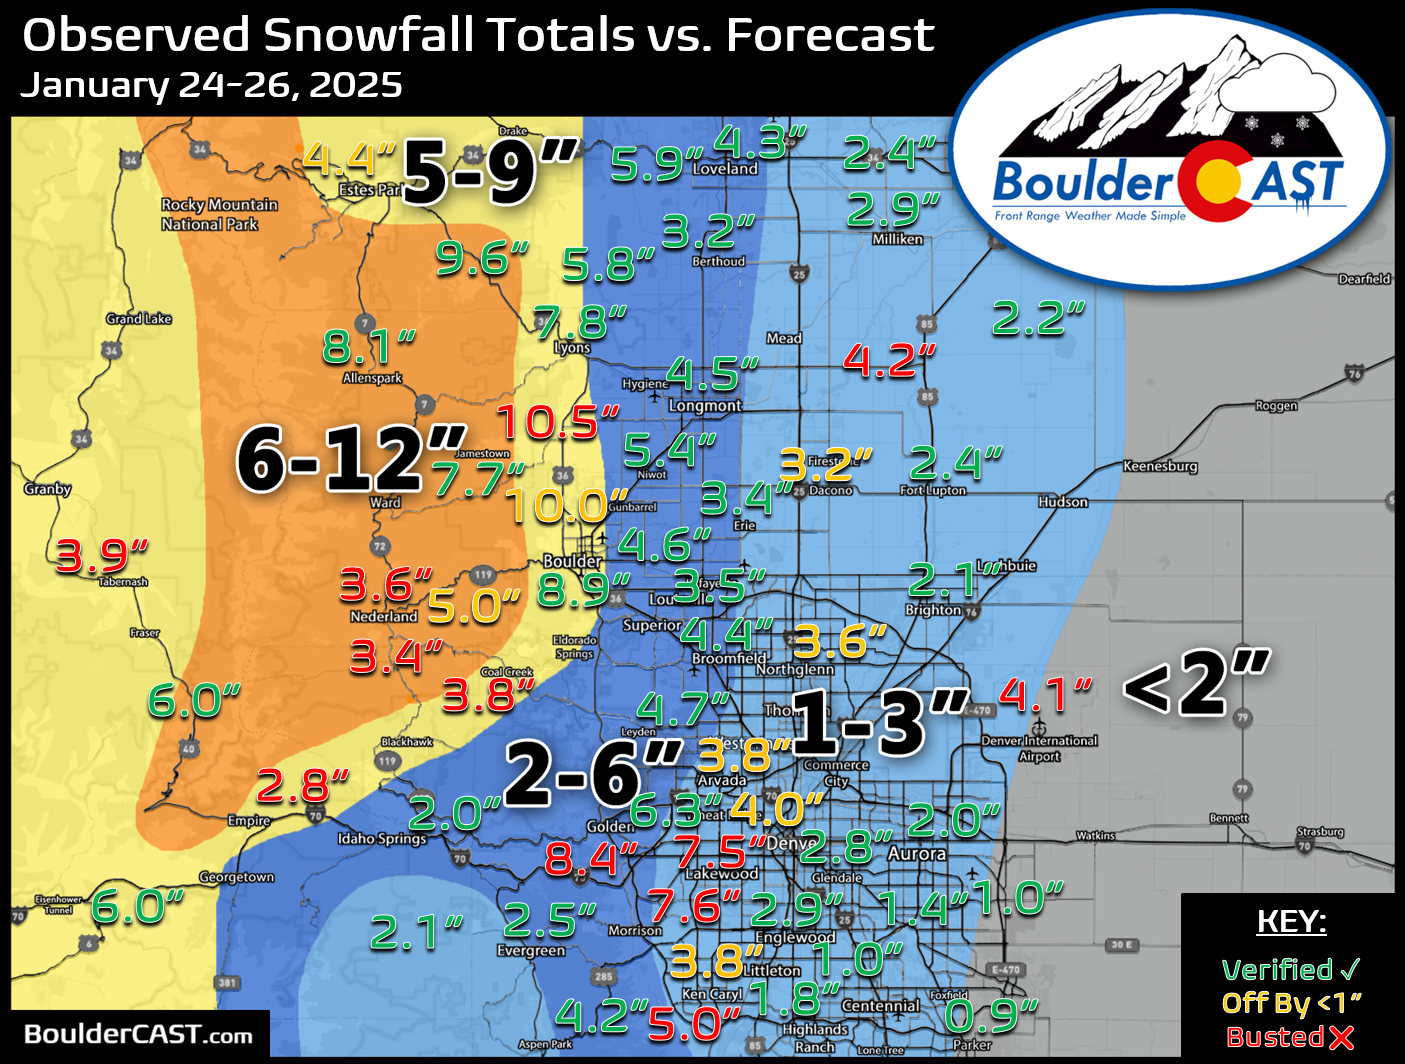
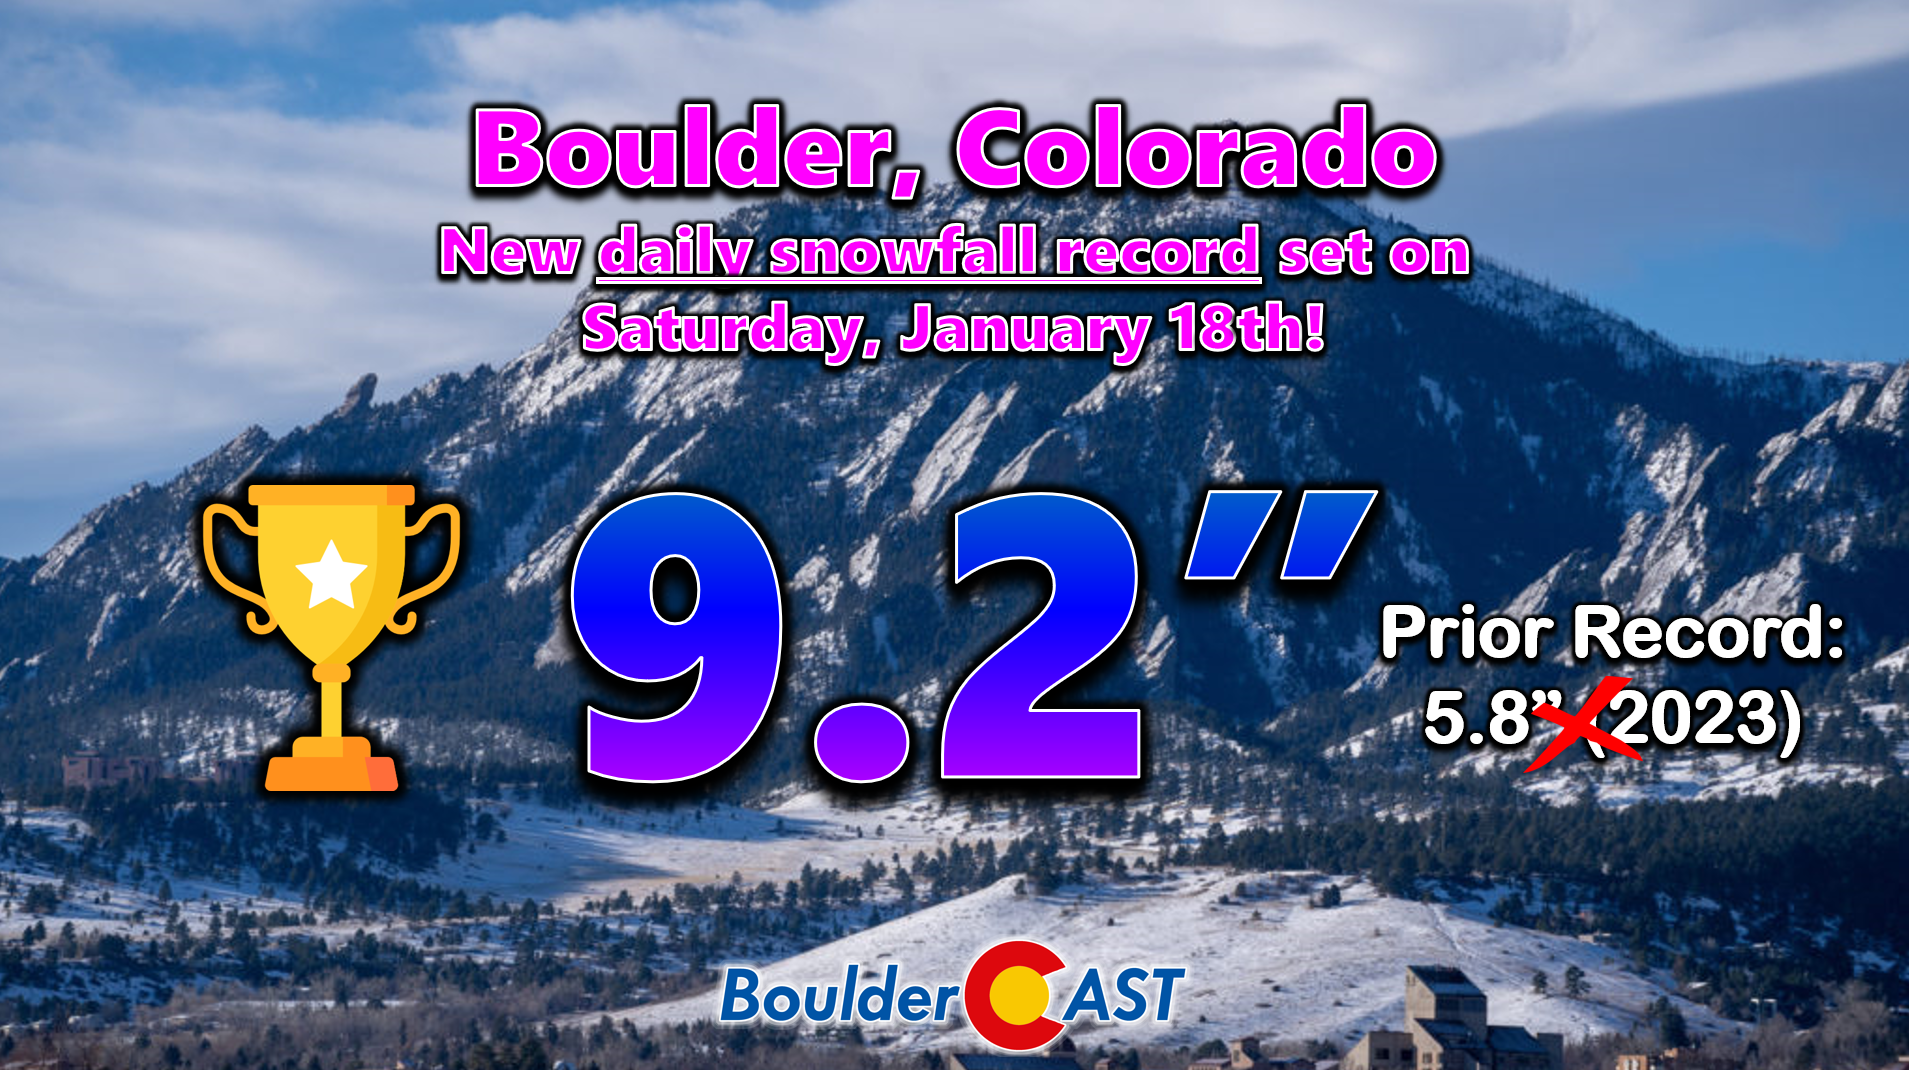
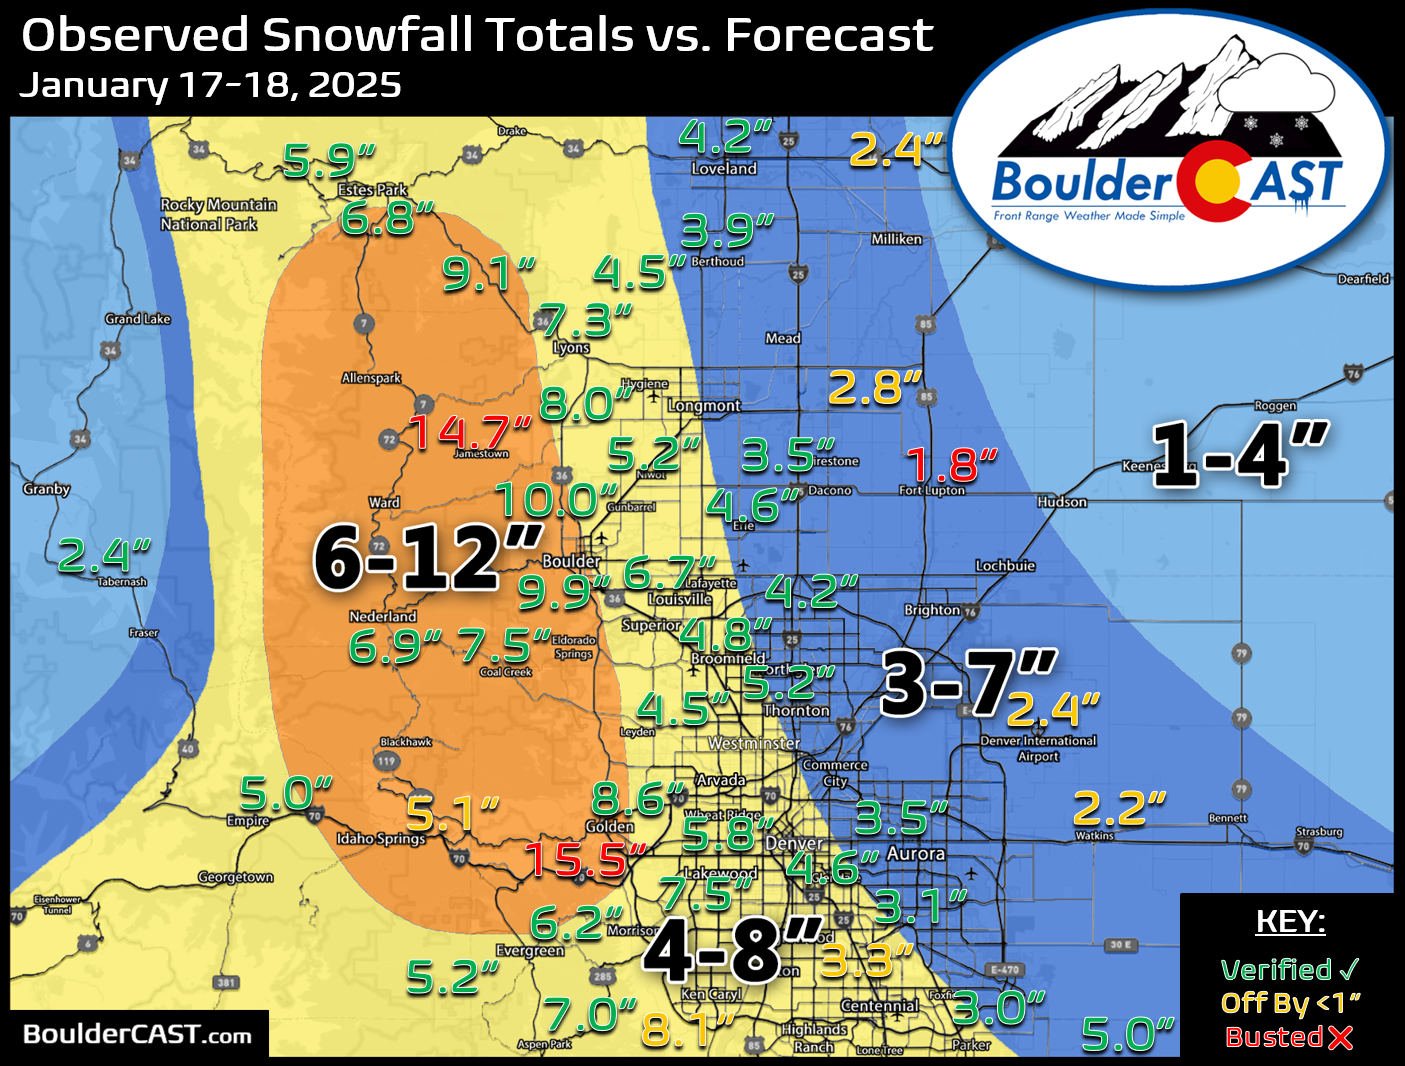
Fun fact(s): Saturday was the snowiest day of the week in 2025, recording more than double the amount of snow than any other day. This was mostly due to two snowstorms on back-to-back Saturdays in January (18th and 25th). Interestingly no snow at all was recorded on Thursdays! Precipitation (rain and snow) was more evenly distributed across days of the week.
Precipitation & Snow by Day of Week – Boulder, CO – 2025
Watches, Warnings, Advisories, Oh My!
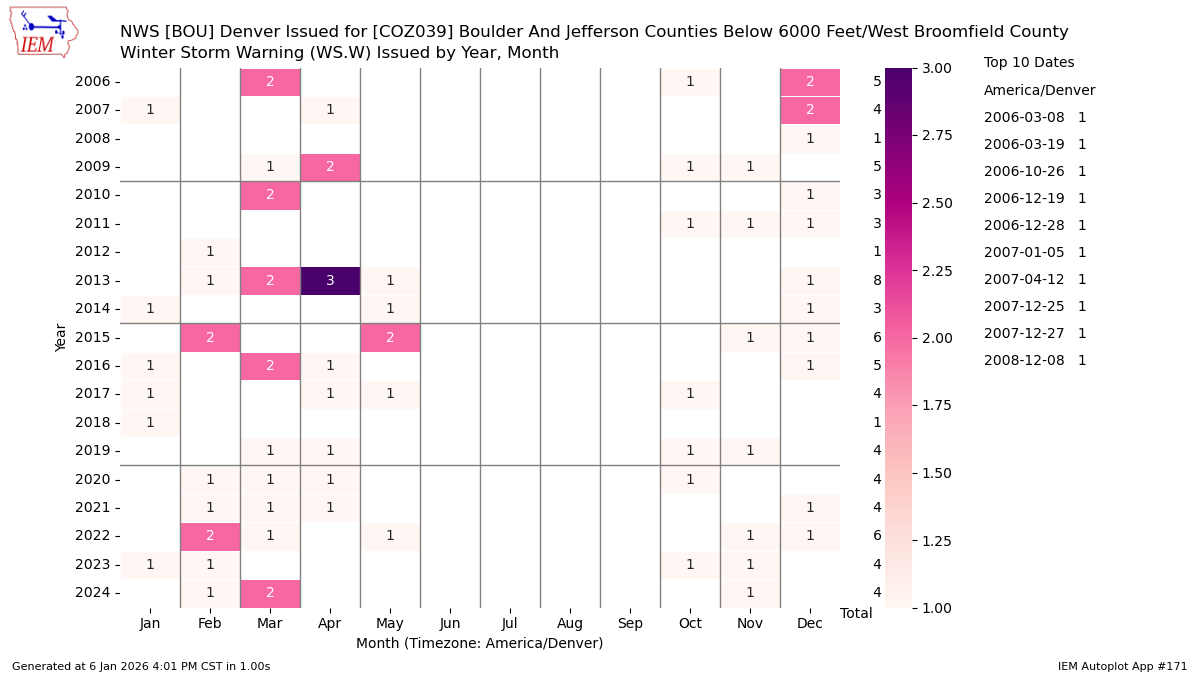
It may not come as a huge shock, but Boulder didn’t see a single Winter Storm Warning in 2025. Not one. According to the Iowa Mesonet database (which powers all the charts in this section), this is the first year since at least 2006 that Boulder went warning‑free. Data before 2006 is not available, so perhaps this is a first!
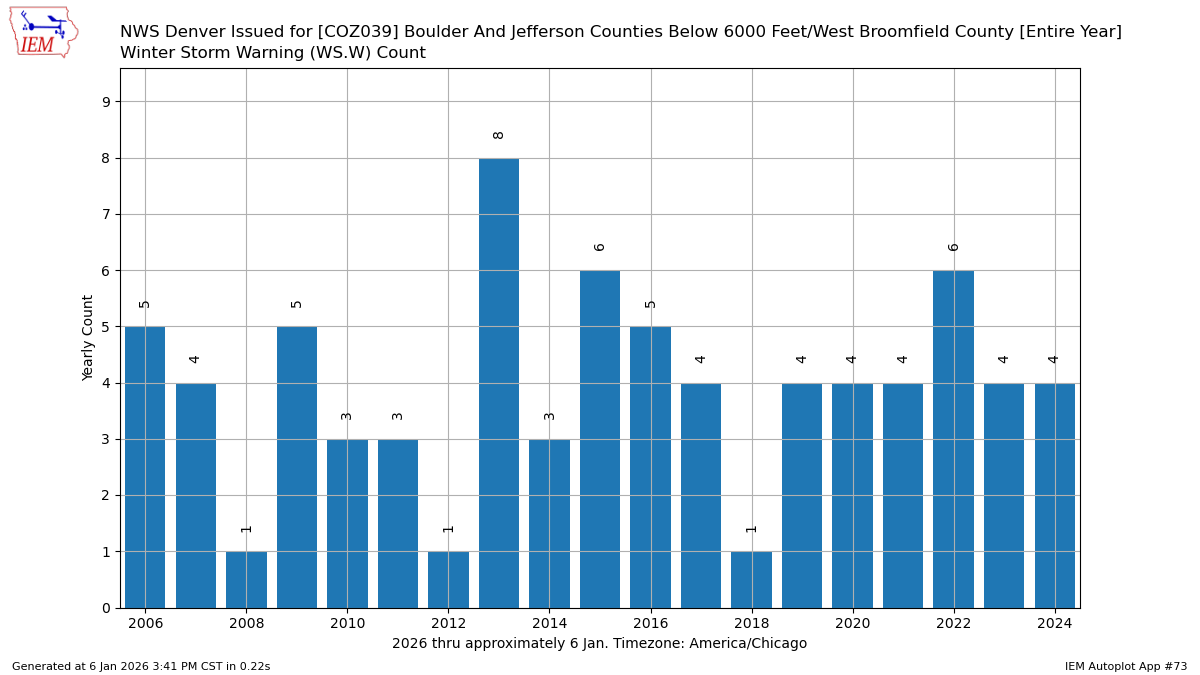
The last Winter Storm Warning to paint Boulder pink was in November 2024, ironically for a snowstorm that Boulder shouldn’t have been under a warning for…
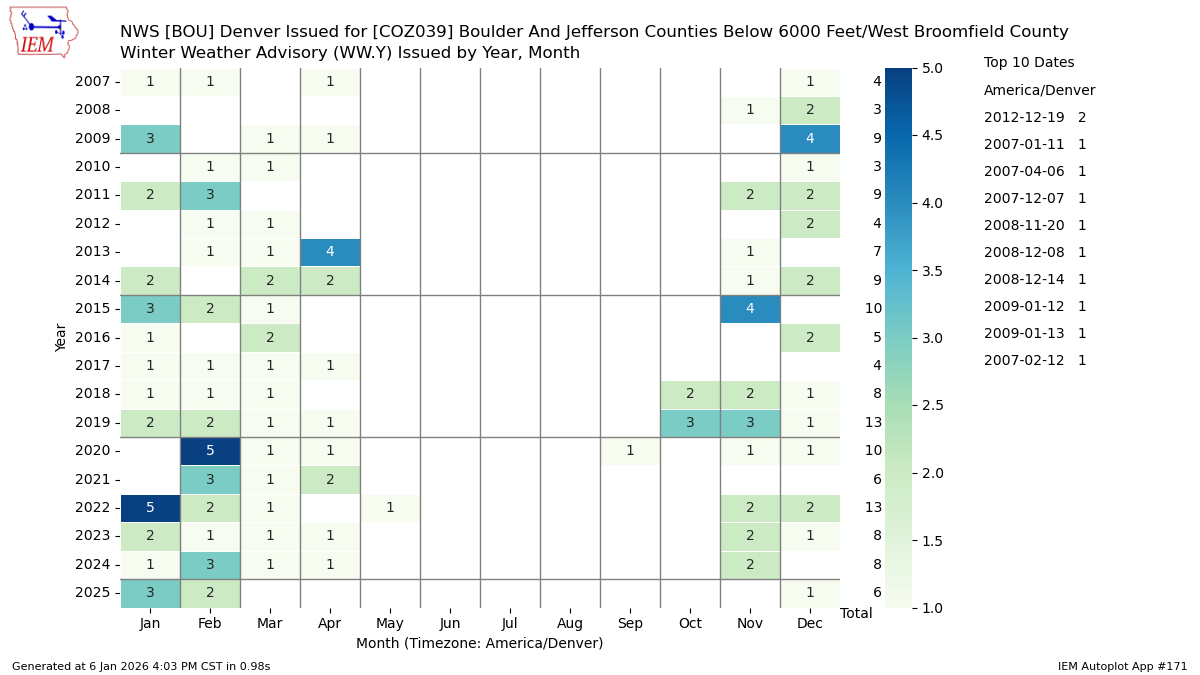
Winter Weather Advisories, on the other hand, were alive and well. Boulder picked up six of those in 2025, mostly tied to our smaller, quick‑hitting snow events.
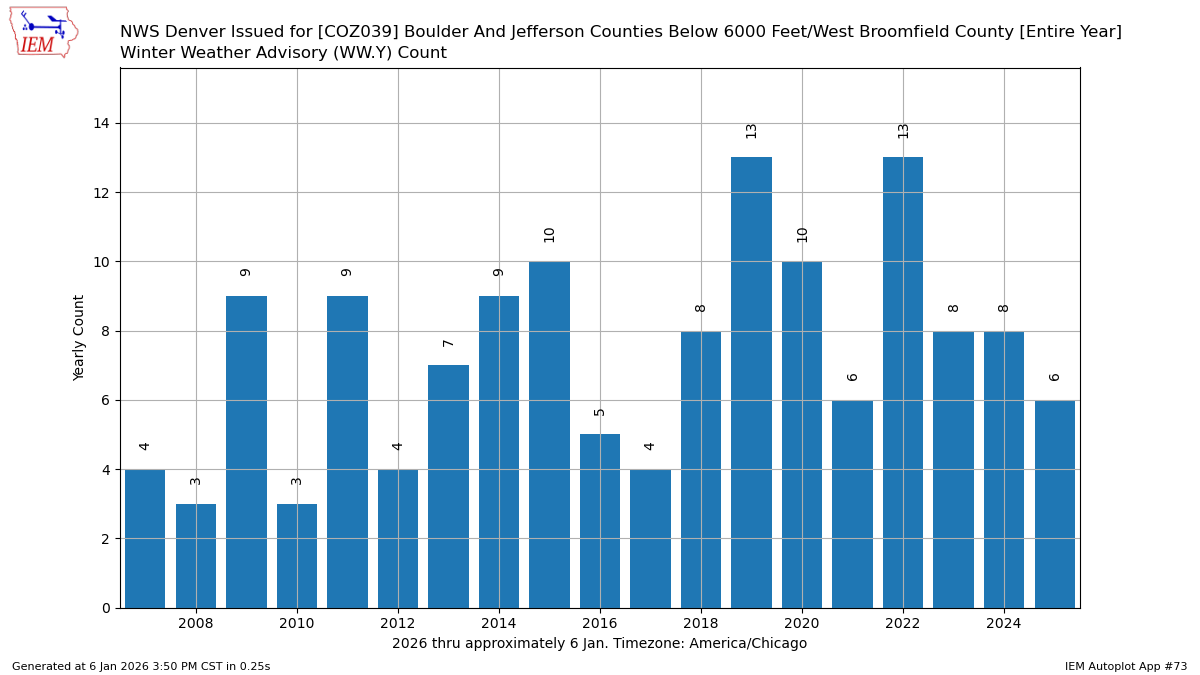
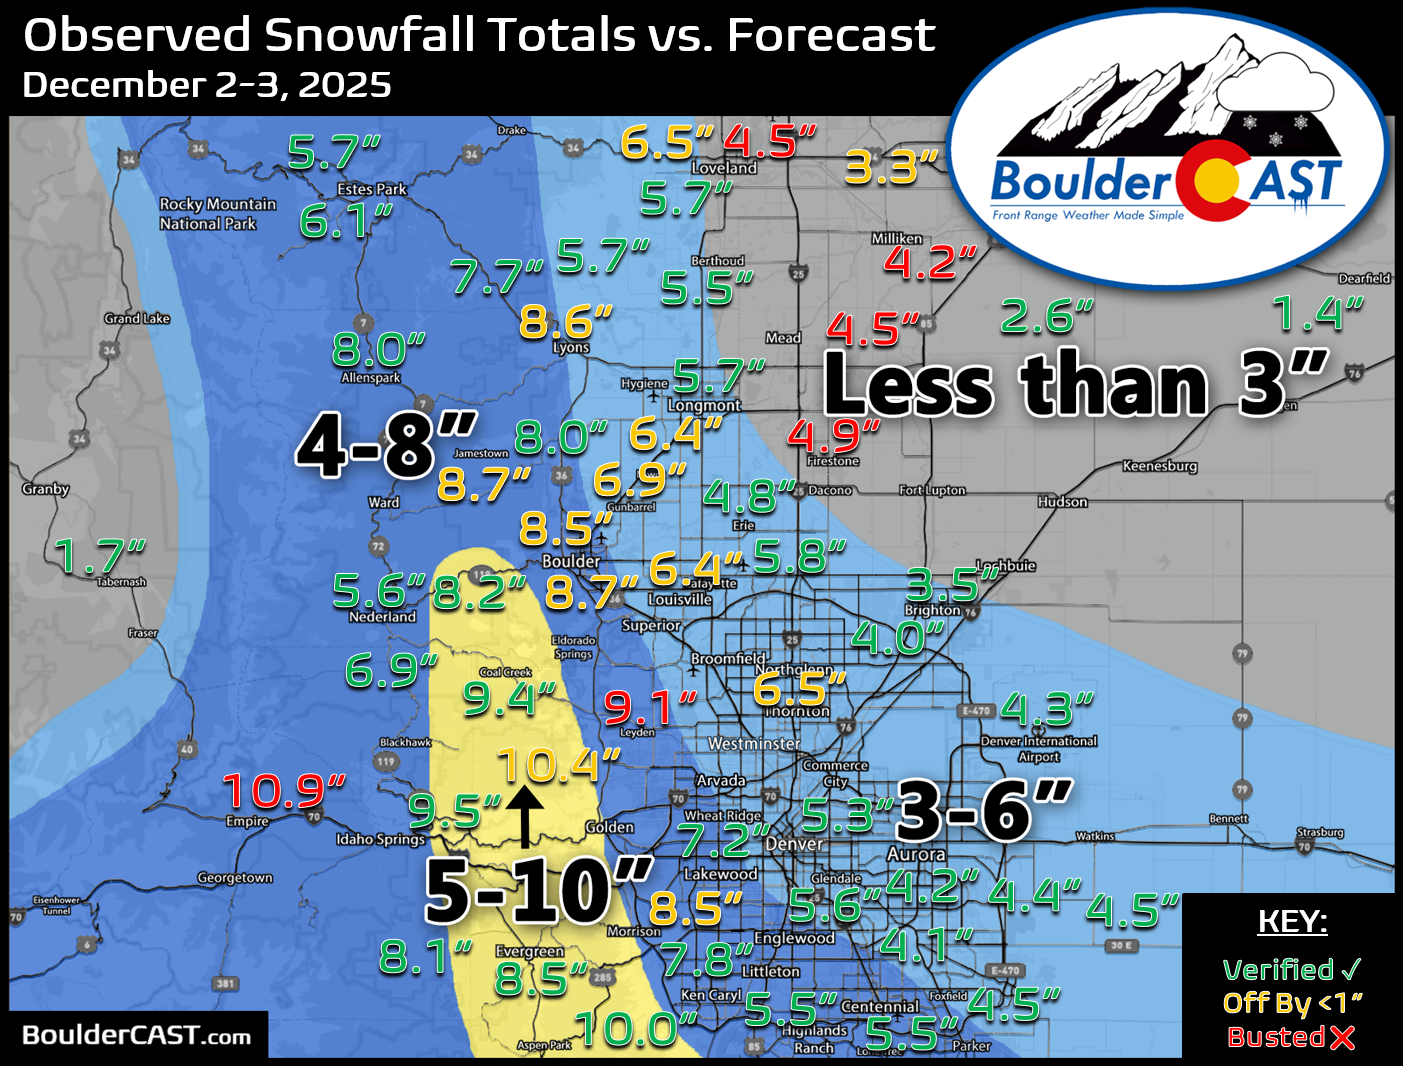
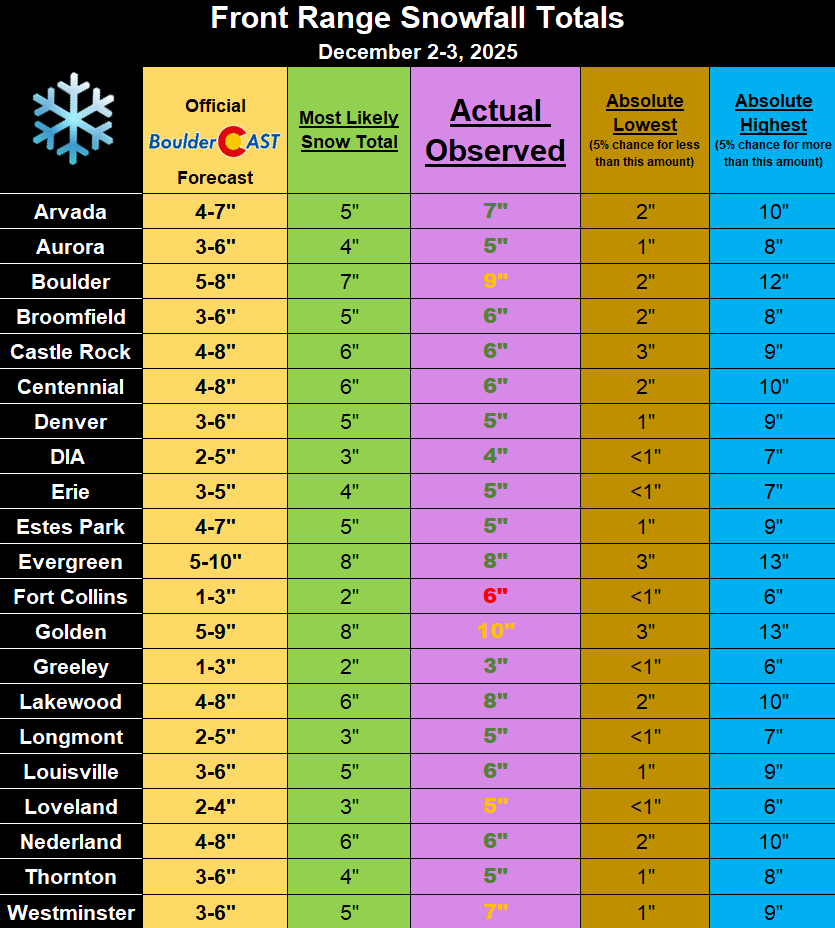
The most recent came with our early‑December storm that dropped a respectable 9 inches across town.
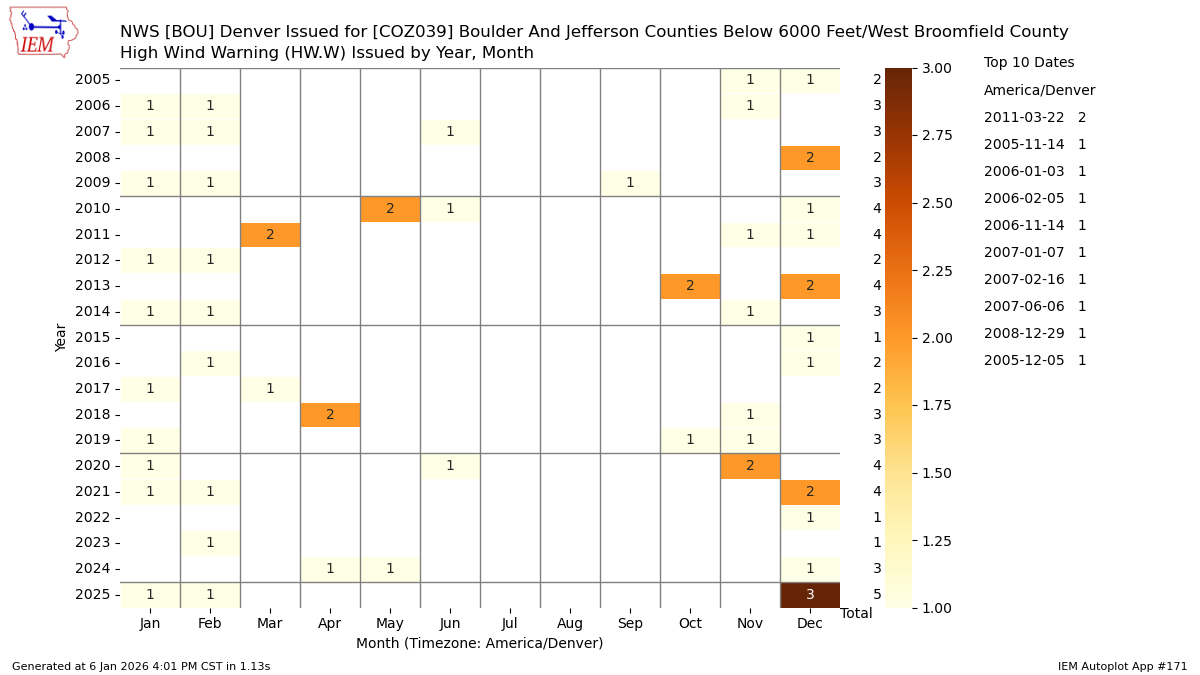
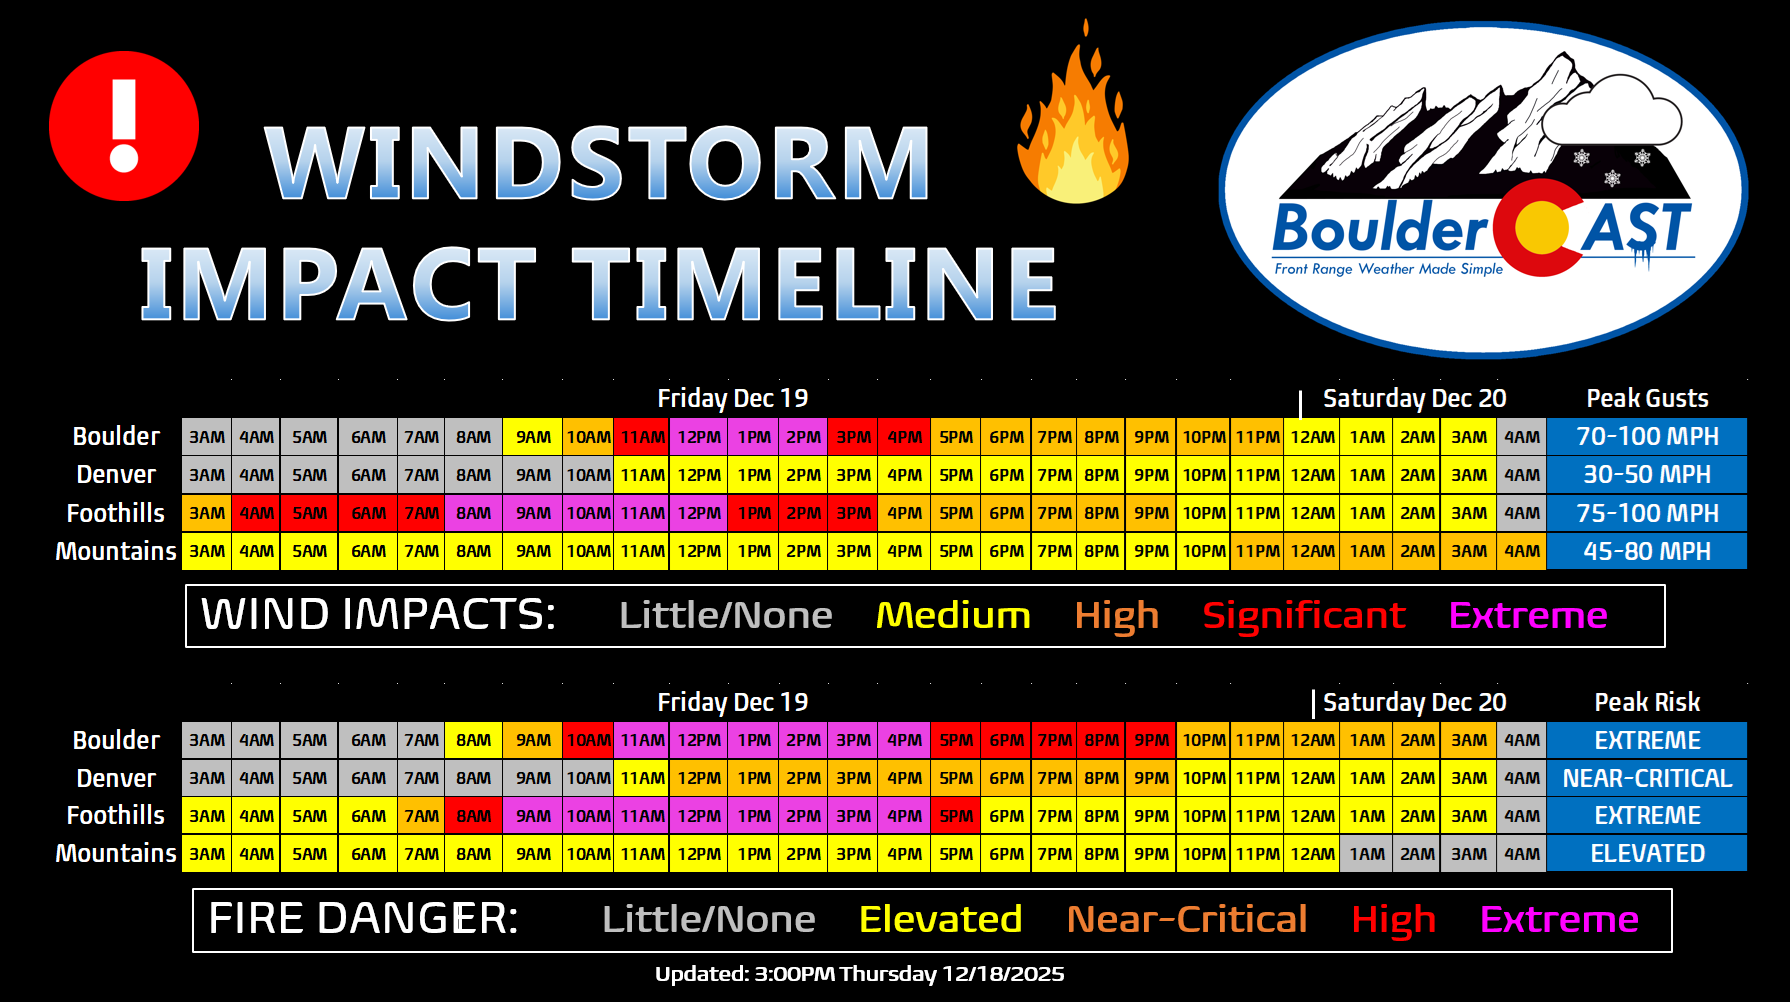
Wind, of course, was a very different story. Five High Wind Warnings were issued for Boulder in 2025, a new record in the 20-year Mesonet dataset.
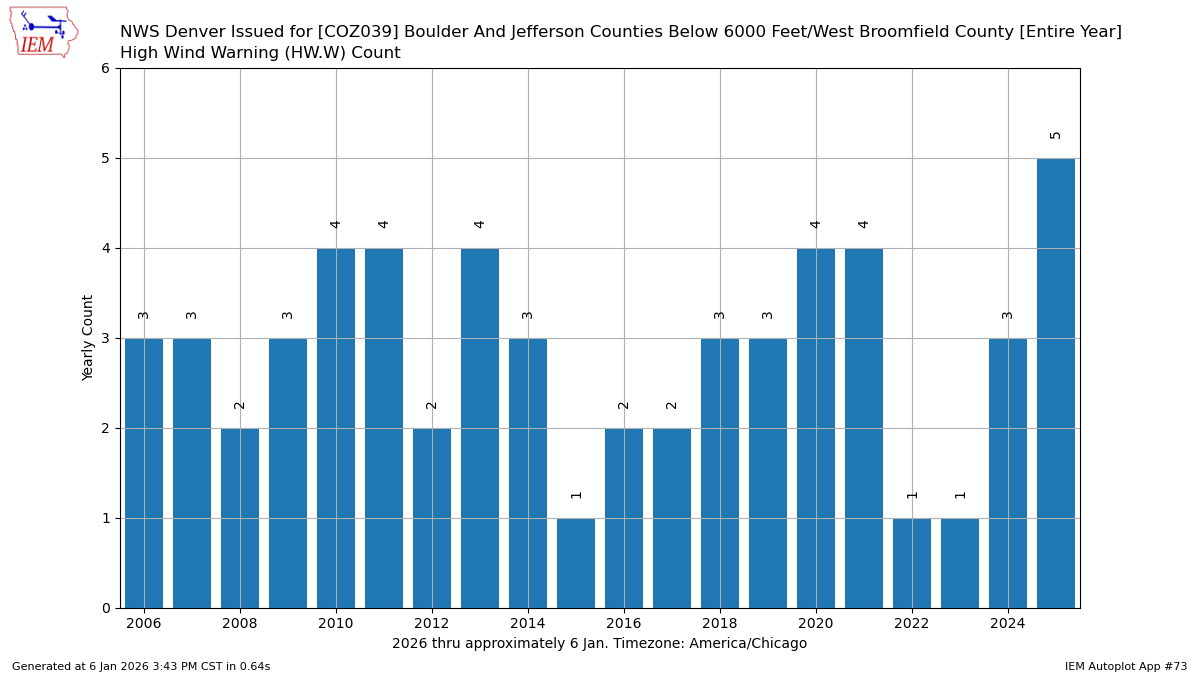
There were three in December alone. Two of those were for the intense mid‑month mountain‑wave events that triggered back‑to‑back Public Safety Power Shutoffs from Xcel — a memorable stretch for all the wrong reasons.
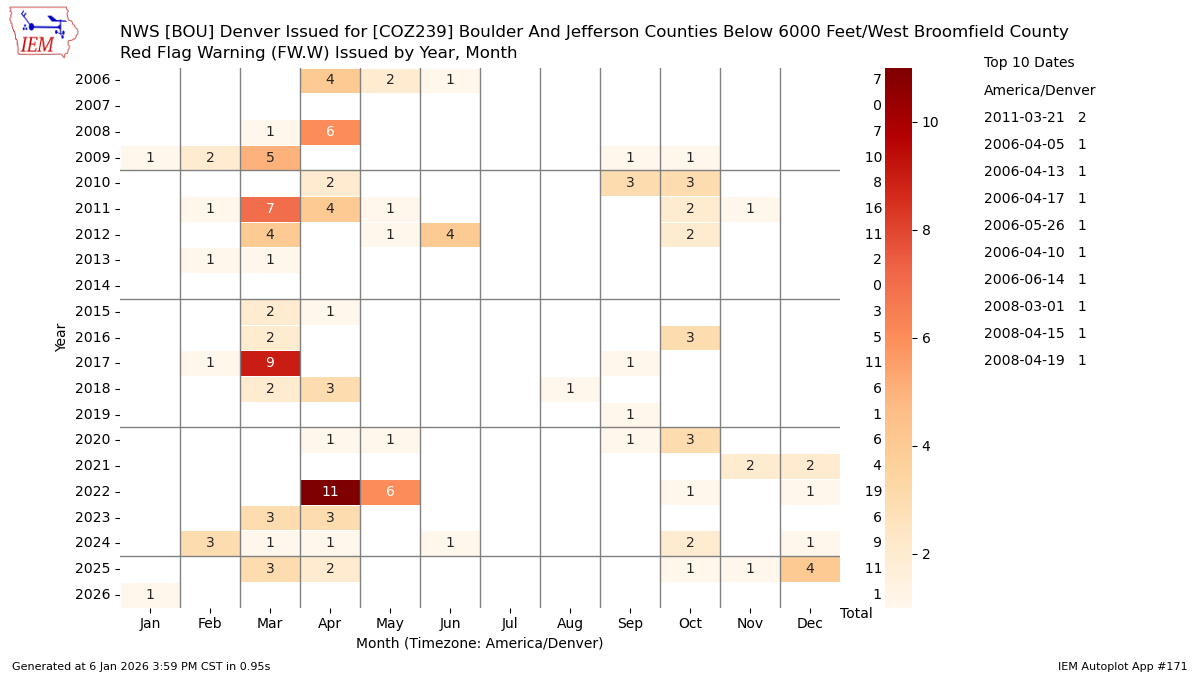
Fire weather also made its presence known. Boulder logged 11 Red Flag Warnings in 2025 (plus one already in early 2026), above average but still far from the record‑setting 19 days in 2022.
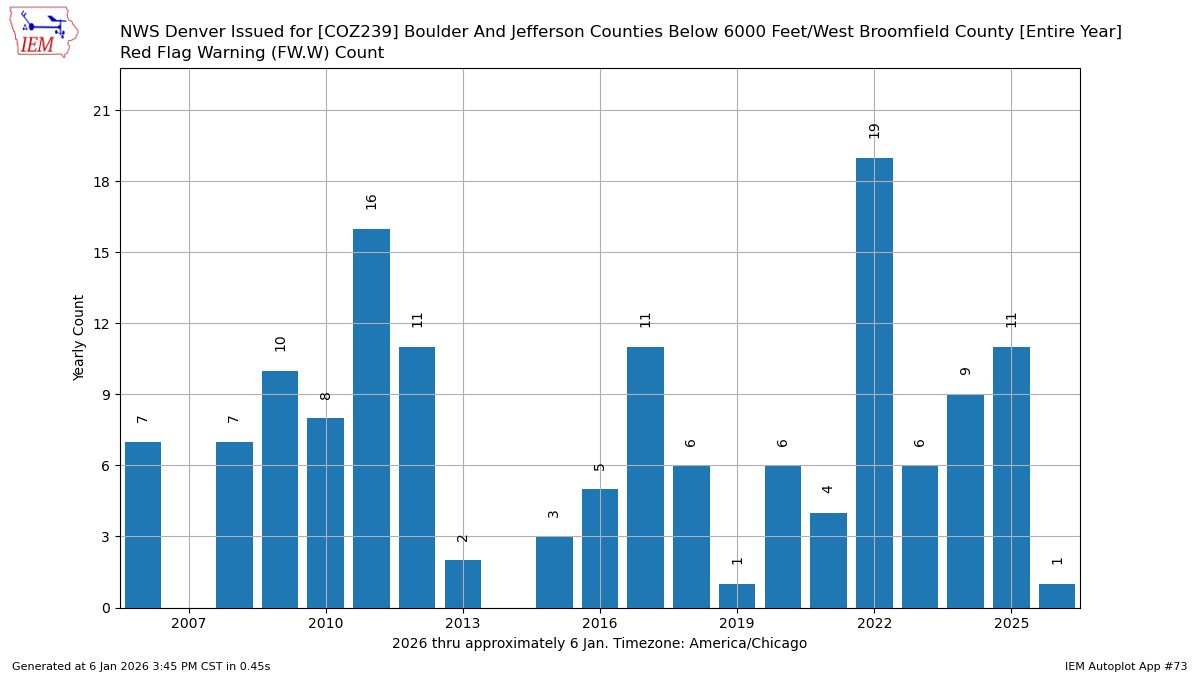
Most of last year’s Red Flag days clustered in December (4), March (3), and April (2). And yes — April 2022’s staggering 11 Red Flag days still stands out as a stark reminder of how primed our landscape was before and after the Marshall Fire.
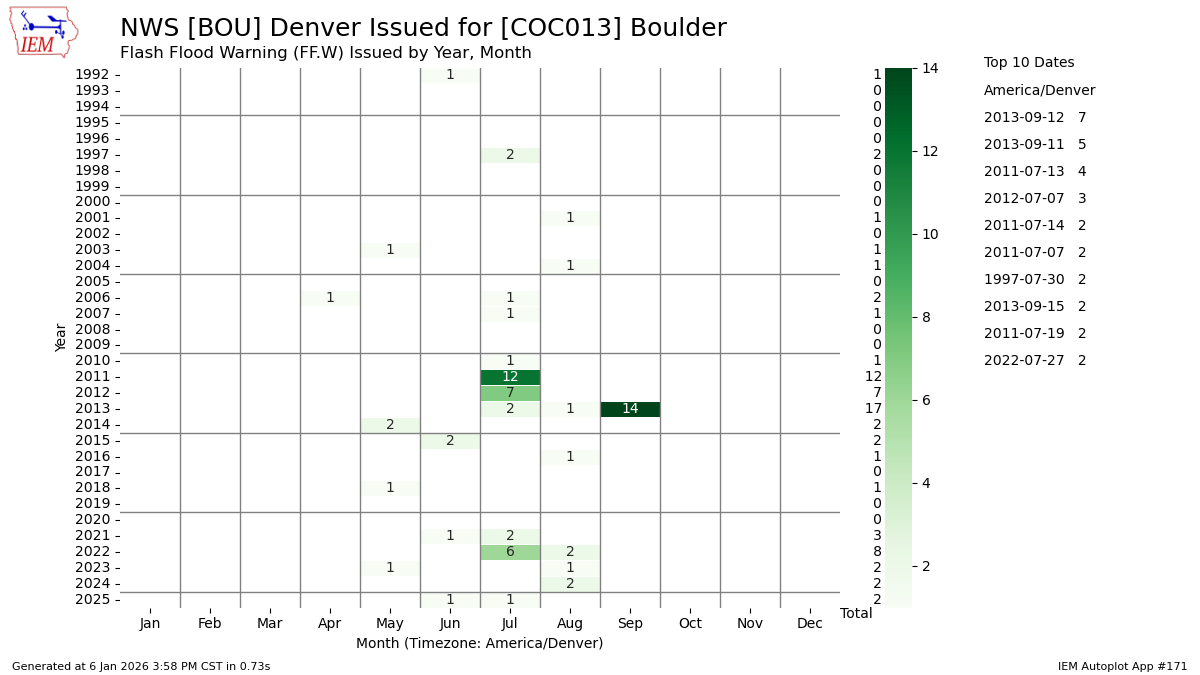
Flash flooding stayed relatively quiet. Boulder County saw two Flash Flood Warnings in 2025, a perfectly typical number outside of extraordinary years.
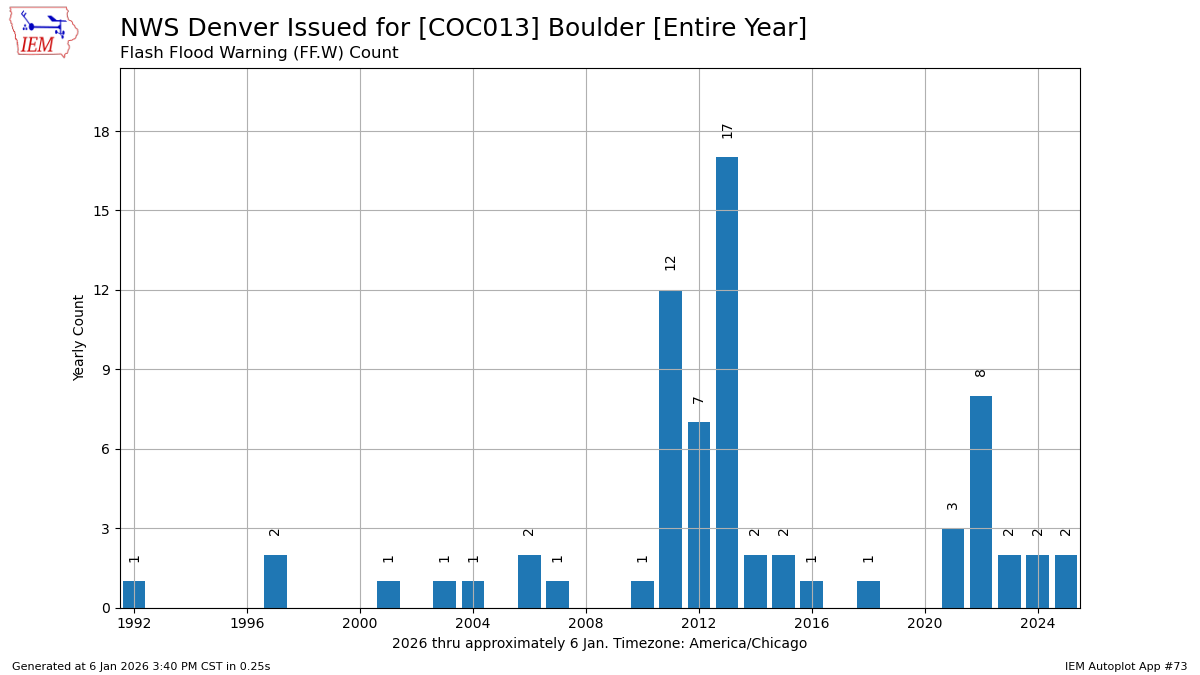
We all know why 2013 had 17 warnings issued, or at least we should, but what about the 12 warnings issued in 2011? We’re not 100% sure, but these are likely the result of monsoon thunderstorms forming over the recent Fourmile Canyon Burn Scar which torched more than 6,000 acres just west of Boulder in the summer of 2010. Nascent burn scars are highly susceptible to flash flooding and the National Weather Service was likely issuing a lot of Warnings the following summer in 2011 for that part of Boulder County.
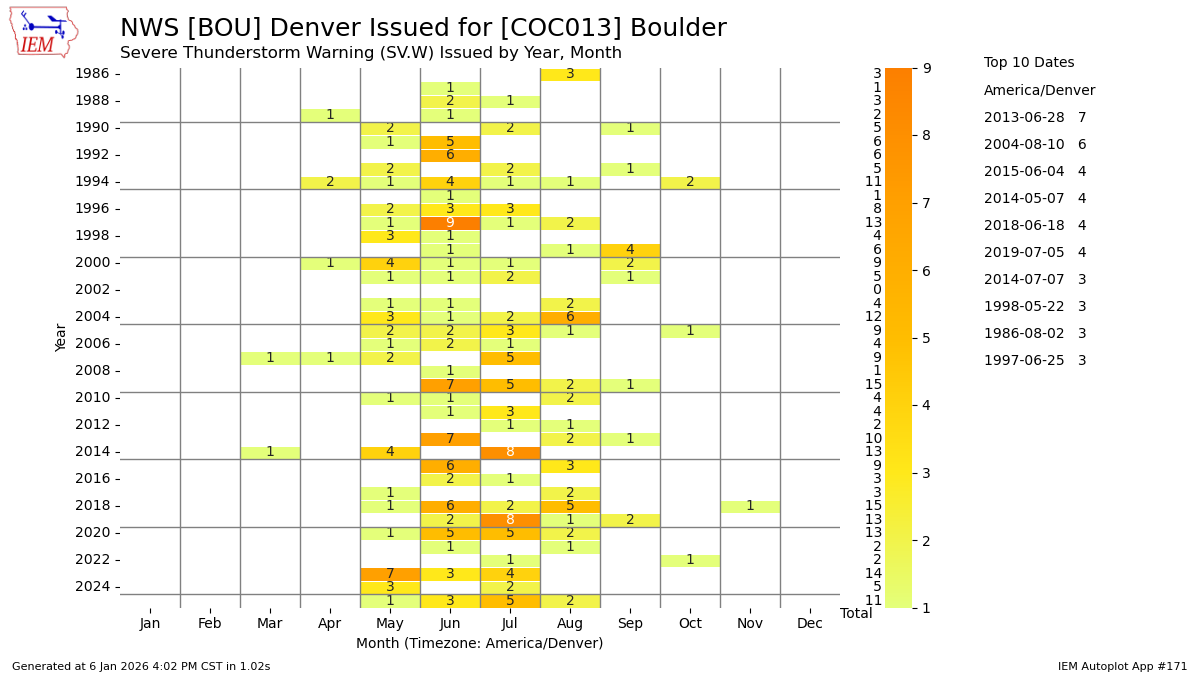
Severe thunderstorms were also near normal. Boulder County picked up 11 Severe Thunderstorm Warnings in 2025, mostly during the usual May–August peak in severe weather season.
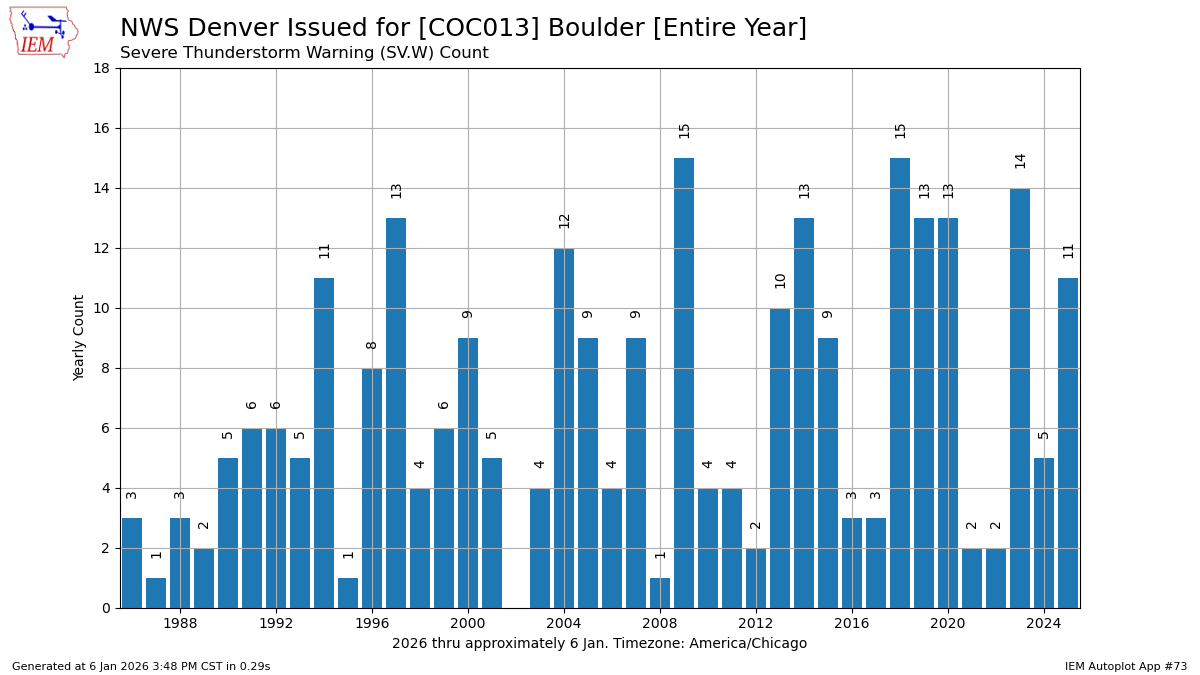
These warnings were concentrated during Colorado’s usual severe weather season of May to August.
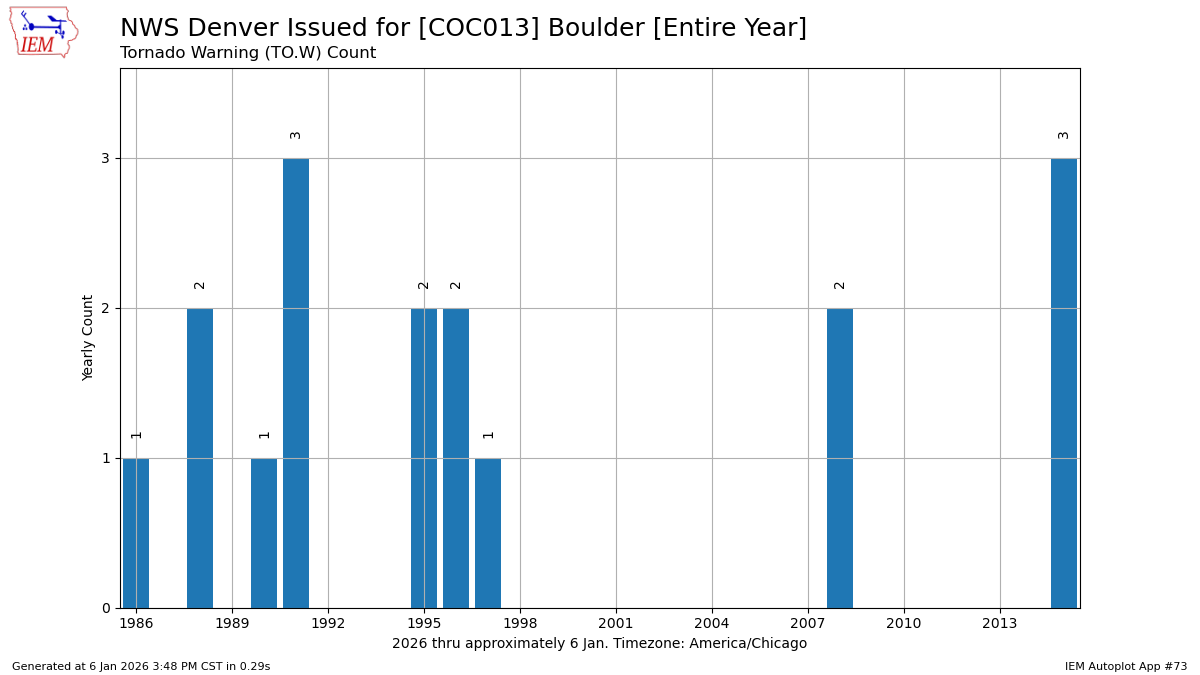
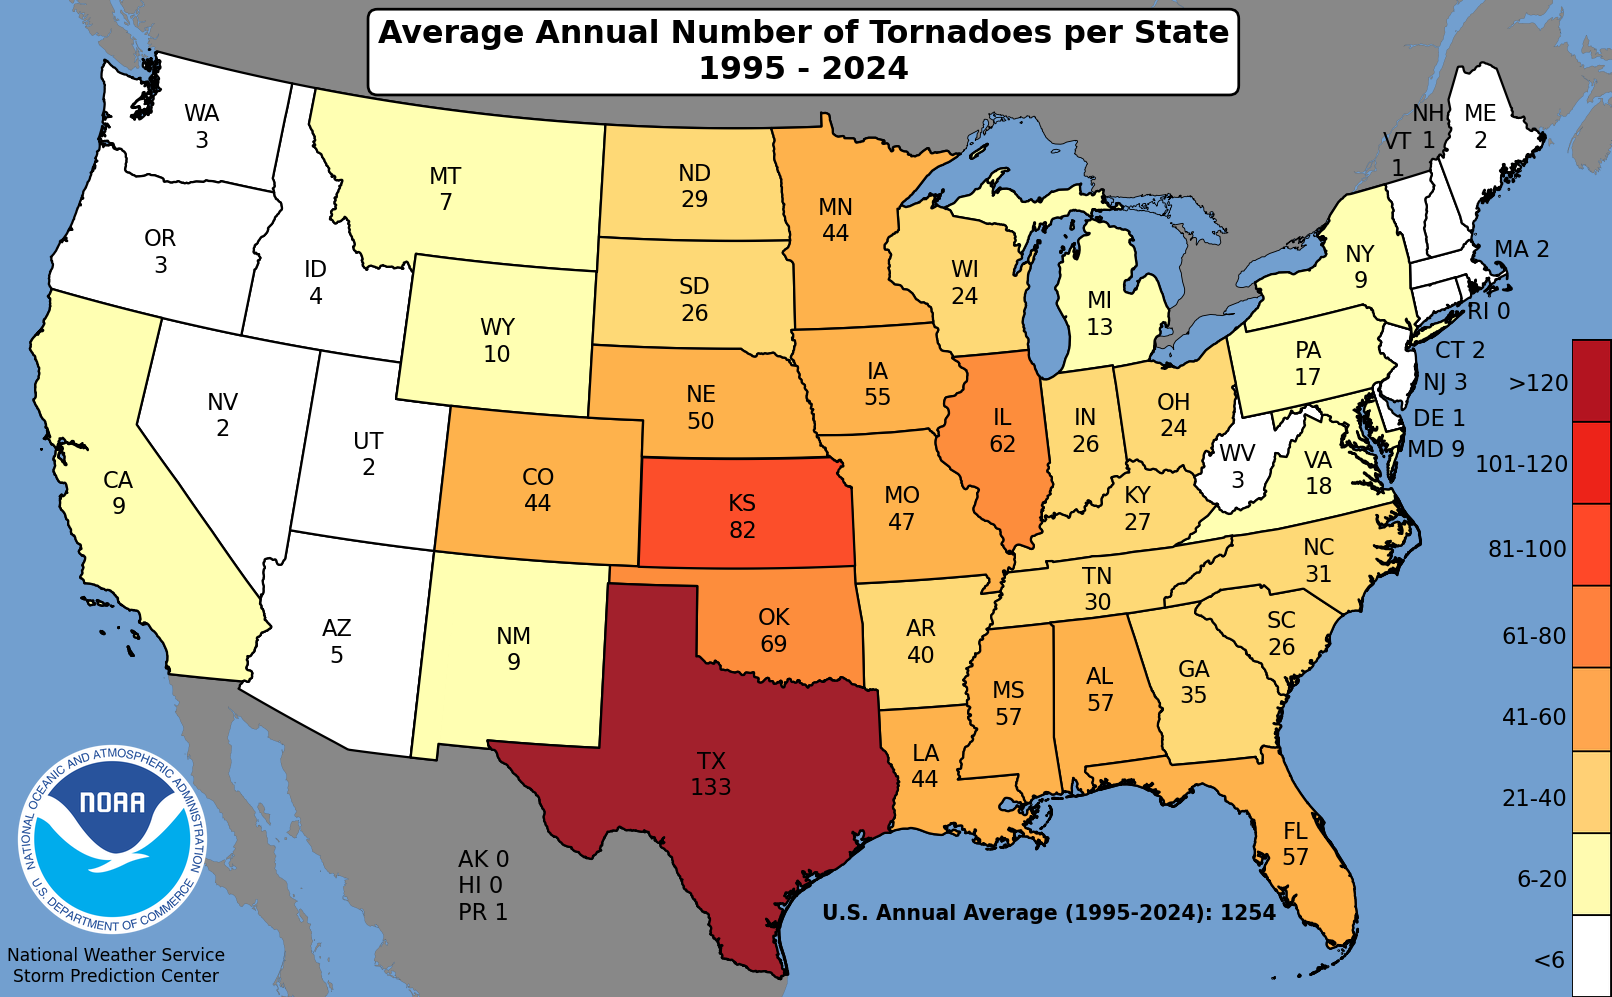
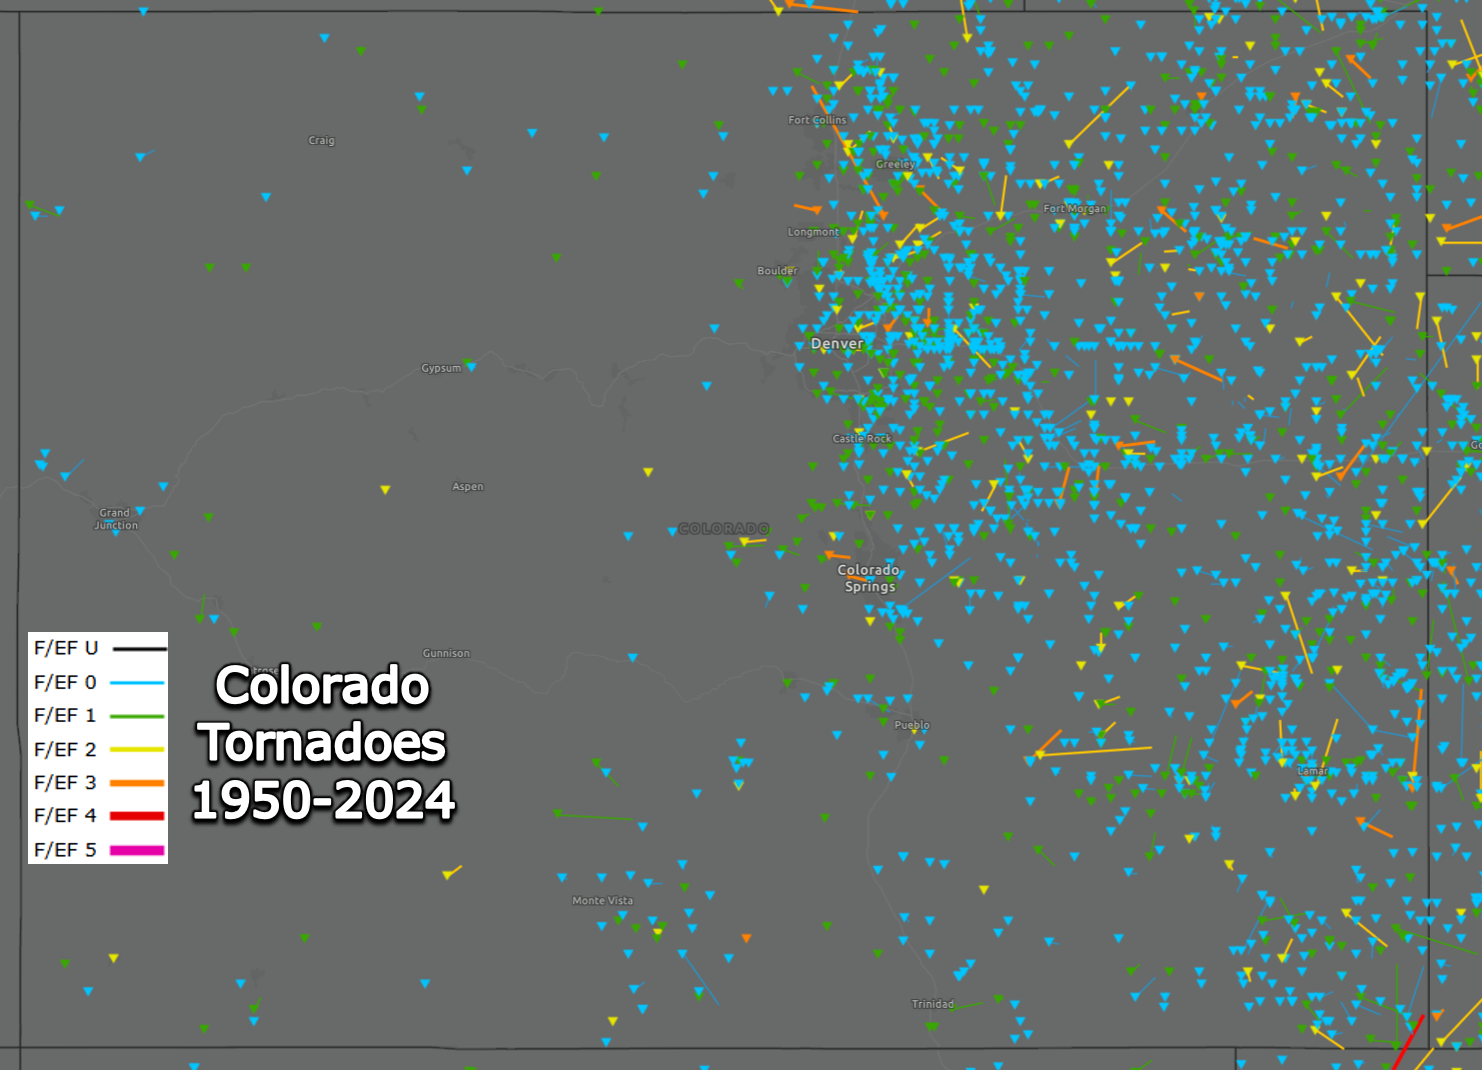
And to end on a rare piece of calm weather news: Boulder County has now gone 10 straight calendar years without a Tornado Warning. The last one was issued for the unusual west‑tracking EF3 tornado north of Longmont back in June 2015. Despite the lack of exciting local supercell dynamics and forecasting opportunities, it’s been a full decade without a tornado warning in Boulder County — we’ll take the win.
Another wild year of Boulder weather in the books
Finally, let’s “circle” back to temperatures. The dramatic contrast between the frigid start to 2025 and the toasty finish becomes even more striking in the temperature visual below. It’s a perfect snapshot of a year defined by extremes.
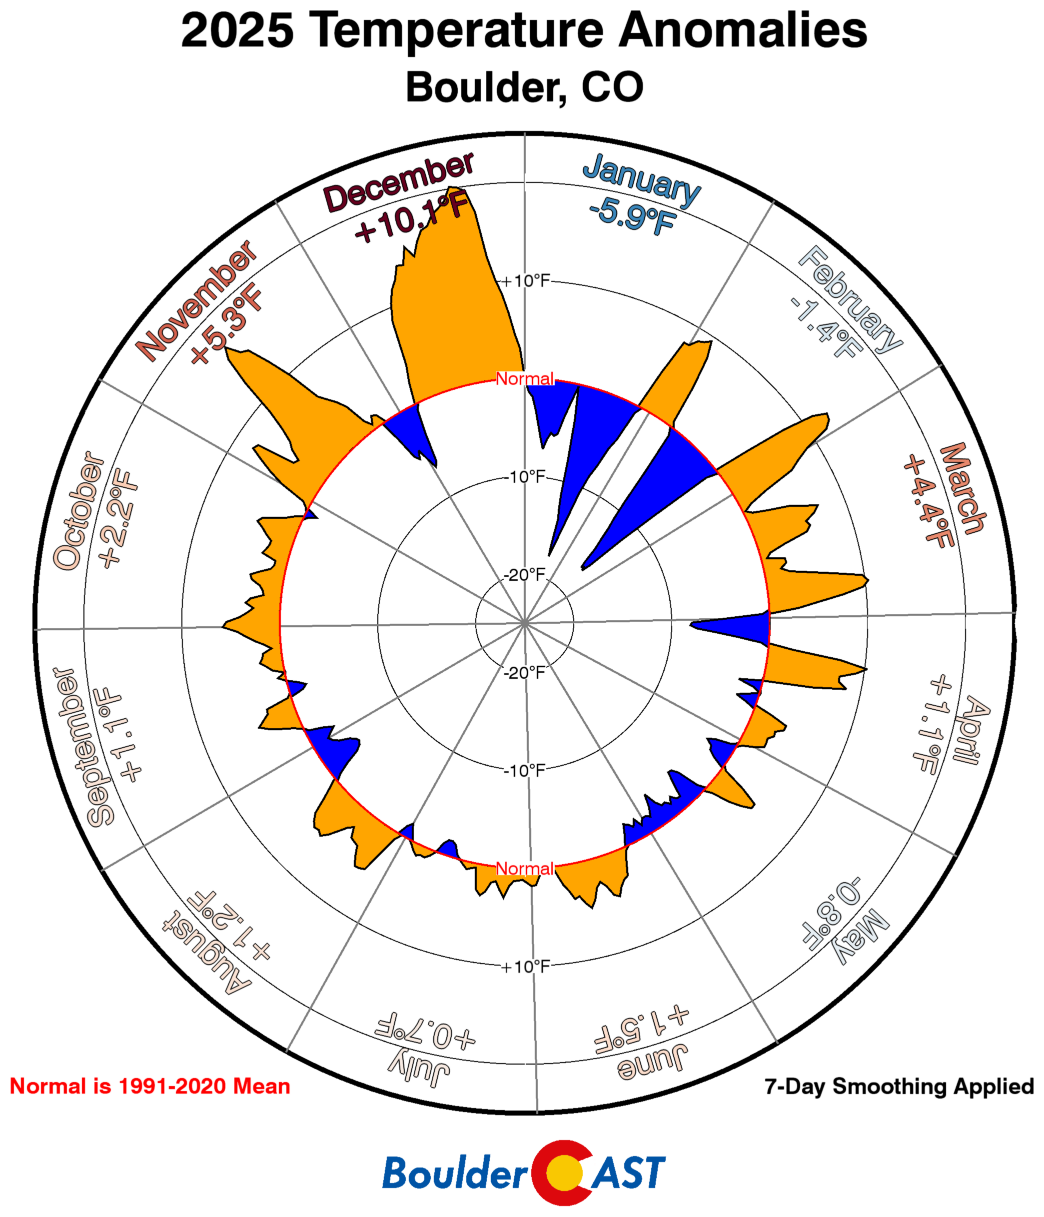
From Arctic blasts to triple‑digit scorchers, from monsoon disappointment to record‑late snowflakes, 2025 proved once again that Boulder’s weather plays by its own rules. As we close the book on 2025, it’s hard not to look ahead to the New Year with a quiet hope for more normalcy. A stretch of more typical weather would certainly be welcome by our team. Whether the atmosphere cooperates is another story. But if not, well… we’ll be right here, tracking every wild, windy, snowy, and wonderfully chaotic moment with you.
Here’s to a new year, a fresh start, and whatever 2026 decides to bring to Boulder’s skies.

Honorable Mentions: Additional Graphics from the Year
Below are a few additional graphics that help round out Boulder’s meteorological story for 2025 — a year that truly had a little bit of everything. There’s no additional commentary, but feel free to browse. Thanks for reading!

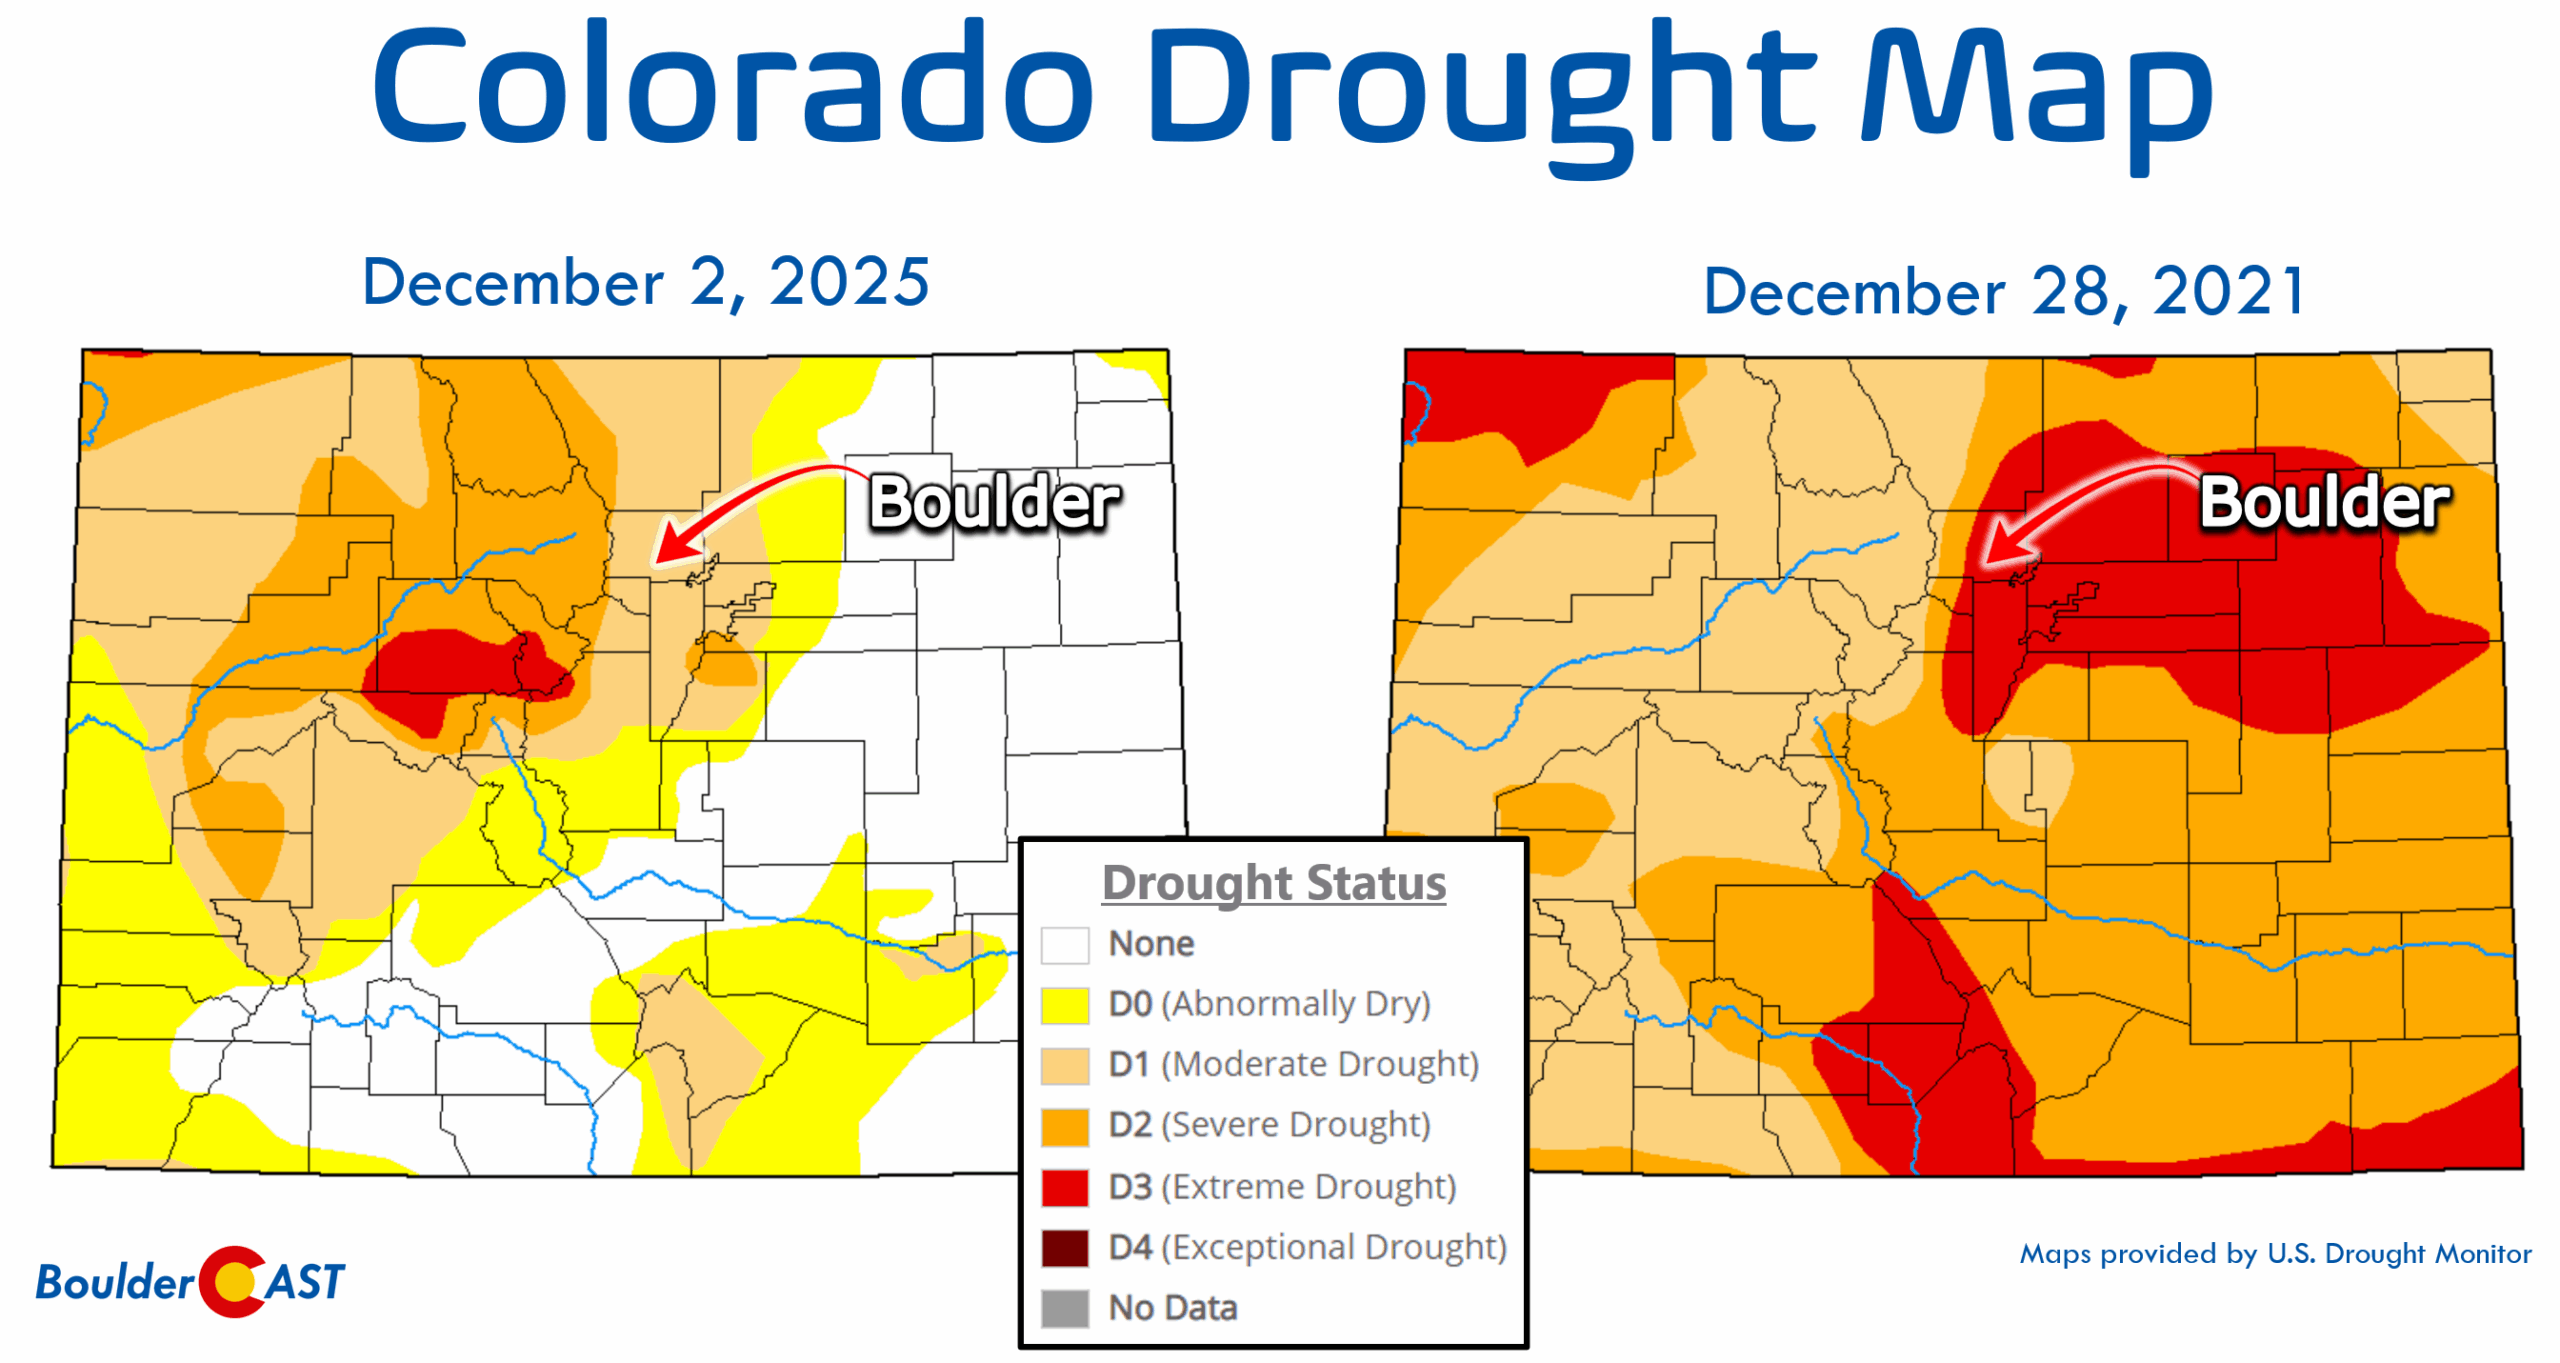
Comparing the drought status in 2025 to that during the Marshall Fire in 2021


Air quality data related to the 4th of July fireworks
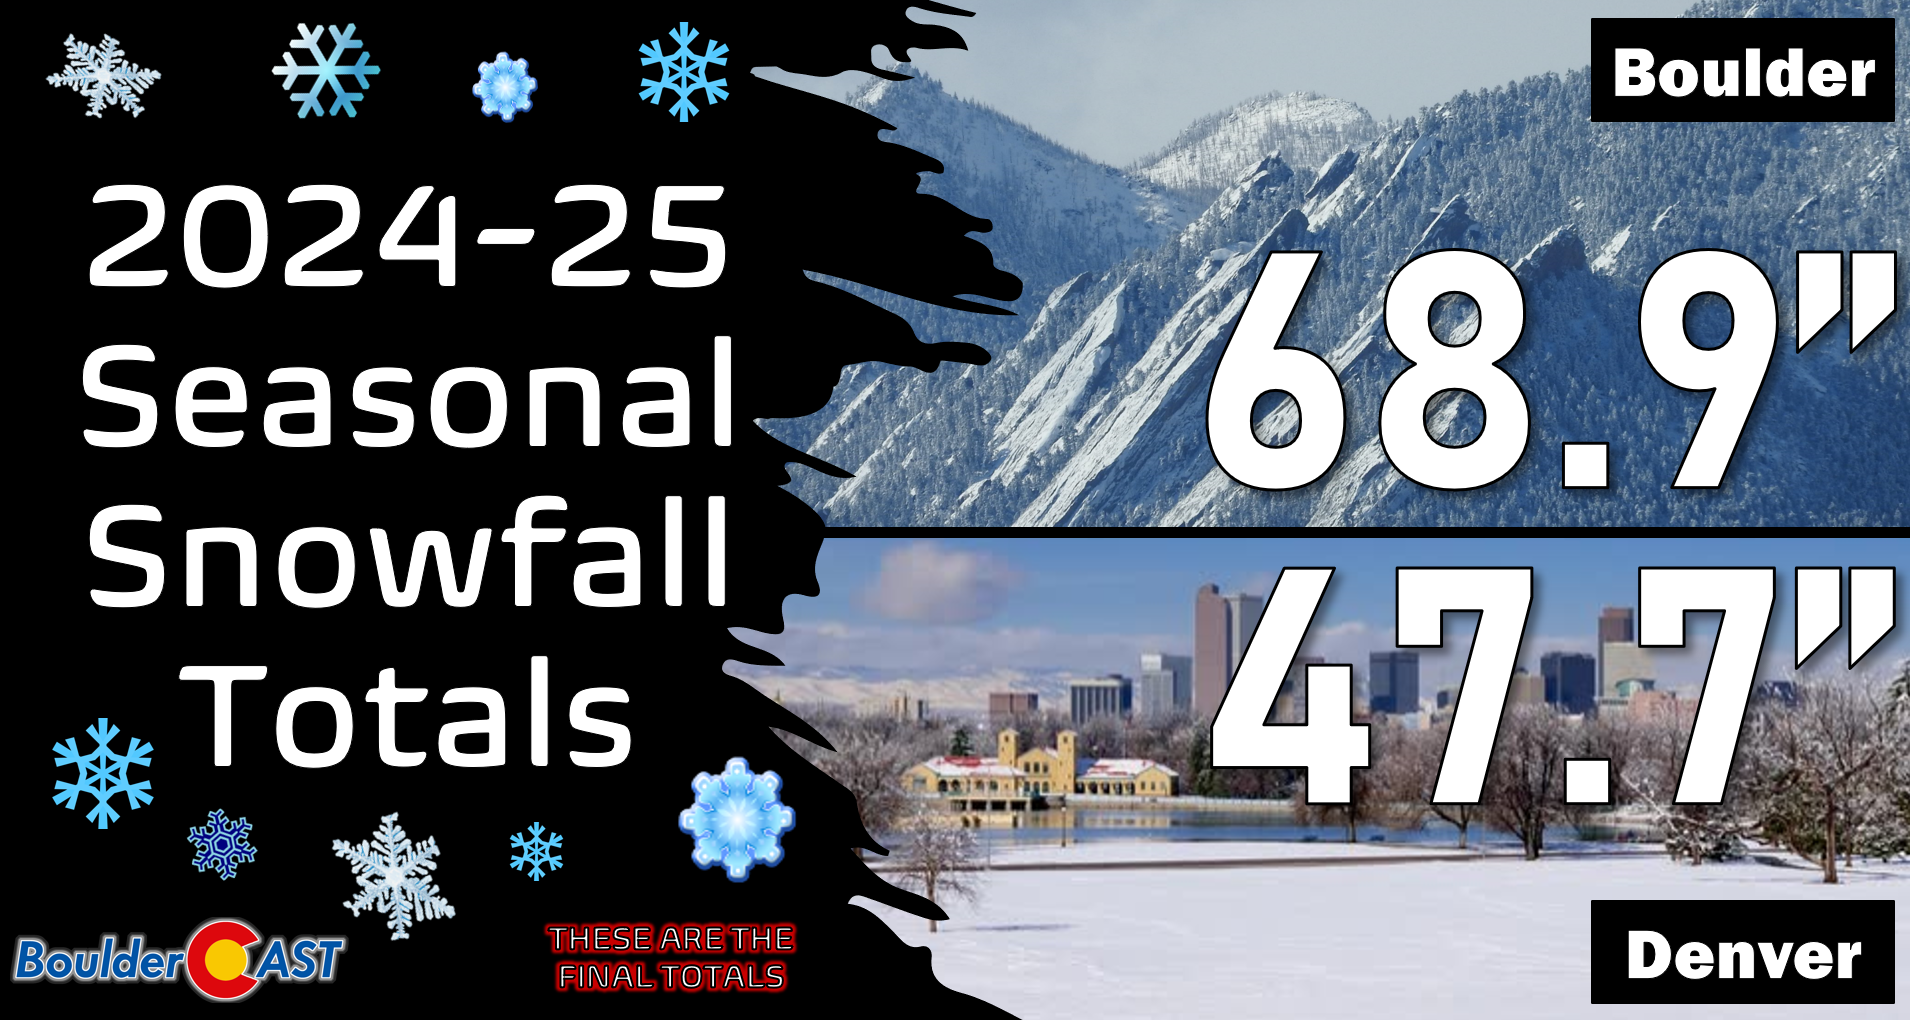
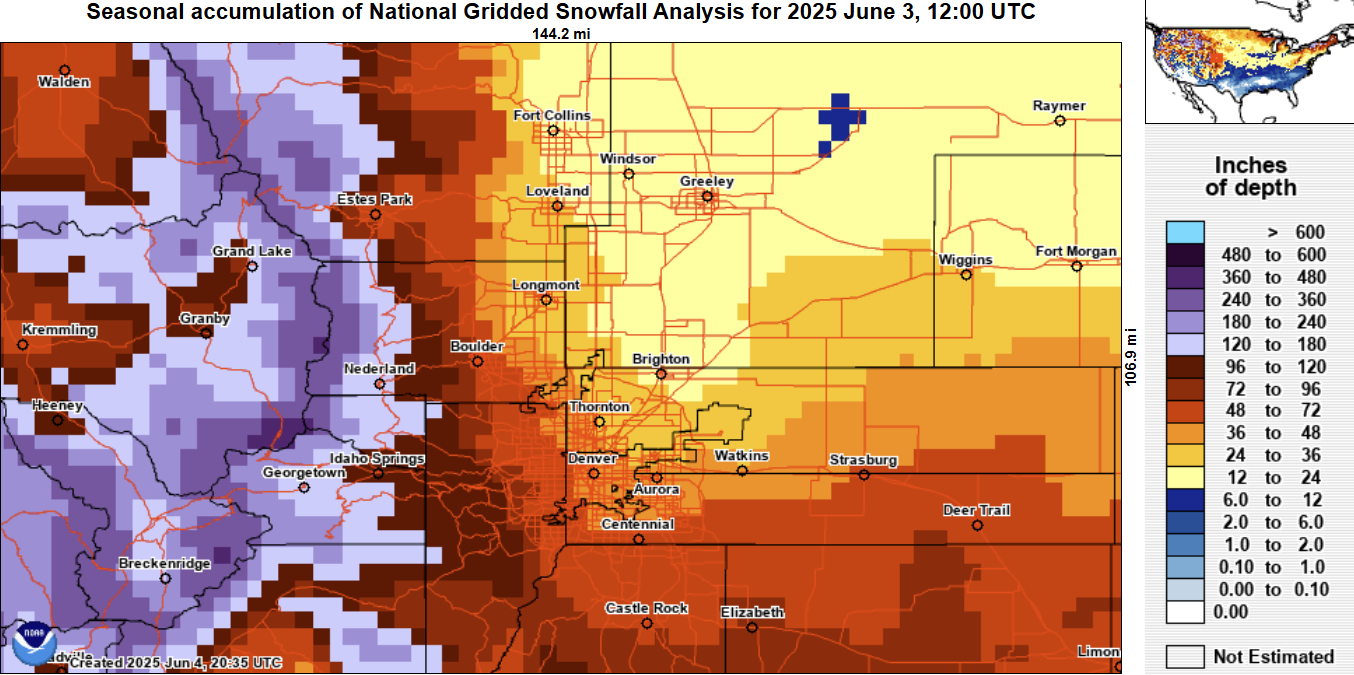
2024-2025 final seasonal snowfall total map
A few links to the year’s biggest weather happenings:
Spread the word, share Colorado weather:

Go Premium, get all the perks.
Daily Forecast Updates
Get our daily forecast discussion every morning delivered to your inbox.
All Our Model Data
Access to all our Colorado-centric high-resolution weather model graphics. Seriously — every one!
Ski & Hiking Forecasts
6-day forecasts for all the Colorado ski resorts, plus more than 120 hiking trails, including every 14er.
Smoke Forecasts
Wildfire smoke concentration predictions up to 72 hours into the future.
Exclusive Content
Weekend outlooks every Thursday, bonus storm updates, historical data and much more!
No Advertisements
Enjoy ad-free viewing on the entire site.


You must be logged in to post a comment.