
Just like last year, the biggest and most dynamic snow event of the winter season seemingly came out of no where. We discuss why some areas of the Boulder & Denver Metro areas saw nearly a FOOT of snow on Monday. We also walk through the forecast for the next five days which will be much tamer compared to the flurry of snowstorms we have endured lately.
Snow totals from Monday
While officially the storm produced only 4.3″ in Boulder and 1.3″ in Denver (at D.I.A.), areas in between saw MUCH more snow, nearly a foot in Westminster, Superior and parts of Broomfield. Heck, even downtown Denver saw close to 8″!
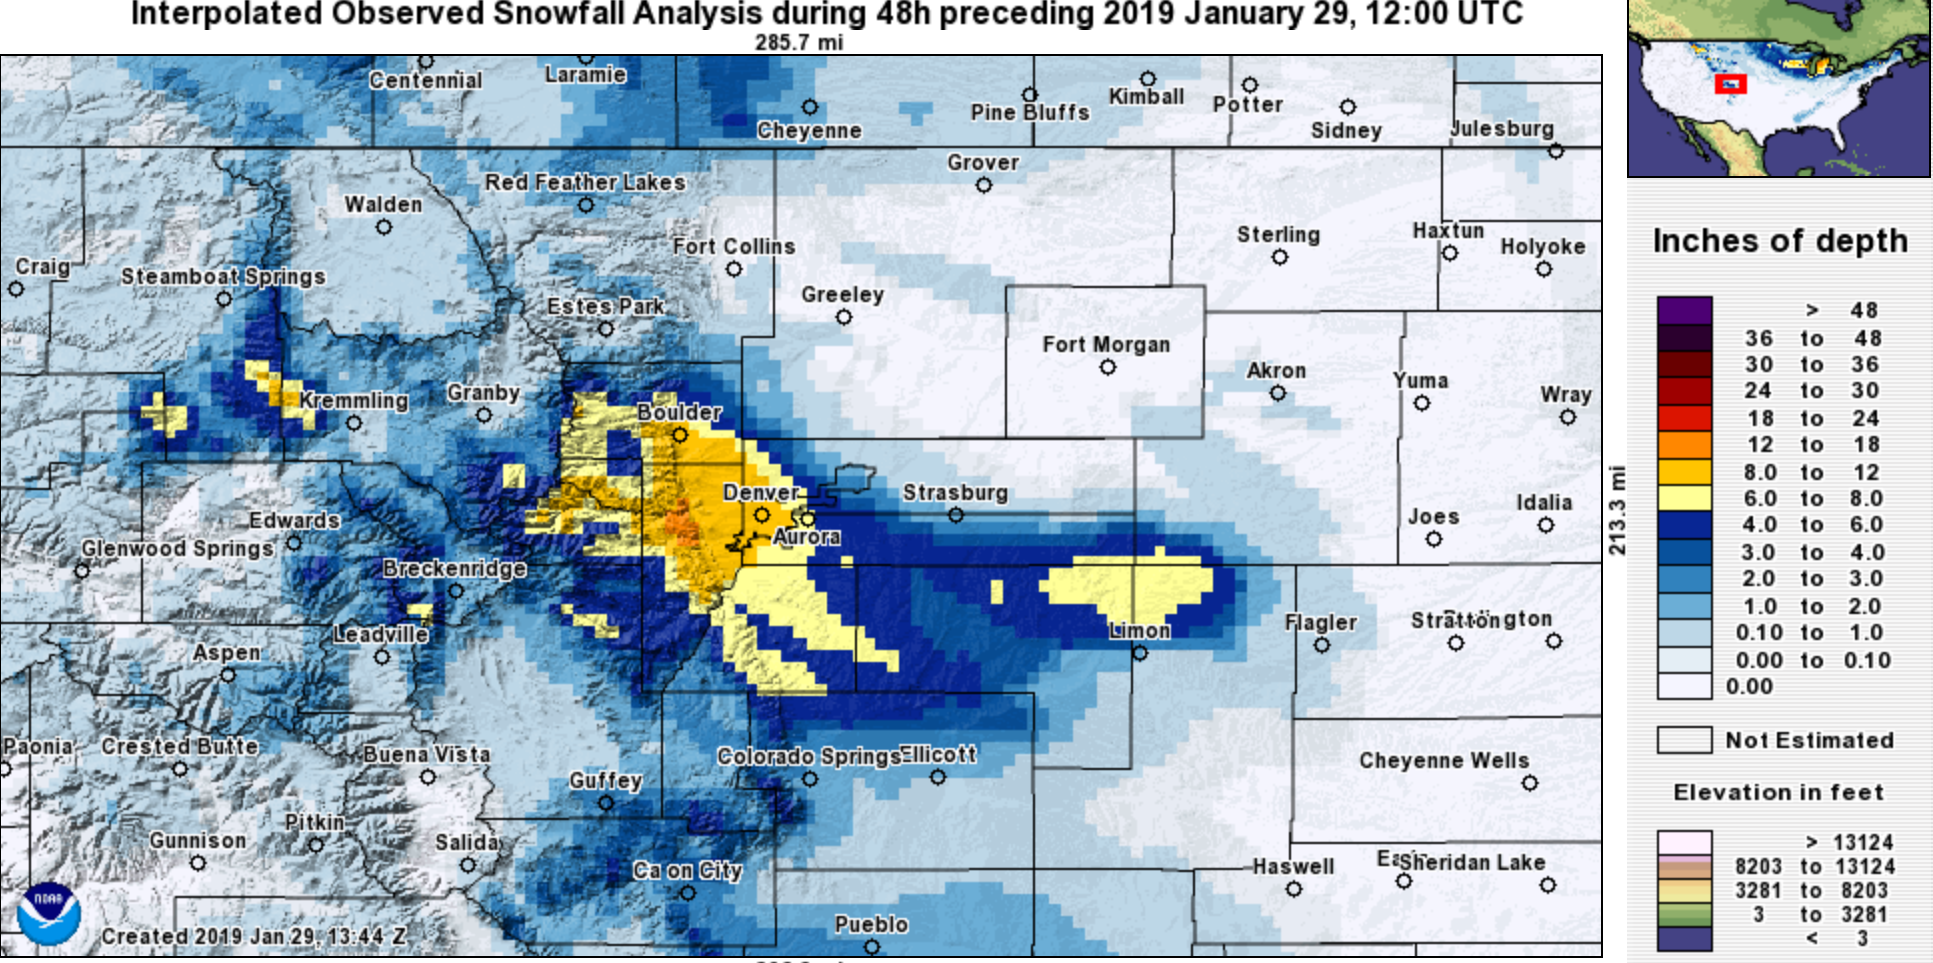
Interpolated snowfall analysis from the storm.
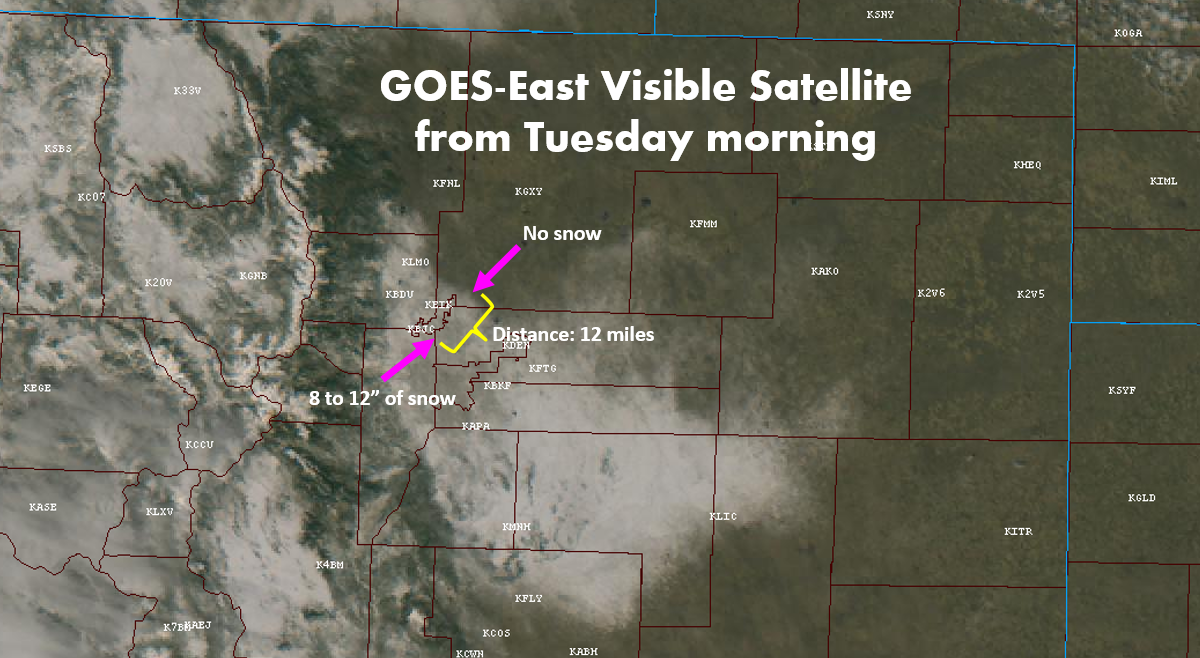
Clear skies this morning not only led to chilly overnight temperatures (single digits), it also allowed GOES-East to see just how localized Monday’s snowfall really was. The separation between a foot of snow and no snow was only about 12 miles!
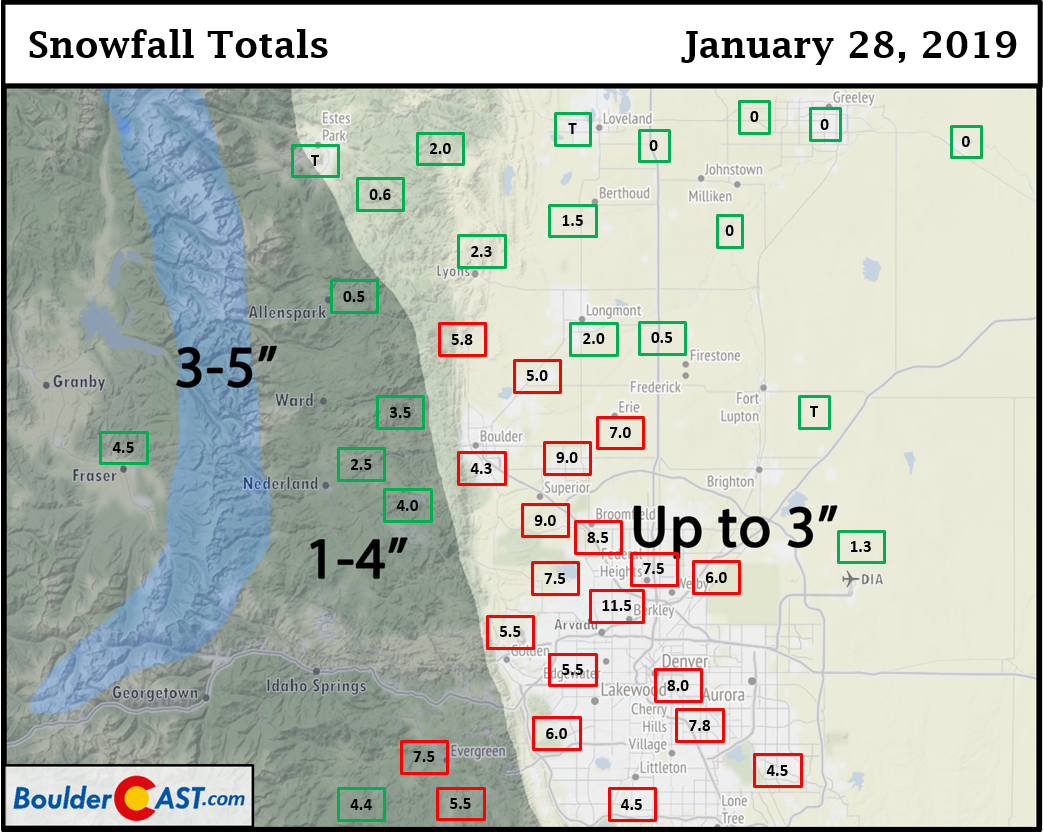
Shown below is our original snowfall forecast map (issued Sunday morning), with the observed storm totals per location contained in boxes. Green ones indicate that the observed snowfall was within one inch of the given forecast range, while red was outside the scope of our forecast.
Why was this storm so poorly forecast?
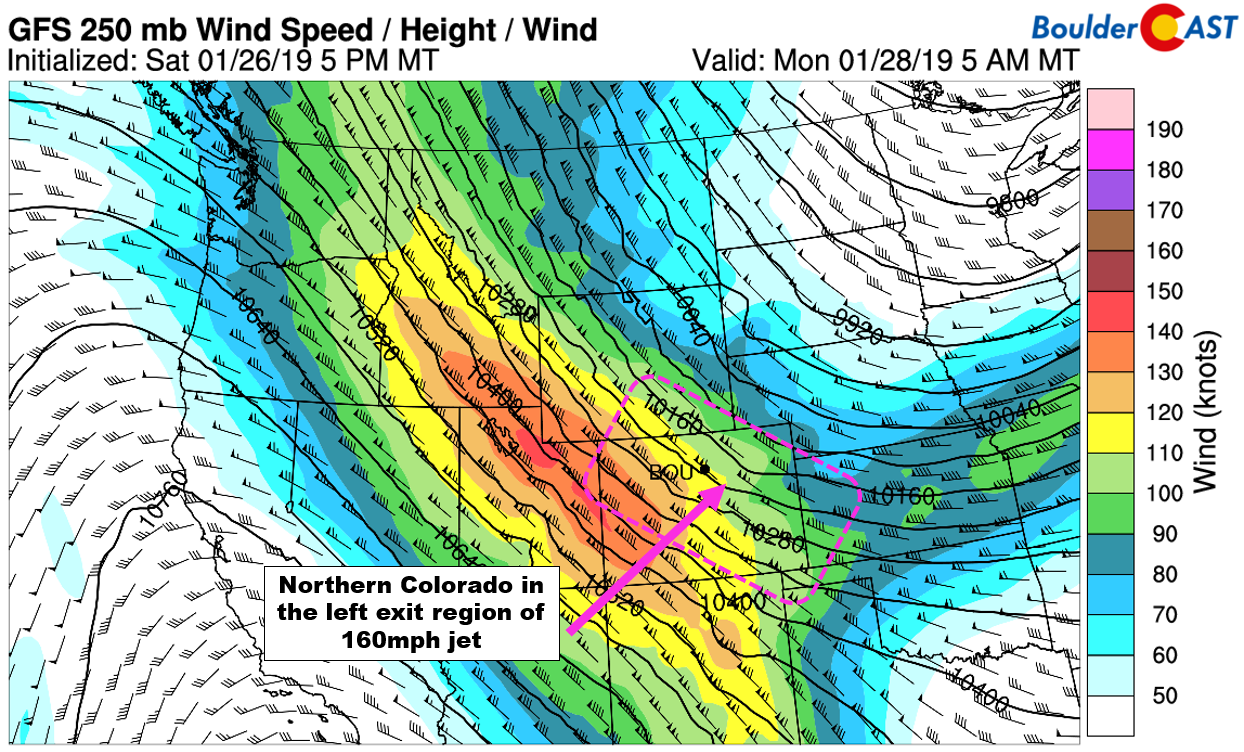
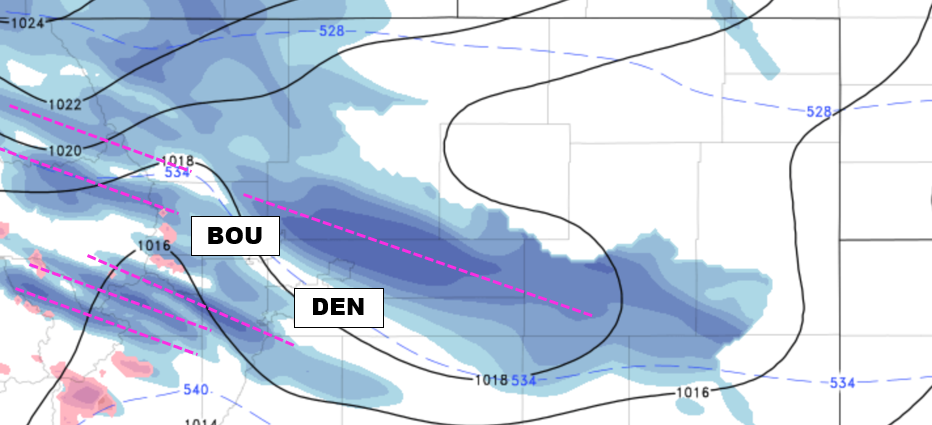
We knew the overhead jet-stream would be a significant factor in producing heavy snow bands across the Front Range Monday morning, but to what degree remained a bit of a mystery for a number of reasons. A quick-look at the jet stream forecast from the GFS for Monday morning at 5:00 AM should have sparked a little excitement for snow-lovers (shown below). The Denver Metro area was in a PRIME location for localized, intense snow banding to occur.
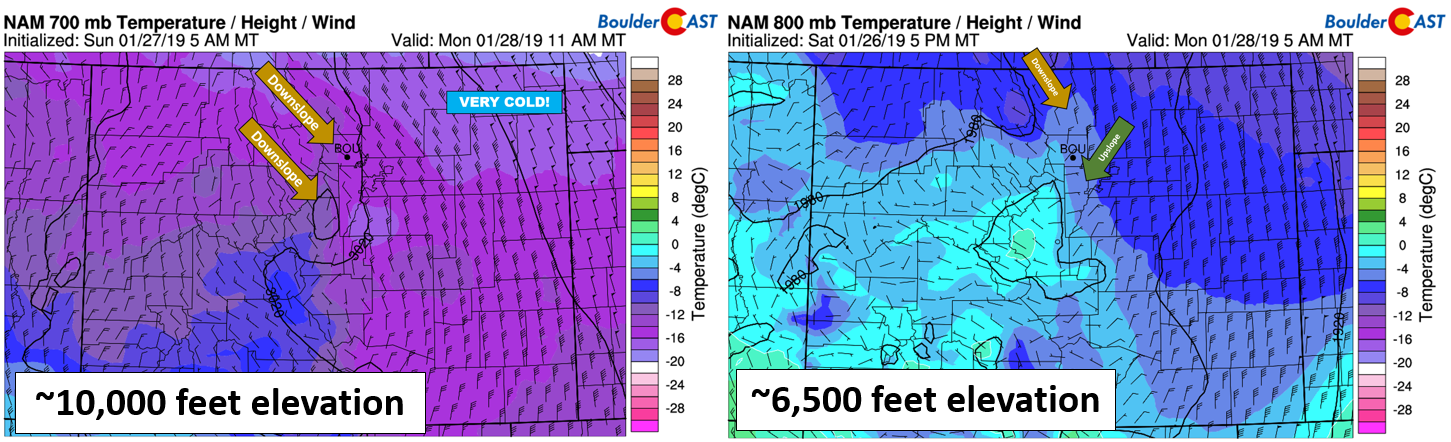
However, while the upper-level lift from the jet was looking good, other aspects of the storm were borderline. Mainly, winds were forecast to be downslope near 10,000 feet elevation (below on left). Closer to the surface, upslope was only going to be present from Boulder County southward (below on right). Ultimately, complete downsloping north of Longmont led us to predict little to no snow in those areas, which largely verified. Loveland and Fort Collins saw EXACTLY zero inches of snow.
One big problem was that none of the large-scale models picked-up on the jet-forced snow bands at all. Only the higher-resolution models, like the HRRR (shown below) and the 3KM-NAM produced the banding. This behavior is typical for snow events where the jet is only a minor aspect of the storm. Normally, when the jet dumps the type of snow we saw on Monday, banding will show-up in the global models as well, loud and clear. This missing component forced us to be cautious and skeptical of how important the jet banding would be Monday morning. Depending on how likely and widespread the bands could be, our forecast snowfall amounts can increase exponentially. In this case, we played it safe with just a 1 to 3″ forecast for the area.
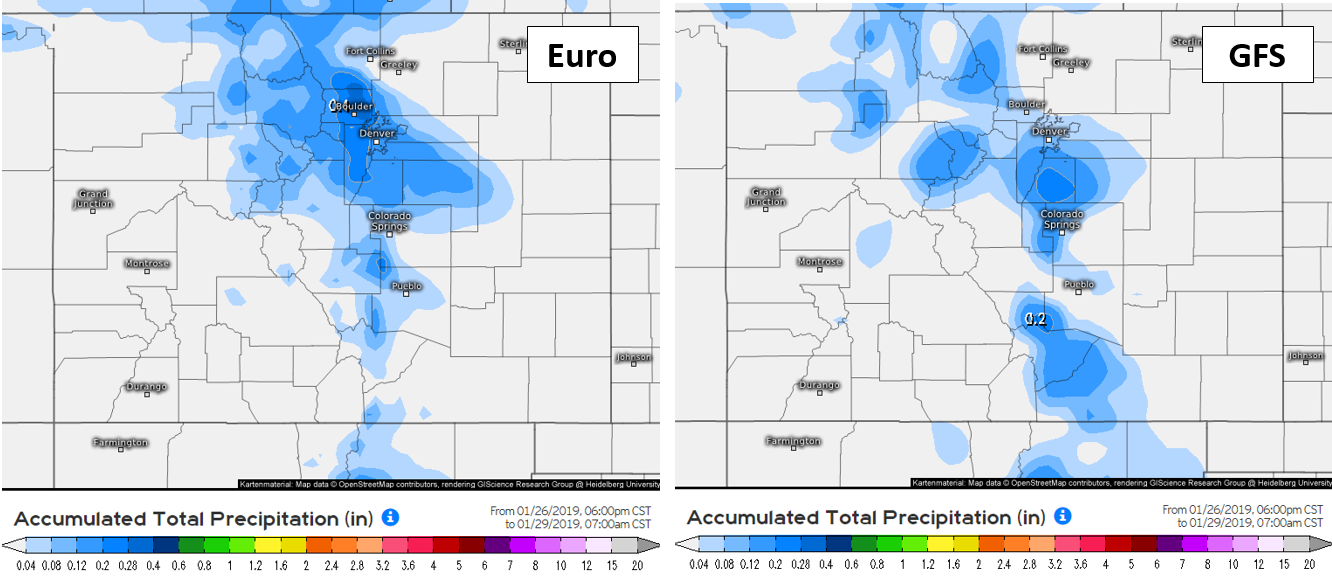
Another tricky aspect of the forecast was overall poor agreement between all of the models, even in the final hours leading up to the storm’s arrival. While most of the weather models were predicting a 4 to 6 inch snowstorm a few days ago, the GFS and NAM models slowly but noticeably dried out as the date approached, changing tune and predicting only 0 to 2″ of snowfall across the Metro area. The Euro model was the only one that stuck to its guns, never wavering from that 4 to 6″ prediction. Shown below are the Euro (left) and GFS (right) precipitation forecast runs from Sunday evening for the storm. Notice the big bullseye in precipitation from the Euro across the western Metro area, particularly in Boulder County. You can see how different this forecast is from the GFS model in the same areas. Yikes!
We often hold the Euro model above all others as it typically does indeed do a little better on average with snow events in our area. The key here is the “on average”. It isn’t the winner for every single snowstorm, or even most of our snowstorms. That would make things too easy, of course. This time around, we didn’t put much faith in the European model’s bullish forecast for the following reasons:
- As other models dried out, it became the bullish outlier, forecasting snow totals well above any other models
- Just one week ago on M.L.K. Day, the Euro was also the bullish outlier and busted VERY badly.
- Its precipitation forecast (see left map above) was showing a greater influence from upslope rather than jet-forced banding. That is, the heaviest amounts aligned along the topography (north to south), not along the direction of the jet bands (northwest to southeast). It wasn’t clear at the time that this would ultimately be the best solution. More on this in a minute…
We felt quite justified with our decision to discount the Euro for this storm. Still, even if we took the European model 100% of its face-value, this only would have led to 4 to 8″ of snow for a small region including Boulder, Superior, and Golden, with 2 to 4″ elsewhere in the Metro area. This wouldn’t have been a very good forecast either. For this storm, the battle was over before it even started.
So why was this storm such a BOOM? The only explanation that makes sense is that the low-level upslope component was stronger and more northeasterly than the GFS and NAM models were showing, more akin to what the Euro had. Our forecast counted on the lack of much upslope and even downslope to keep the jet-forcing and associated snow bands in-check. To some degree, this did happen as areas north of Longmont reported almost no snow at all, and areas west of Boulder in the Foothills reported significantly lower snow totals. It just so happened this time that the upslope and jet teamed-up to produce near stationary snow bands for much of Monday morning. The full radar animation from the storm is below.
Hidden in that animation is the evidence that this event wasn’t purely a massive over-producer from the perspective of the overhead jet stream. Upslope also played a vital and arguably even bigger role in Monday’s wallop of snow.
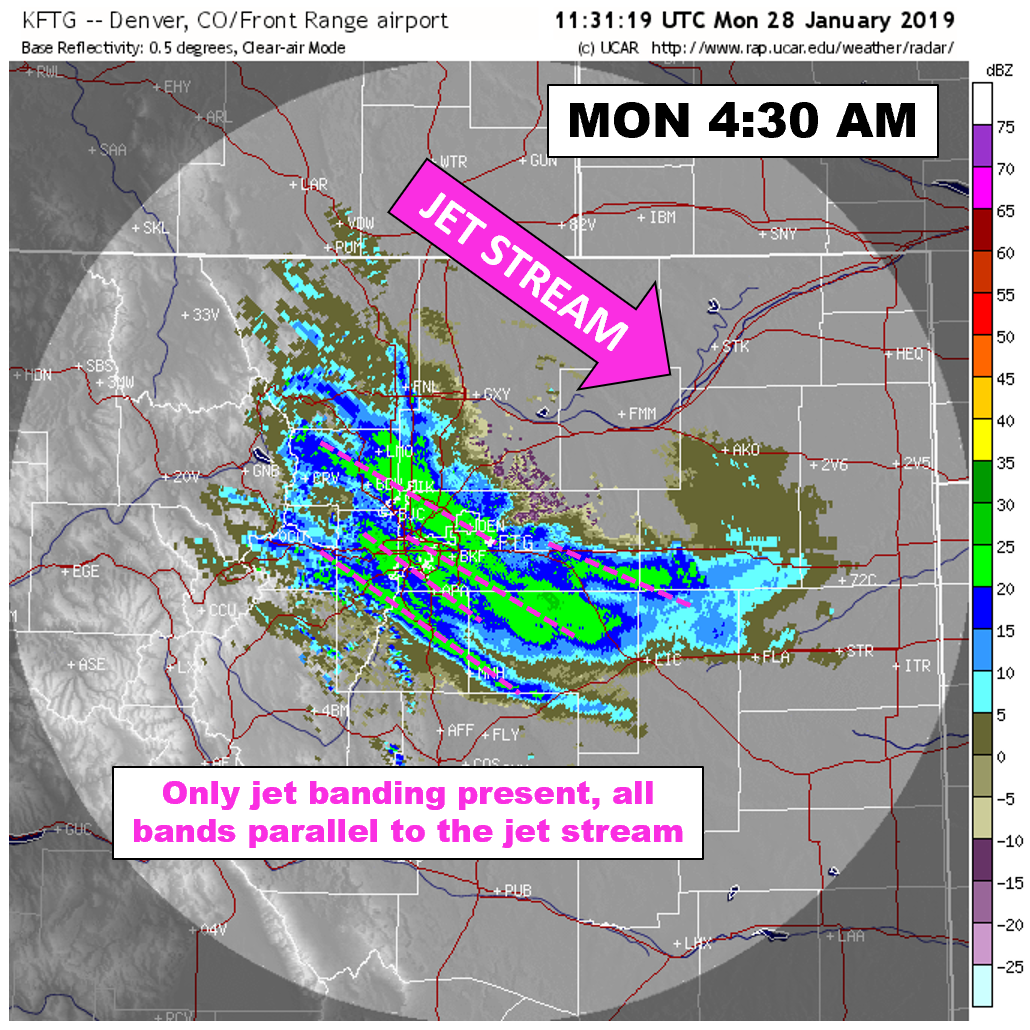
Here is a look at radar for 4:30 AM on Monday. At this time, it was a primarily jet-forced set-up. We know this because all five of the snow bands are parallel to the jet stream. Keep in mind, each band is only a handful of miles wide, but more than 60 miles long, a classic jet signature.
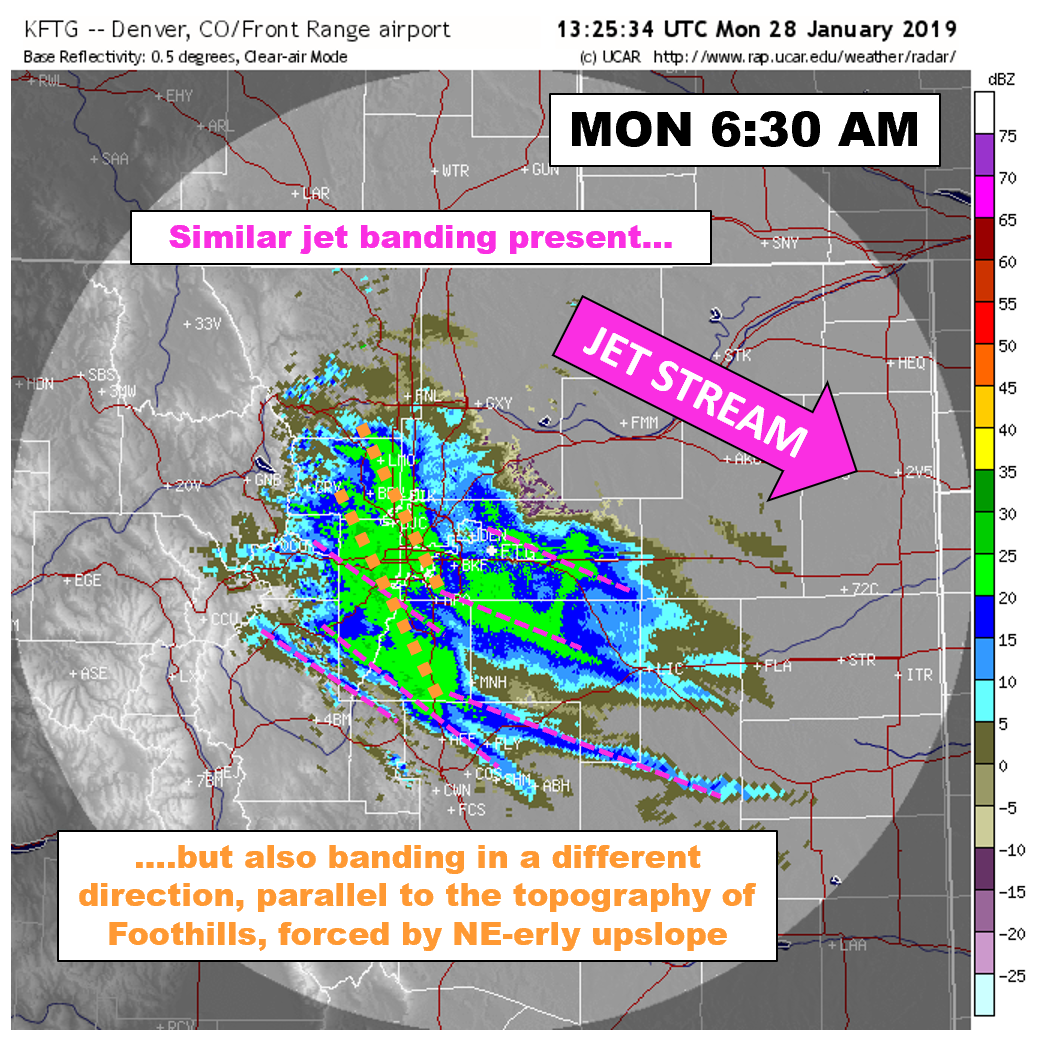
Now let’s look at radar at 6:30 AM. Similar jet banding is also present, denoted with pink lines again. However, we now see banding in a secondary direction (orange lines). These lines just so happen to match up with the abrupt rise in topography of the western Metro area. These bands are the “smoking gun” of the storm, a key signature that points to intense local lift forced by strong northeasterly upslope.
It was actually the more northern of these two bands that hovered nearly stationary for about five hours, piling up snow from Erie, through Broomfield and Westminster, into downtown Denver. A very similar localized scenario to this unfolded in Boulder back on Groundhog Day 2016, a snowstorm that dumped between one and two FEET of snow up and down the Front Range west of I-25.
One other important note… The northern-most upslope-enhanced snow band was displaced eastward by about 10 to 15 miles. Typically areas closer to the topography will be impacted most. This is why Boulder almost always sees more snow than the “L” towns further east. There must have been an opposing force to shift the upslope band eastward. If we take a look at low-level winds during the heaviest snow, we find the (likely) answer…a topographic anti-cyclone caused by northeasterly winds entering the Metro area, encountering the Palmer Divide, and then swirling back northward along the base of the Foothills.
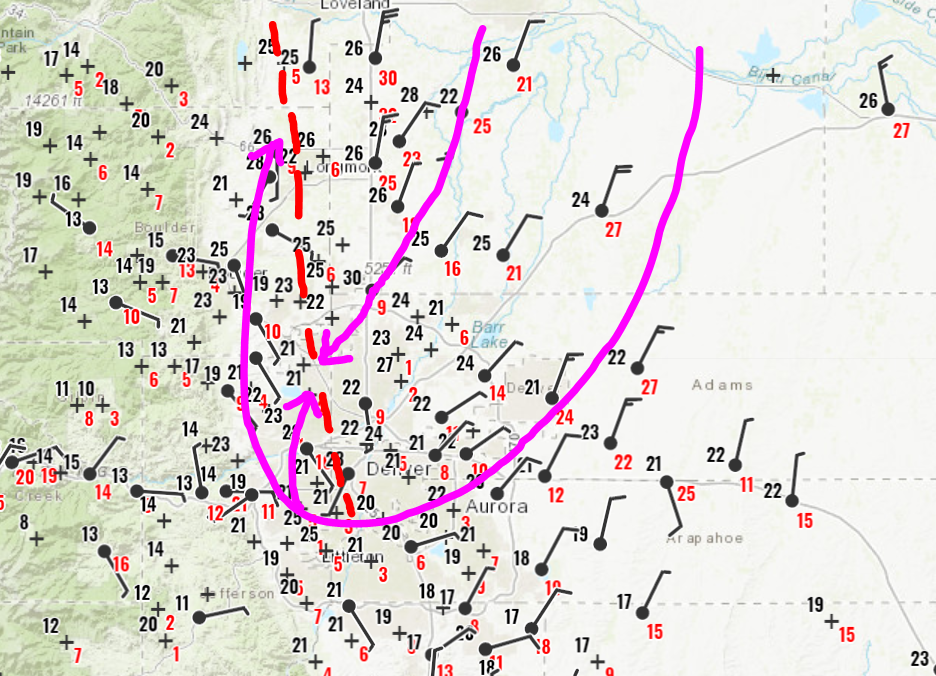
Surface observations from Monday morning. Topographic features in the Metro area led to a swirling of the winds (pink lines) and a stationary convergence zone (red line).
In summary, this is why it seemed like weather forecasters, including BoulderCAST, were out to lunch on Monday:
- Most models were showing only up to 1 or 2″ of snow for the region and were riding a nasty trend downward. One model, the Euro, was predicting 3 to 7″, but this model busted badly last week in a similar situation. Overall, ALL models were too low.
- We knew the jet would be a factor, but uncertainty was high in exactly how much of a factor. Many models had no jet impact, others had low to moderate impact.
- Upslope was expected to be a rather minor factor in the event. Evidence suggests however it was directly responsible for the huge snow totals west and northwest of Denver. Part of the equation was also the topographically-forced anti-cyclonic flow within the Metro area. In short, the models got the magnitude, direction and interplay of the low-level winds incorrect, which resulted in a large error in snow amounts and outcome.
There is a small percentage of storms which cannot be accurately predicted by our current generation of weather models, even with expert weather forecasters interpreting the data. Monday’s storm was one of them (and it surely won’t be the last!)…
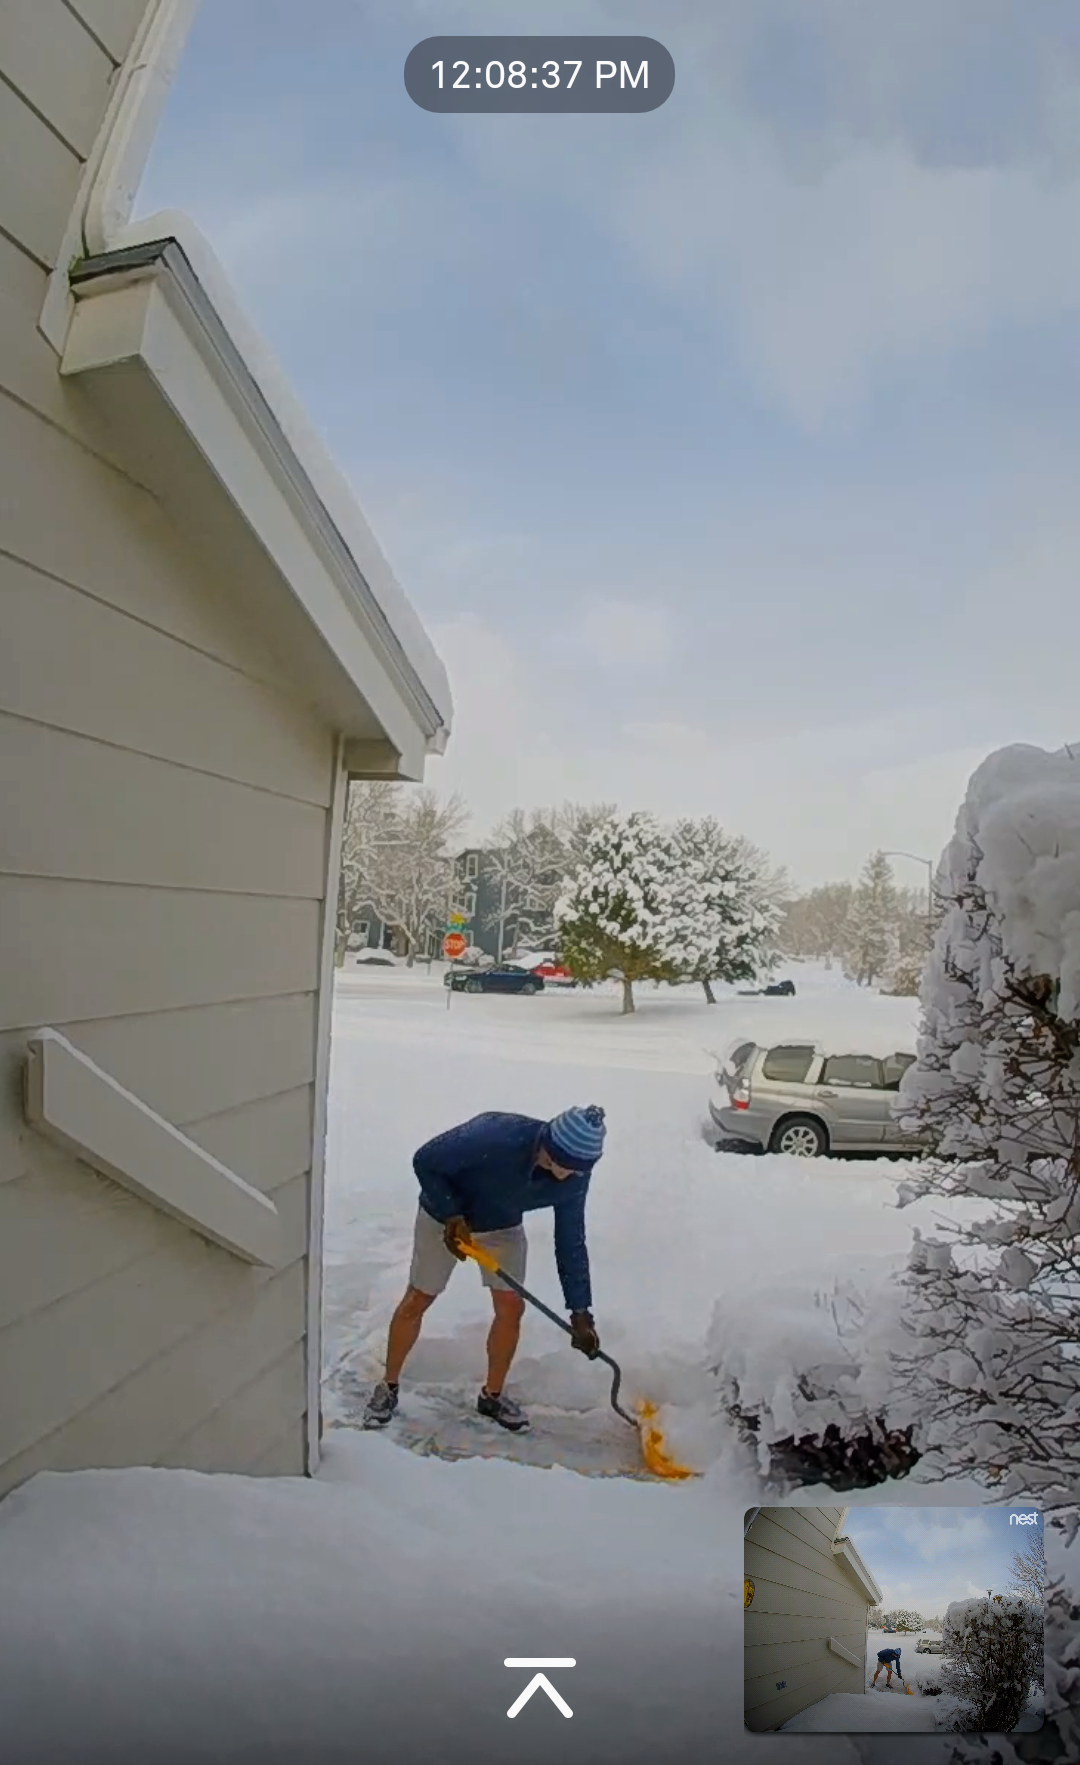
“Thanks BoulderCAST…now I have to clean up your busted forecast in shorts…” (that is me)
The week ahead: A break from the snow
Lingering impacts from Monday’s snowstorm will be minimal. Roadways are already in good shape, thanks in part to sunshine returning Monday afternoon and those warm temperatures near 55 degrees we had on Sunday.
National weather headlines this week won’t include the BOOM-ing snowstorm we had here in the Denver and Boulder area. Instead, the focus remains on the record-breaking Arctic air invading the Upper Midwest and Northeast. Yes folks, the dreaded “POLAR VORTEX” is back! In all seriousness, real meteorologists hate that media-coined term as it is horribly inaccurate. Please don’t use it when referring to cold air outbreaks!
Today’s 500 mb height forecast map from the GFS model is shown below. It’s hard to ignore the extreme trough overtaking the eastern half of the country. We’re fairly lucky here in Colorado that it doesn’t have the oomph to push a little further westward. Our region will largely be spared from the coldest air. The worst of it will actually be this morning with overnight lows in the single digits.
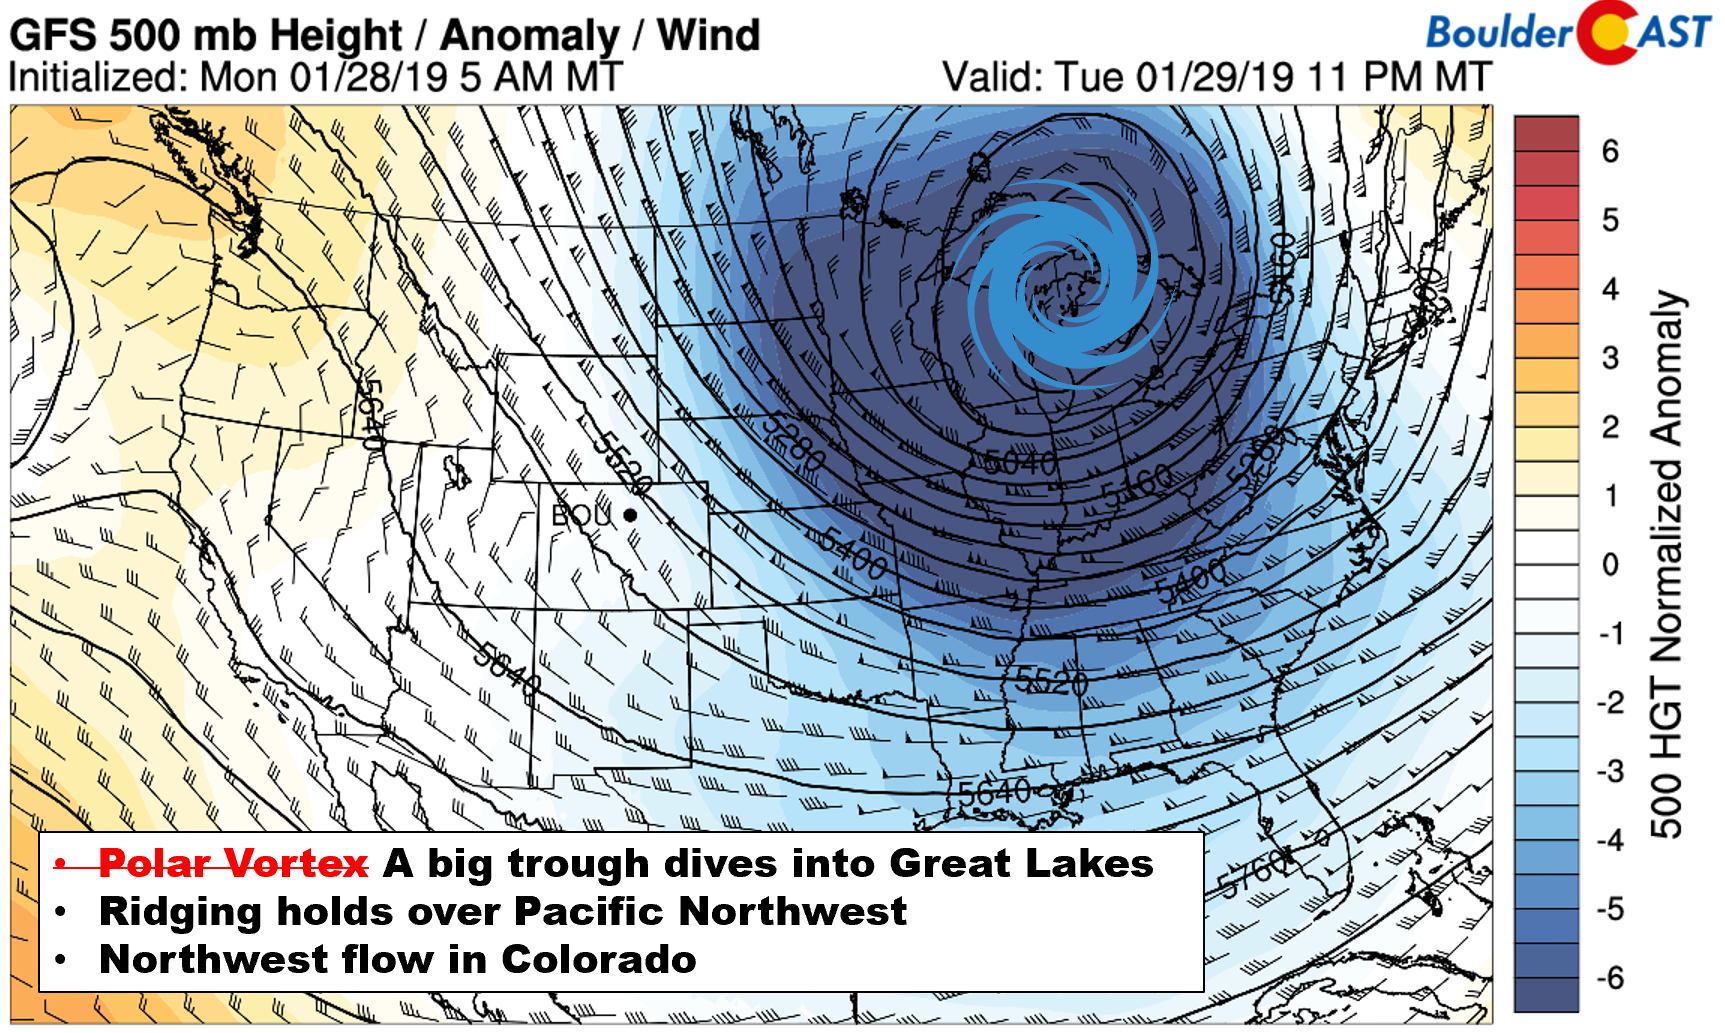
GFS 500 mb height anomaly map for Tuesday evening. Whoa! What’s going on in the Great Lakes?
The forecast map below shows mid-day temperature anomalies on Wednesday this week. The lightest pinks spanning the much of the Upper Midwest are more than 30°C below normal. That’s a whopping 54°F!
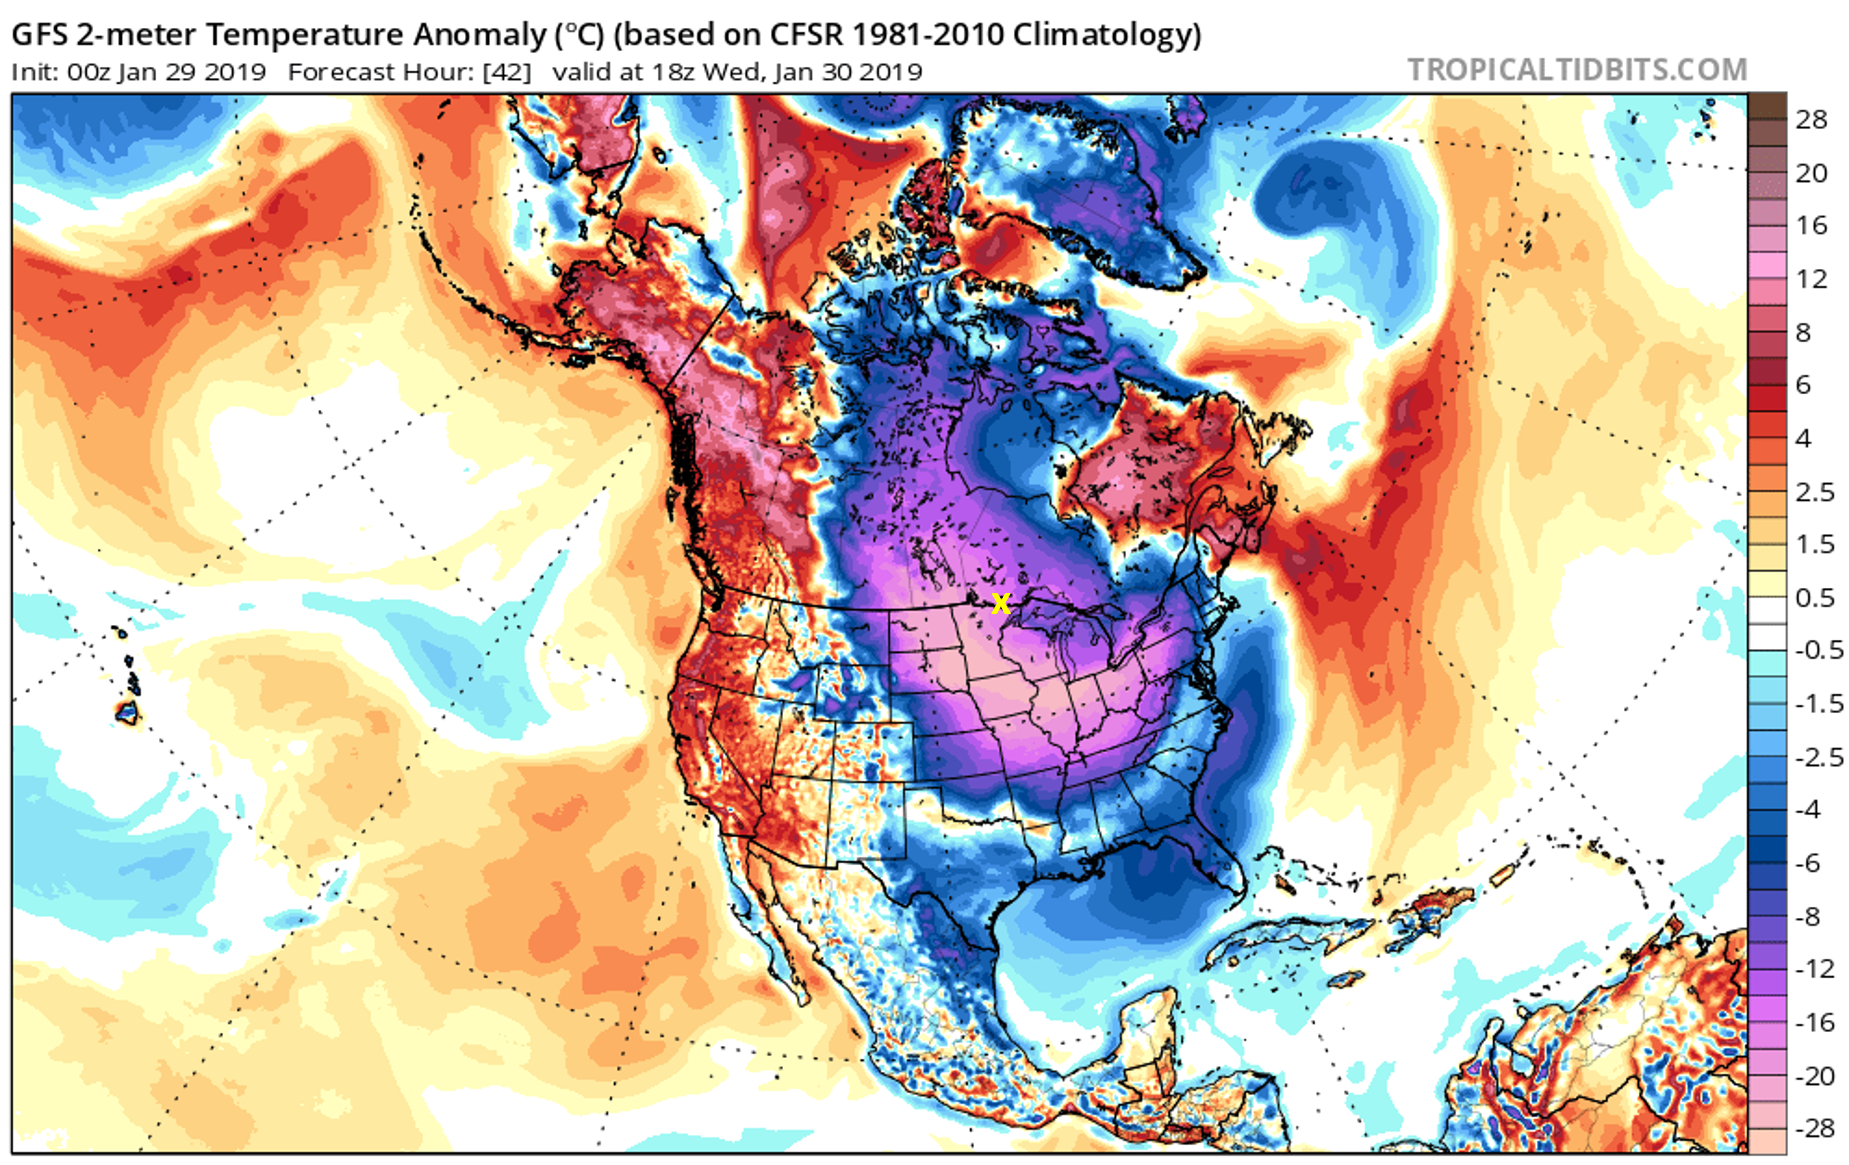
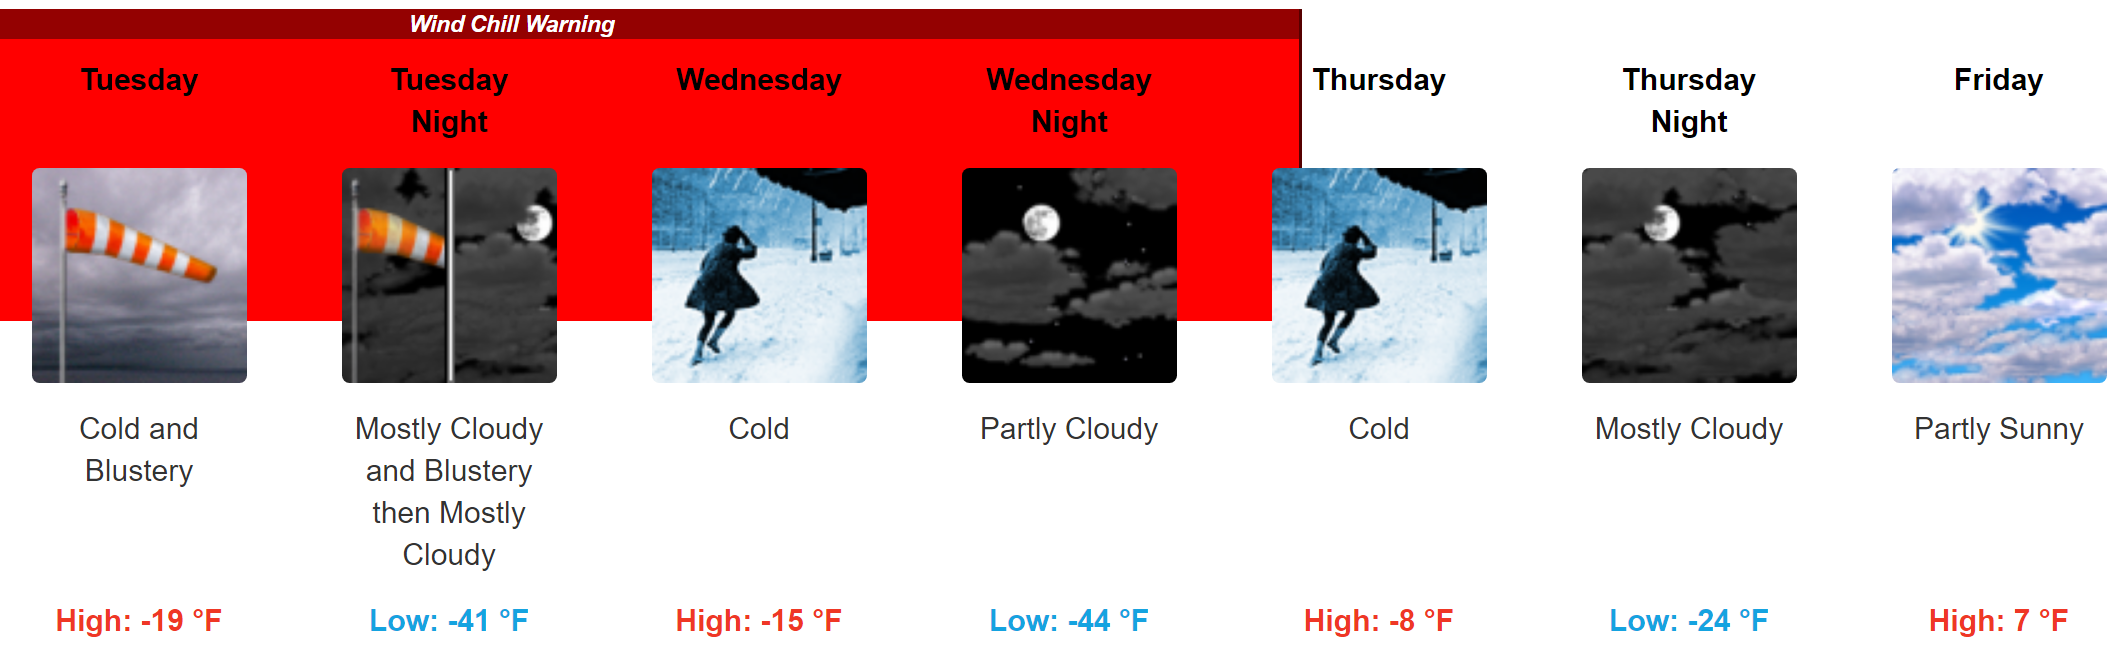
One extreme case in International Falls, Minnesota (yellow “X” above), the average high temperature this time of year is around 20°F. Today the projected high is -19°F, with overnight lows in the middle 40’s below zero the next few nights and wind chills closer to 60 below.
Personally having experienced temperatures as frigid as -75°F (without the wind!) during my time studying snowfall in Greenland, this magnitude of cold is no joke. Your eyes glaze over with ice, spit freezes solid before hitting the ground, and frostbite comes on within minutes.
The historically cold airmass diving southward actually bottoms out the 800 mb colorbar for temperature in the BoulderCAST models. That shade of pink sure is lovely!
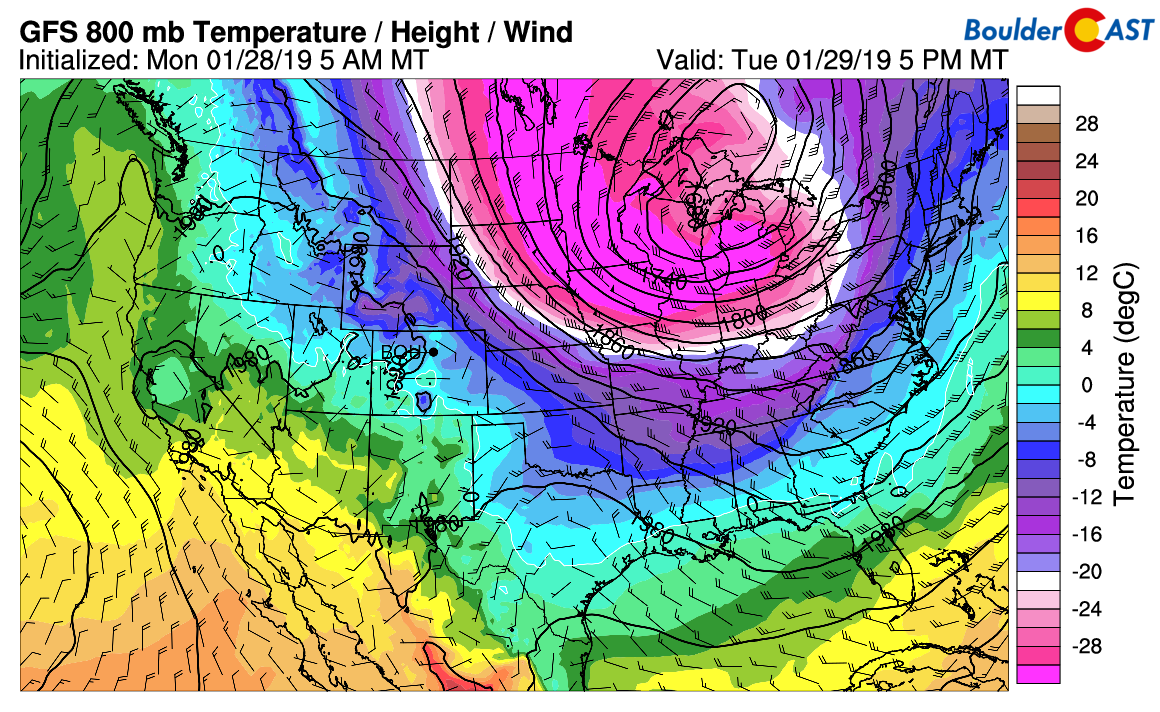
GFS 800 mb temperature map for Tuesday evening showing the outbreak of Arctic air.
Alright, enough about the shivering eastern half of the country…
Temperatures will be moderating in Colorado with dry conditions expected heading through the rest of the week. This lull in the action is the result of the ridge across the eastern Pacific breaking down and shifting eastward across the Rockies. By Friday, the axis will have passed us by with warmer southwest flow taking hold in our region.
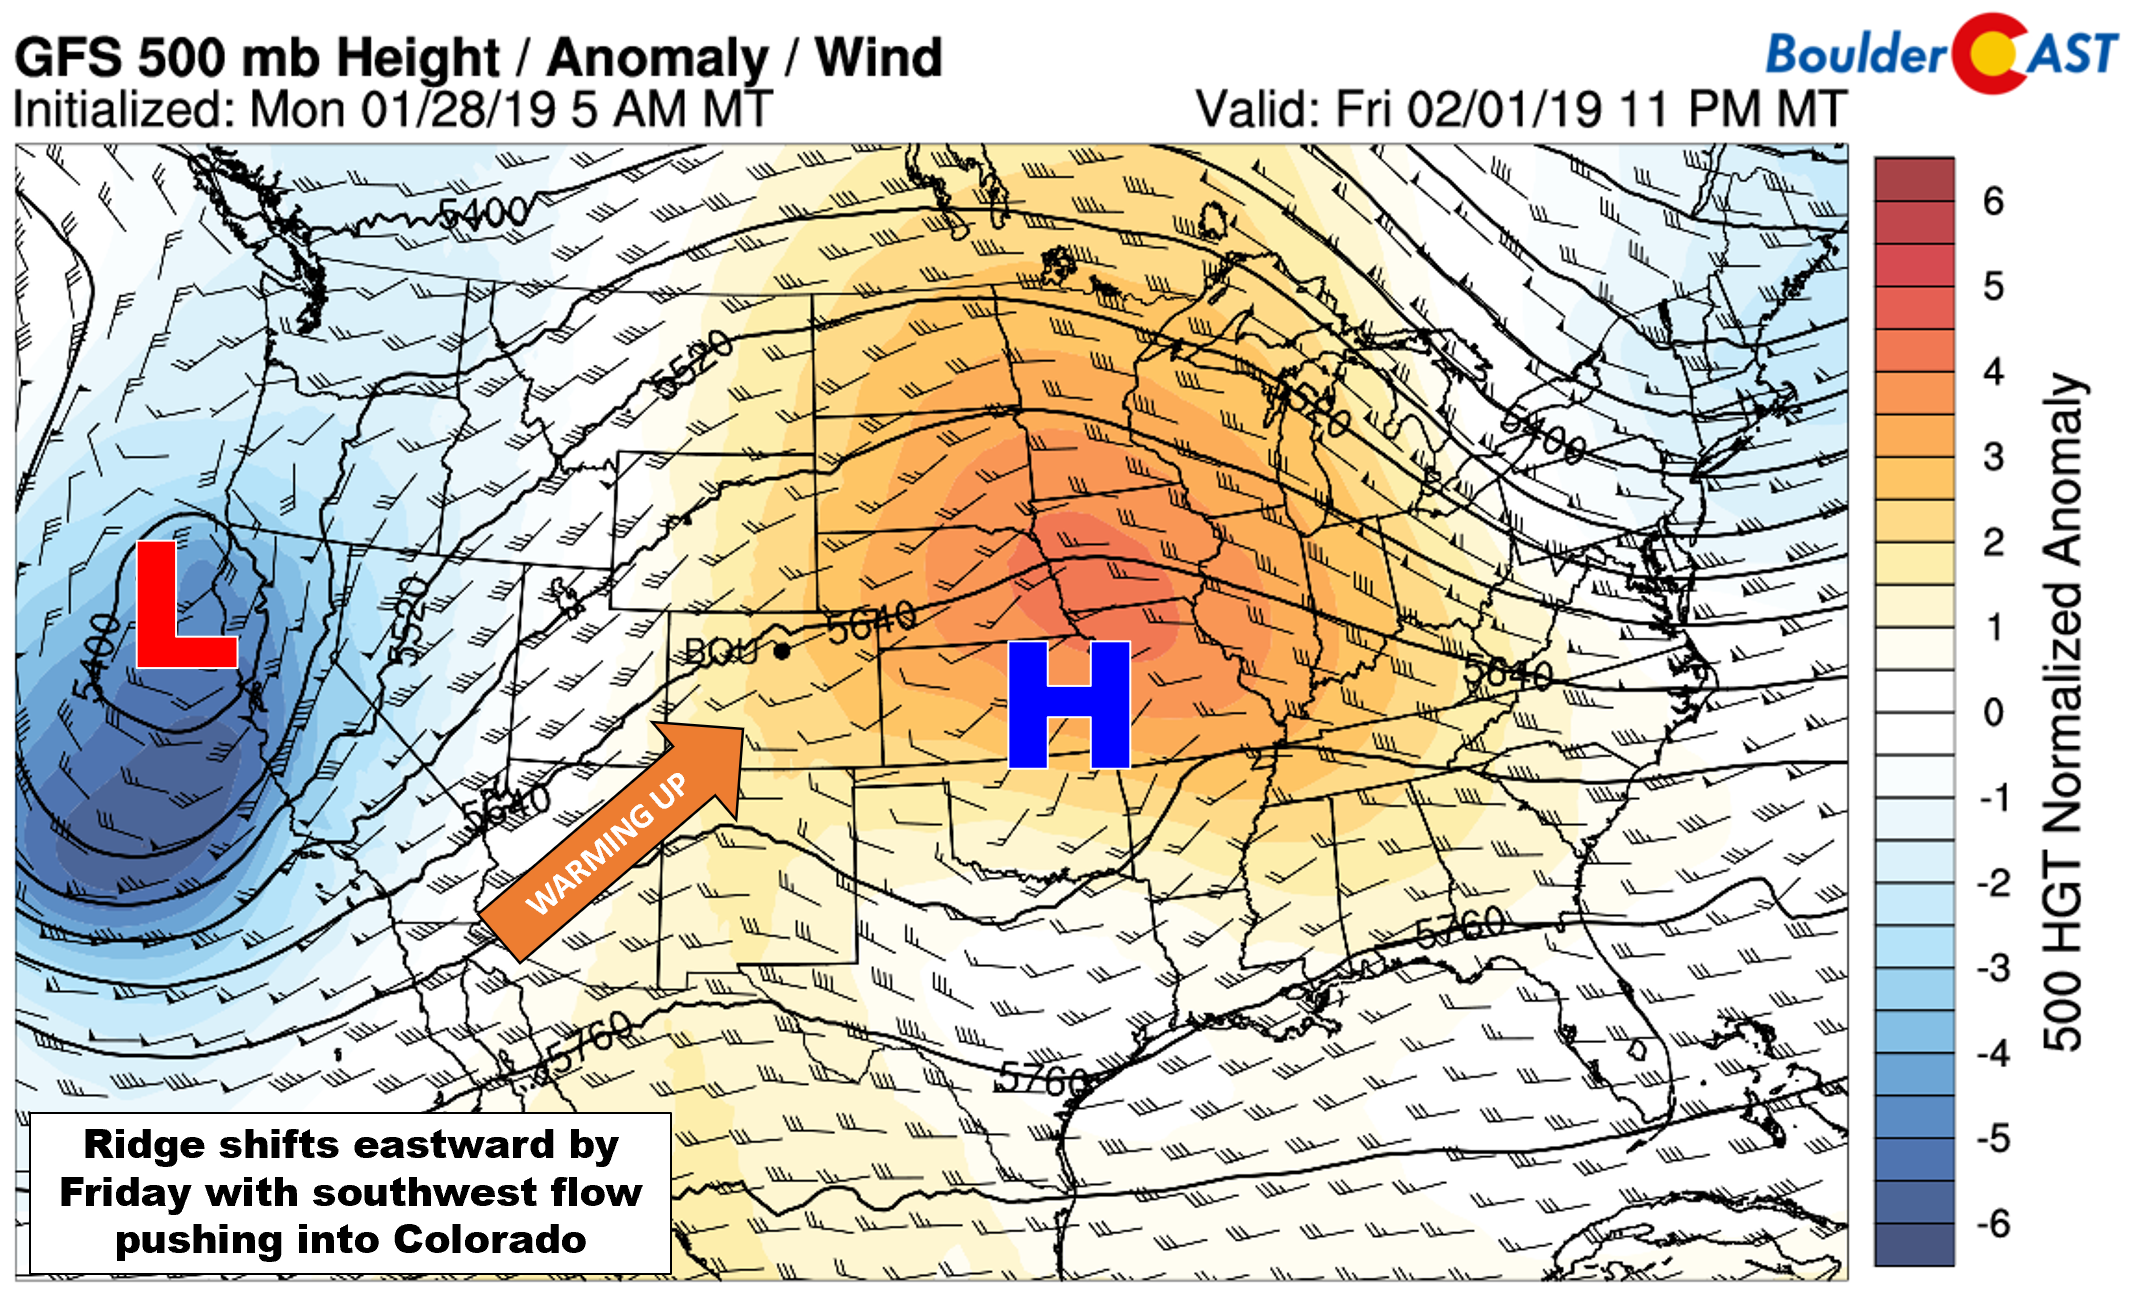
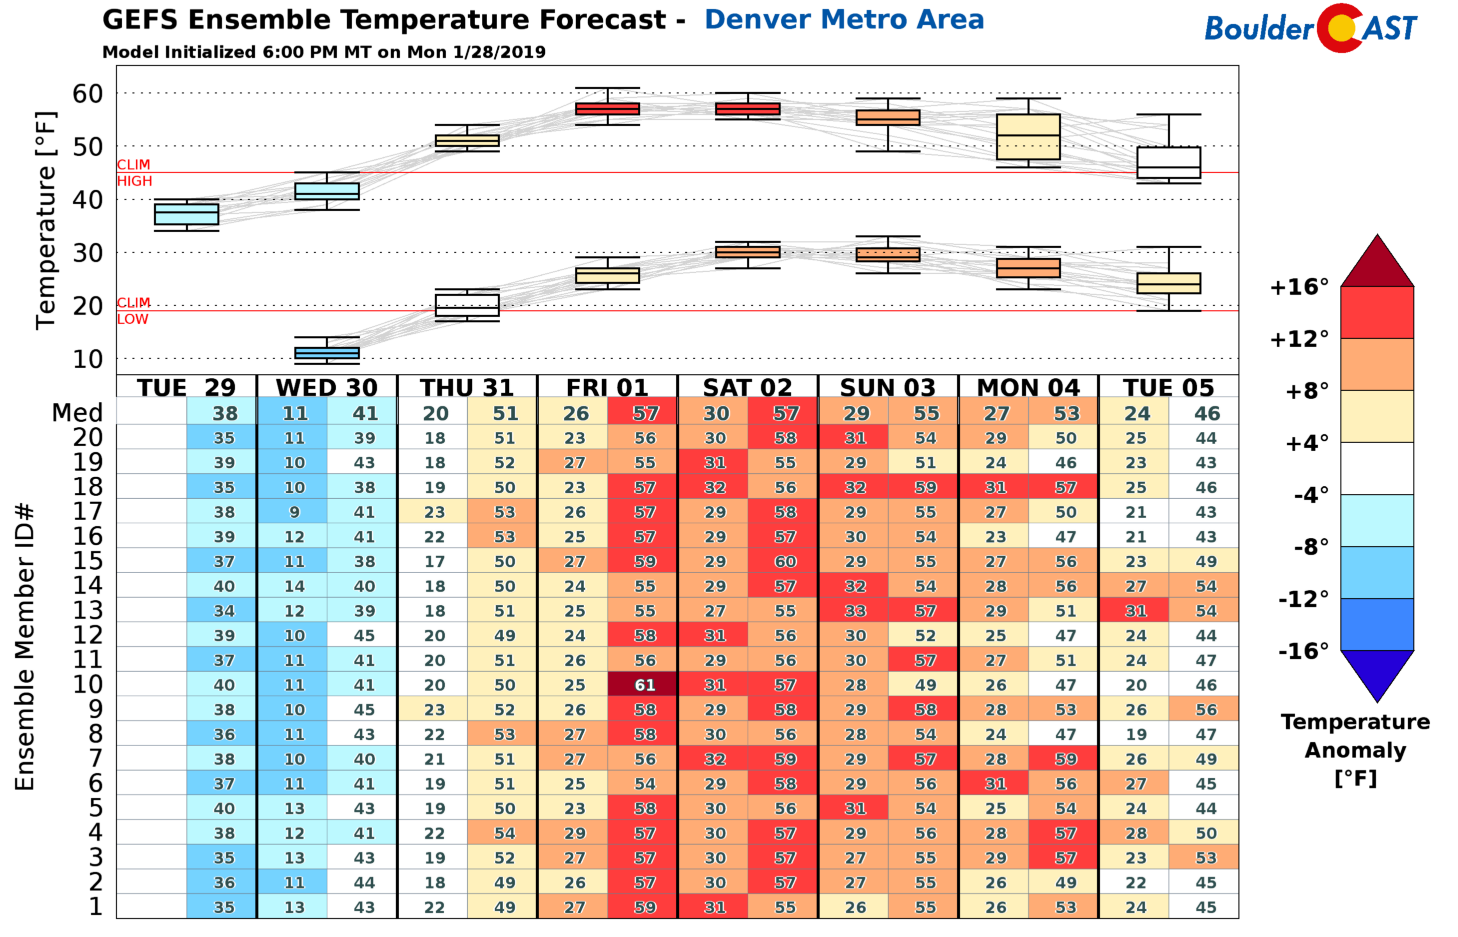
Thus, we’ll see a nice warming trend the rest of the week with 30’s today leading to 40’s Wednesday and 50’s Thursday and beyond.
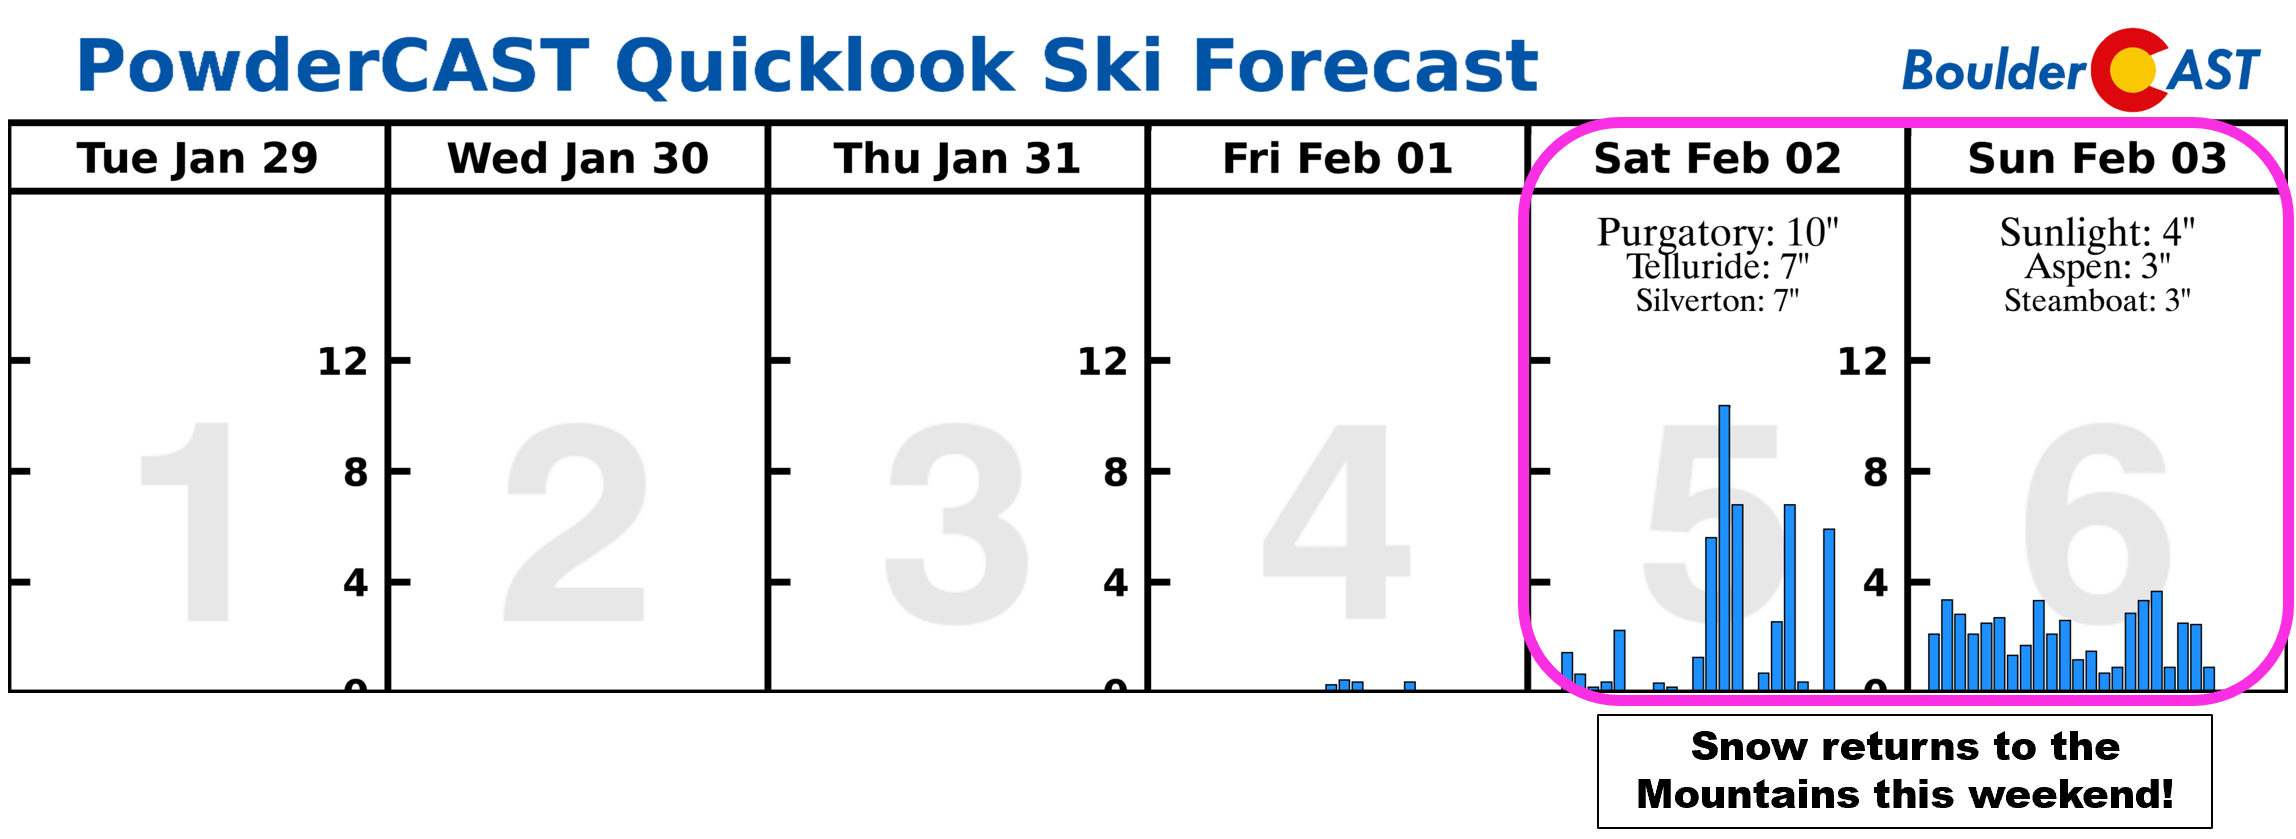
As you may noticed, a trough could be coming ashore Friday night and then moving across Colorado late in the upcoming weekend. It’s not something worth discussing right now as uncertainty is high, but this system is currently our next chance of precipitation in the Metro area. At the very least, we should see snow return the High Country over the weekend.
Whether or not some of this moisture splashes east onto the Plains come Sunday remains to be seen. We’ll keep an eye on it.
Have a good week. May your abundance of snow melt swiftly!
Forecast Specifics:
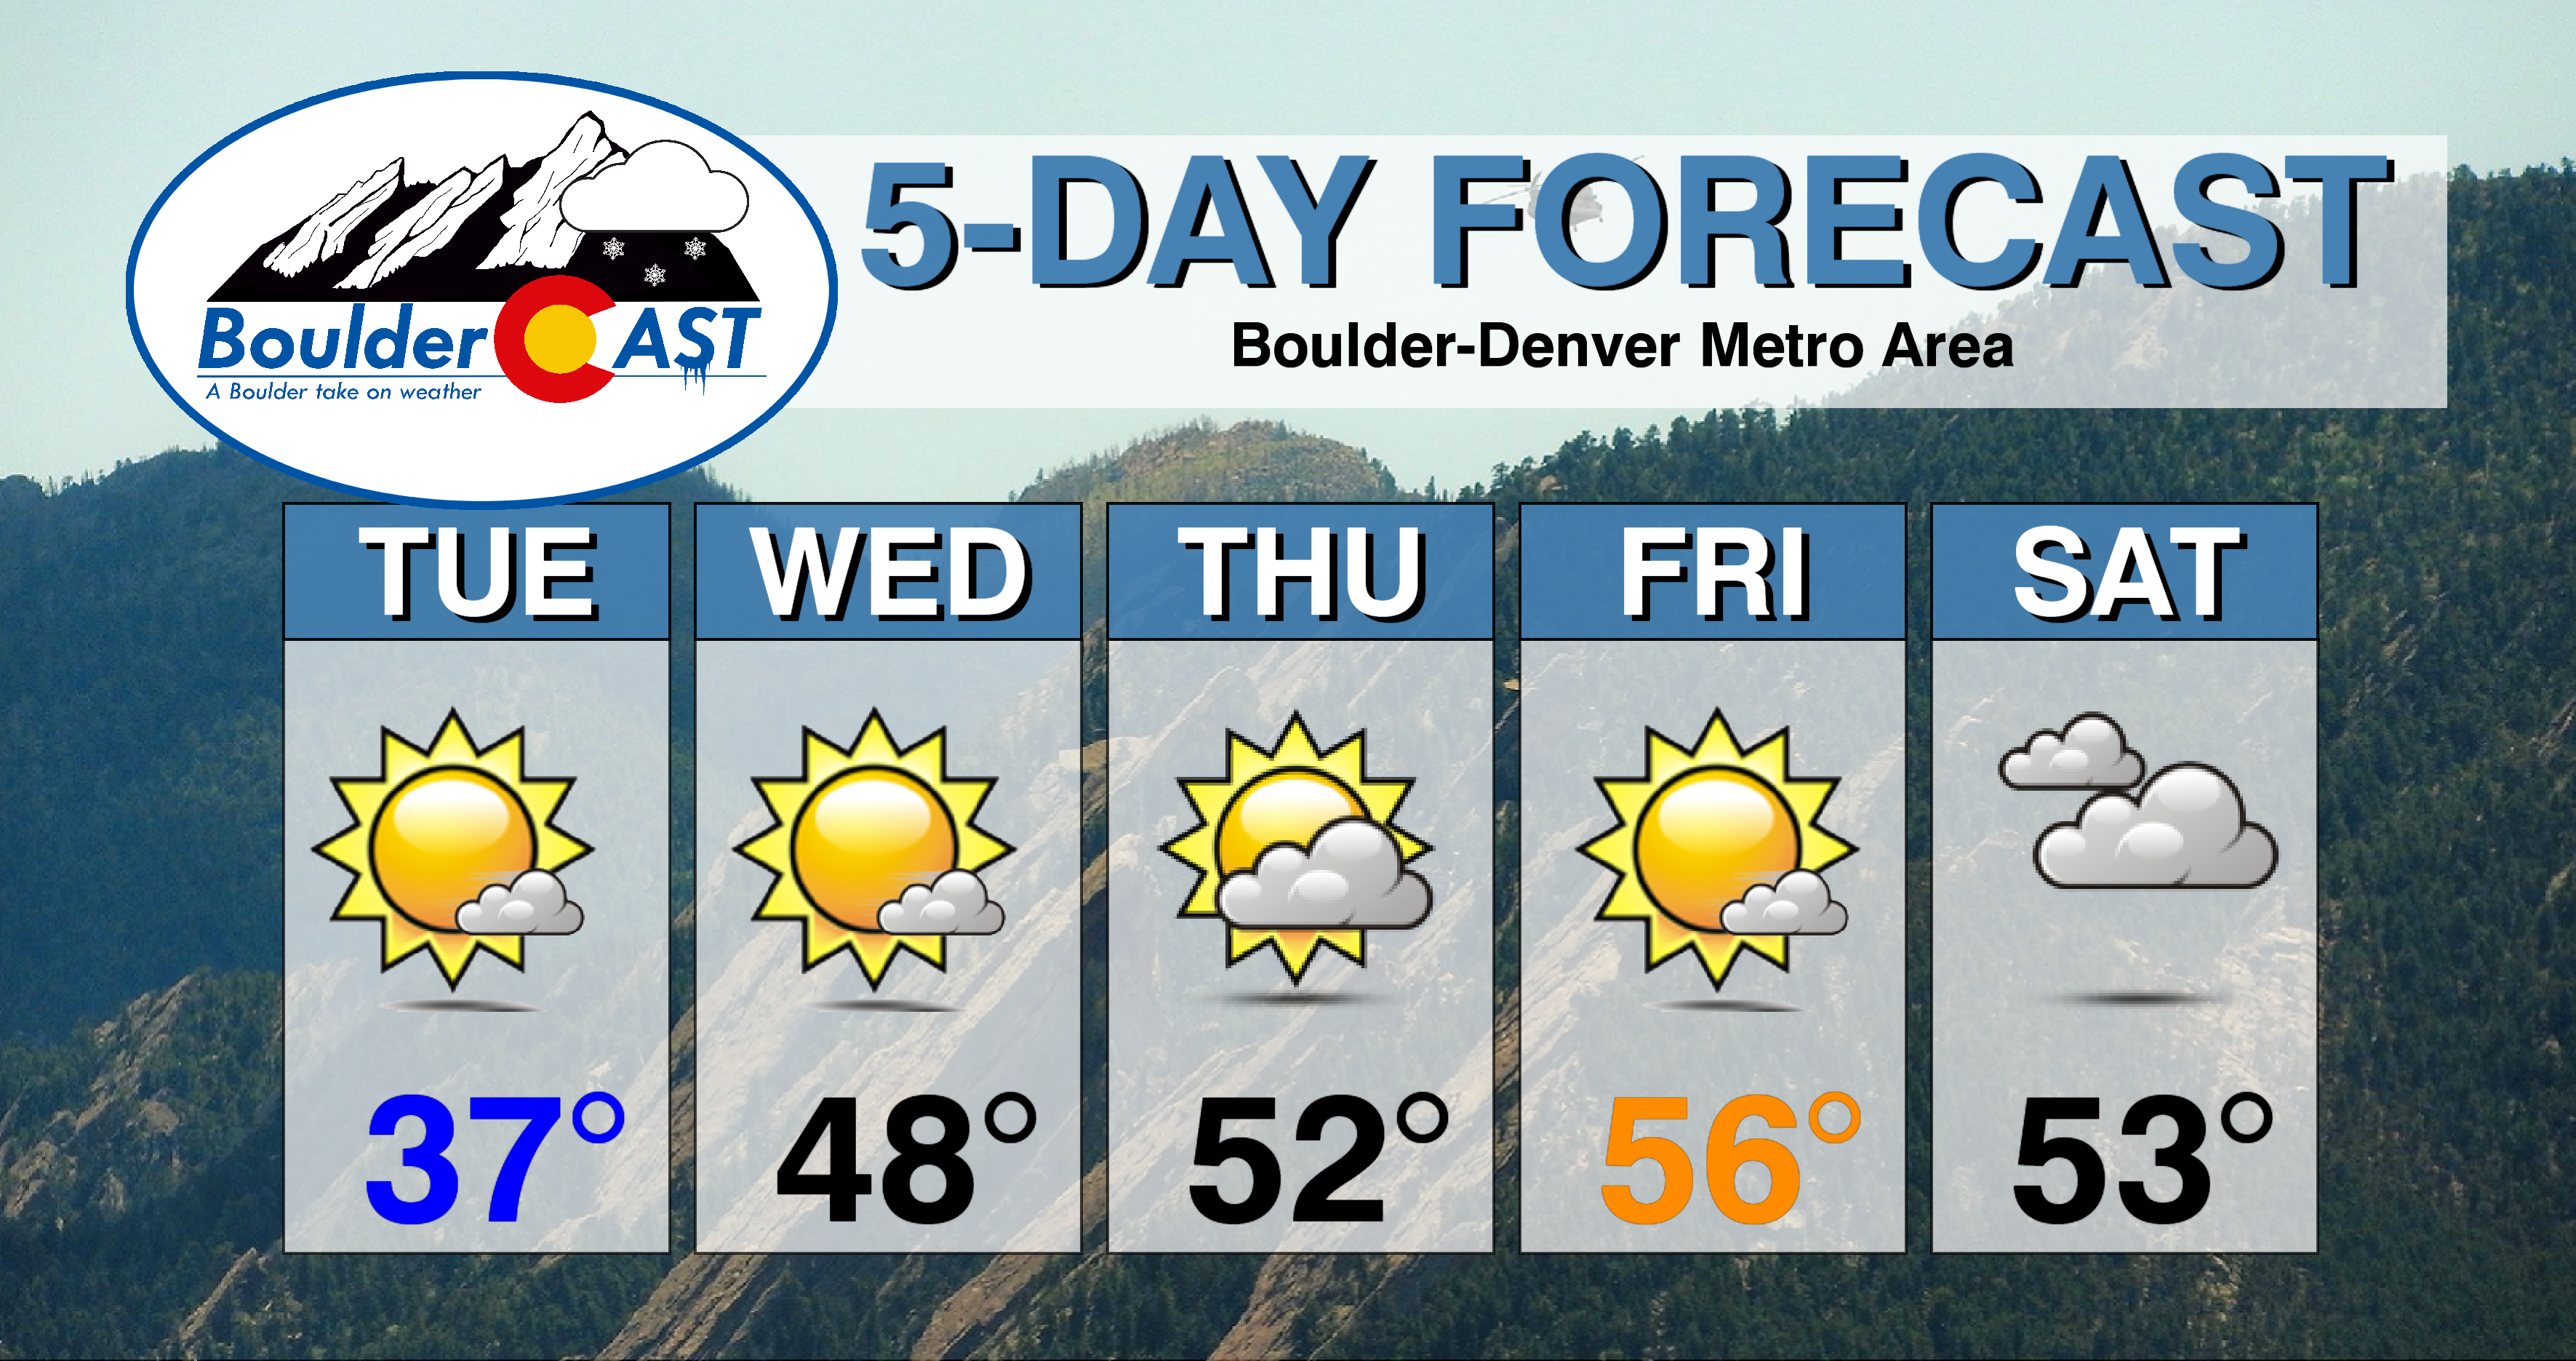
Tuesday: Mostly sunny and chilly with highs in the middle to upper 30’s on the Plains and in the middle 20’s in the Foothills.
Wednesday: Sunny in the morning with wave clouds building through the day. Highs in the middle to upper 40’s on the Plains and lower middle 30’s in the Foothills.
Thursday: Partly to mostly sunny and pleasant. Highs in the lower 50’s on the Plains and in the lower 40’s in the Foothills.
Friday: Mostly sunny and mild with highs in the middle 50’s across the Plains and in the lower 40’s in the Foothills.
Saturday: Generally overcast but fairly mild and dry. Highs in the lower 50’s on the Plains with lower 40’s in the Foothills.
High Country: Mostly sunny to at times gusty conditions will exist in the Mountains through Friday with temperatures moderating through the week. By late Friday, moisture will be on the increase from southwest flow ahead of an incoming trough. This will spread snow showers into the Mountains of southwest Colorado first on Saturday, then likely the rest of Colorado late Saturday into Sunday. Check PowderCAST for updated forecasts for all the Colorado ski resorts.
DISCLAIMER: This weekly outlook forecast was created Tuesday morning and covers the entire upcoming week. Accuracy will decrease as the week progresses as this post is NOT updated. To receive daily updated forecasts from our team, subscribe to BoulderCAST Premium.

.
Share our forecast!


You must be logged in to post a comment.