On paper, the 2015-16 super El Niño became everything that it was forecast to be, with water temperatures across the equatorial Pacific Ocean warming to near-record levels. However, the location and extent of the warming, and the global impacts, have been anything but typical. We discuss how well our last El Niño forecast verified and the outlook for the remainder of our winter season. What can Boulder expect in the way of precipitation, snowfall, and temperatures heading forward? Read on to find out.
Reviewing our autumn outlook
Last time we checked in on El Niño back in late September, we explained just how misconceived the impacts are across Colorado. We stressed big snows, not necessarily more snow. Up until now, that has been mostly the case. We are sitting comfortably at just a few inches above normal for seasonal snow, having had two big storms (11″ on 12/15/15 and 18″ on 2/1/16) comprise a large portion of the total.
Here are the specific predictions that we made, taken from our previous post. Red text details how well each prediction ultimately verified.
Projections made in late September 2015:
- A strong El Niño is here to stay through the end of the year (at least), currently sitting as the second strongest El Niño on record [Verified, though that was an easy one]
- The Climate Prediction Center (CPC) makes no prediction for temperature in the fall, but El Niño statistics hint that temperatures could be a bit below normal [Partially verified. Temperatures well above normal in October, then below normal for November and December]
- October has the best odds to see a big snowstorm [Bust! No snow at all this year in October. Too warm], but overall, less snow is generally observed during El Niño years in fall [Verified. Ended December 6″ below normal in snow for the winter]
- The CPC is forecasting elevated chances of a wet (i.e. snowy) autumn and we agree [Verified. Oct/Nov/Dec were all well above average in precipitation. Though at times, it was too warm, so that didn’t necessarily translate into snow]
Not bad. Precisely forecasting conditions in direct relation to El Niño is near impossible. It’s mostly a statistics game. We are happy with our last outlook, and would be satisfied if our next one verified just the same.
El Niño update & forecast
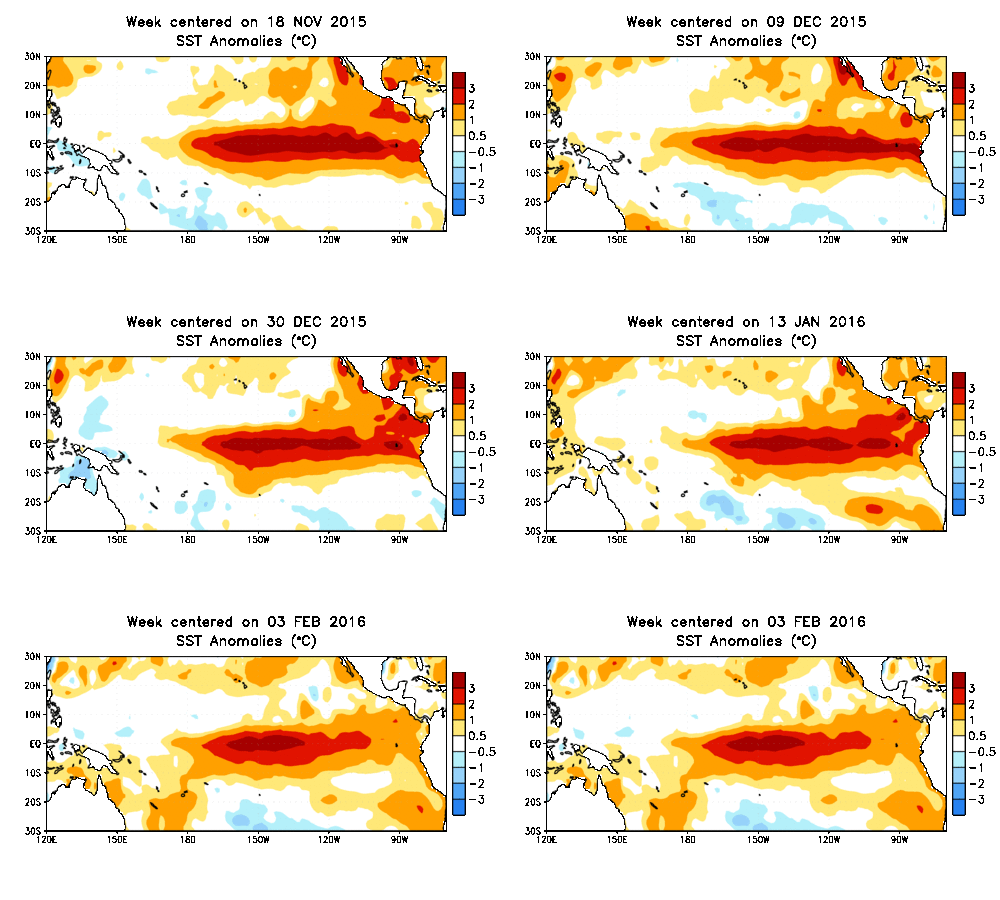
By many metrics, the current El Niño is the strongest ever recorded. By others, it ranks as low as third. The most commonly used gauge is the Oceanic Niño Index (defined by the temperature anomaly in a region in the east central Pacific Ocean called NINO3.4). Temperatures in this region this year just edge out 1997-98 (the previous #1 El Niño), technically making this year top-dog. However, warming in the far eastern Pacific is much less when compared to 97-98. More of this year’s warmth is shifted westward (which you can see in the loop at the top of this post; the warm pocket is well offshore from South America now), making for a rather unique situation. An El Niño of this magnitude with this heat distribution has never been observed!

Temperature anomaly in several regions across the Pacific Ocean. This year exceeded 97-98 in some areas, but lost the battle in others. Arguably, though, 2015-16 won the most important region, Niño3.4 (second panel down).
Whether it is officially the strongest ever really doesn’t matter, as our current El Niño has already peaked and begun it’s swift demise. Model guidance suggests a rapid weakening over the course of the next several months, likely returning to neutral by early summer and flip-flopping to a (possibly moderate) La Niña by the end of the year.
We see this rapid shift from strong El Niño to moderate or strong La Niña in the historical ENSO Index record. In the time series below, notice how the large red peaks (El Niños) are often immediately followed by comparably large blue dips (La Ninas). Certainly this isn’t always the case, but based on model forecasts, it appears to be the way we are headed.
Nonetheless, for the remainder of our snowy season, it is almost guaranteed a moderate to strong El Niño will be in place.
Outlook for the rest of winter
Snowfall
Let’s dive into Boulder’s historical weather record and see if there are any significant El Niño signals in the next few months!
The figure below shows box-and-whisker plots of snowfall for Boulder for the monthly totals of February, March, and April. The black box-and-whiskers contain monthly snowfall totals for all years, stretching back to 1950. The orange plots show only the months for years where El Niños were occurring, while the red plots only represent months where moderate (or stronger) El Niños were present. The numbers at the top of the figure indicate how many years those particular conditions occurred (data from official Boulder climate site at NOAA).
Both February and March show significant (and opposing) relationships between snow and moderate/strong El Niños. In February, the mean and median snowfall decreases quite a bit relative to normal. In fact, 4 of the 7 years that these conditions were present had less than 6″ of snow during the entire month. Only two years had (slightly) above normal snowfall. 2016 would completely fit this trend, if not for the 16.8″ of snow that already fell on February 1st. With the current ridging pattern anchored across the West, it wouldn’t be surprising if we are snow-free until March. The first hint of a pattern change to possibly support snow (on the Plains) isn’t until the final days of the month.
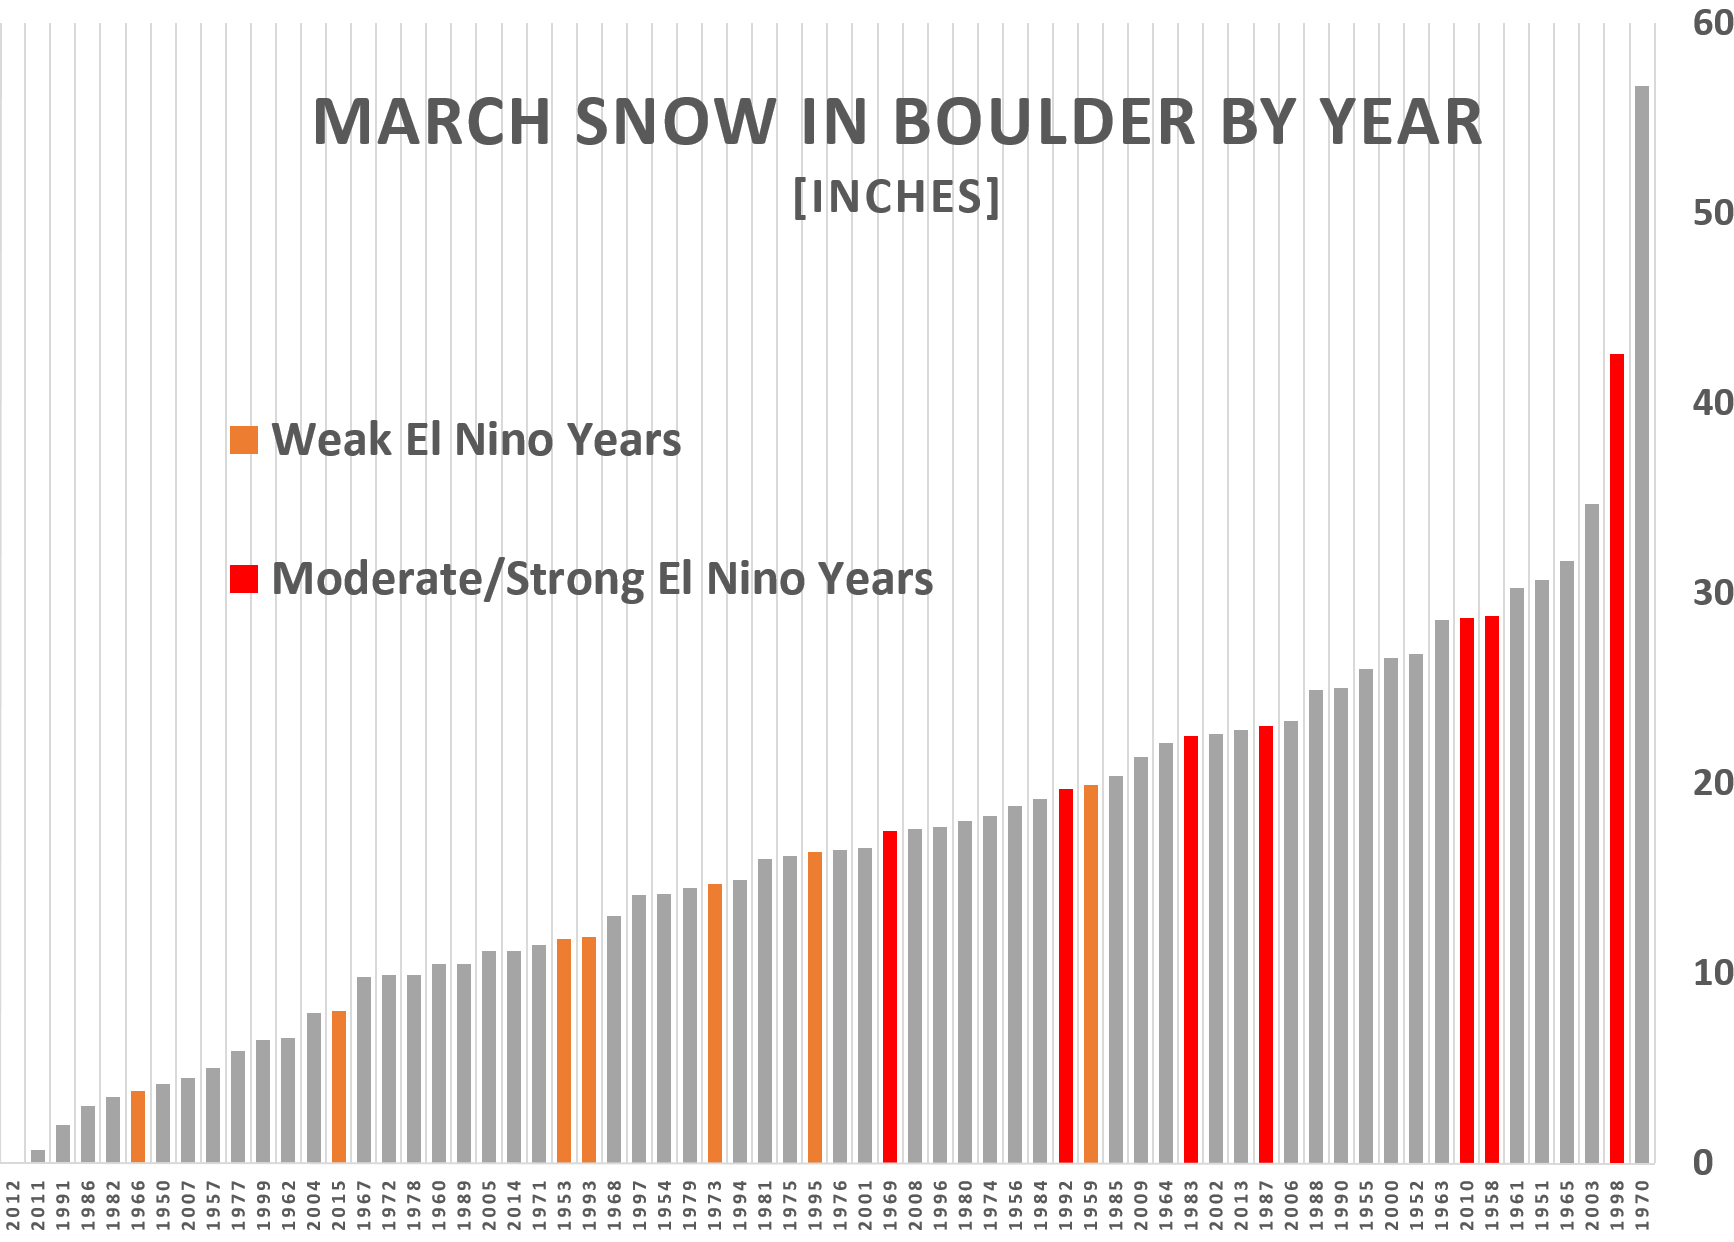
To the contrary, after a typically dry February, moisture surges back into Colorado for March! Median snowfall increases substantially, from 17″ to 25″, compared to normal. A closer examination of March snow in Boulder can be seen below. Moderate to strong El Niño years are colored in red.
Average March snow in Boulder is around 16″. Each and every year with a potent El Niño in place has exceeded this value, which bodes well for snow enthusiasts!
The top five “red” snow Marches are detailed below:
- 1998: Three big snow events (8″, 10″, and 21″), dry otherwise
- 1958: Gloomy, extended periods of light snow. Biggest single day snow total was just 4″. 15 days with measurable snow
- 2010: Two big snow events (12″ and 15″), dry otherwise
- 1987: A series of small storms (4″, 6″, and 8″)
- 1983: Three decent storms (5″, 6″, and 12″)
April shows a less clear-cut relationship. While median snow does increase, the mean remains nearly the same, and the spread increases relative to normal. 2 of the 6 years with moderate/strong El Niños in place had no snow at all. However, the other four years all had well-above normal snowfall (16″ or more). This pattern suggests a ton of April snow, or none at all. Hmm…
Once we start getting into March and April, the threat of warmer air eating into our snow totals returns. However, precipitation (rain and melted snow) shows more-or-less the same relationships with El Niño as snowfall, so we won’t go into detail on that topic here.
The CFSv2 climate model is predicting above normal precipitation across Colorado in both March and April, which generally agrees with our thoughts and needs to be taken into consideration as well.

CFSv2 (climate model) forecast for precipitation anomaly in March and April 2016. Above normal precipitation expected across most of Colorado both months, especially in March.
Temperature
Here is another box-and-whisker plot, but this time for mean monthly temperature.
We see a noticeable relationship present once again in February and March. In February, mean and median temperature increases more than one degree under moderate El Niño conditions. March has the strongest temperature signal, with a drop of more than 2 degrees in median temperature. This makes sense given the snowfall relationships outlined above: February = warm/dry, March = cold/snowy.
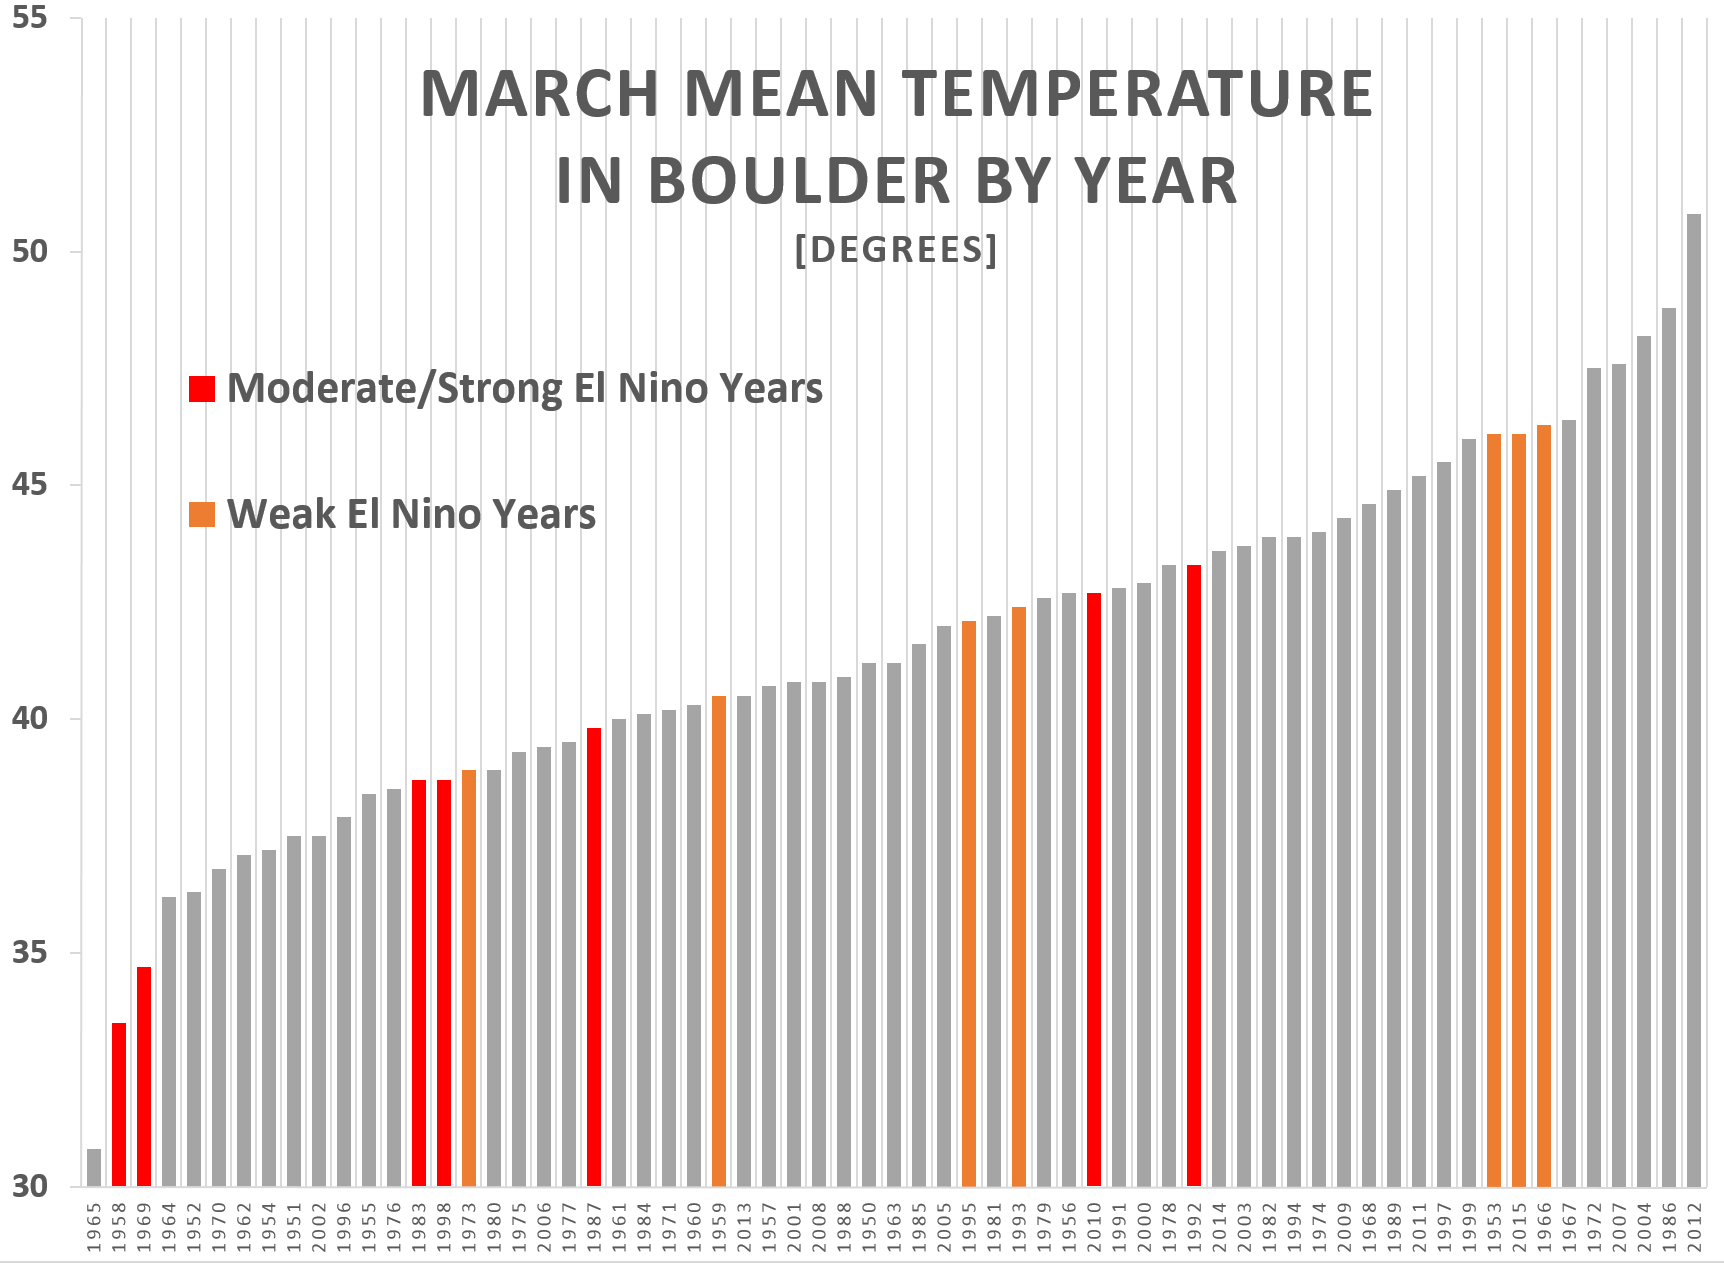
Below shows Boulder’s mean March temperatures since 1950. Two of our three coldest Marches happened in strong El Niño years! There is a definitely bias towards cold (red to the left) visible in this figure.
In April, median temperature drops a bit relative to normal, but the mean is relatively unchanged.
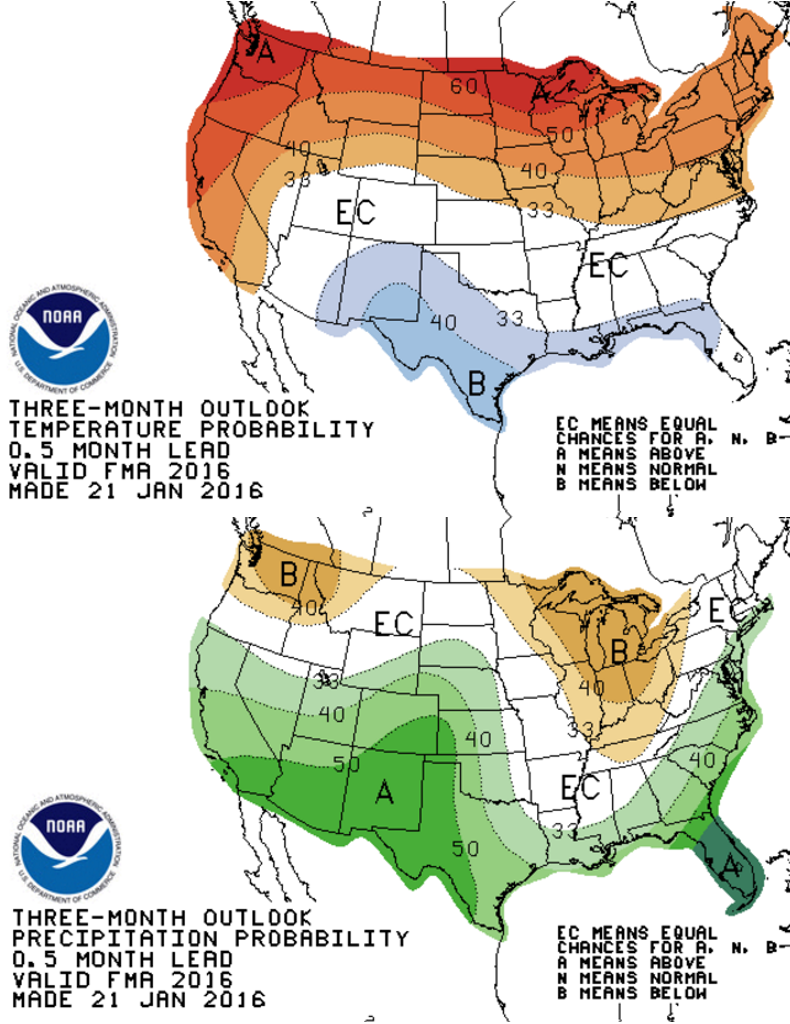
The Climate Prediction Center posted their 3-month outlook for FMA (Feb-Mar-Apr) about four weeks ago, placing strong faith in El Niño analogs and the long-range climate model guidance. Their maps for temperature and precipitation are shown below.
Their outlook agrees quite well with our thoughts, which we summarize below:
- A strong to moderate (but weakening) El Niño will persist at least through April
- February will likely end up well above normal for temperature, with very minimal snow during the remainder of the month
- For March, we are expecting above normal snowfall and below normal temperatures. Our best odds of a big snow storm will be this month.
- April is a little more ambiguous, but we will hedge towards slightly below normal temperatures with near normal or slightly above snowfall.
- For the February, March, April period in general, we are forecasting slightly below normal temperature and above normal snowfall.
It will be interesting to see how ENSO trends through the spring and into summer. We’re a little worried that things could dry out significantly by late May into the heart of summer. Though this is just speculation based on the historical record and climate model forecasts. We’ll be sure to keep to updated as things evolve though the first half of 2016.
If you enjoy warm and dry weather, get out there and savor it for the next couple weeks. When it gets to March, we may be singing “Let it snow, let it snow, let is snow!”
—-
For more in-depth discussion on this topic, be sure to check out Episode #24 of the BoulderCAST Podcast.





You must be logged in to post a comment.