Earth. It’s really cool, but it’s warming up faster now than it may have ever warmed before. Unless the buzz from last week’s East Coast blizzard has turned you into a climate change denier, you are likely already on-board with this sentiment. With 2017 now behind us, we take a look back at temperatures throughout the year for the globe, Colorado, and Boulder.
NOTE: This content was exclusively available to Premium members for at least seven days. Why is this the case?
A Global Perspective
The official 2017 global temperature analysis, a collaborative effort beteween NOAA and NASA, isn’t quite finished yet. We’ll cut them some slack, nowadays they’re obviously busy fending off all the hyenas swarming their funding…
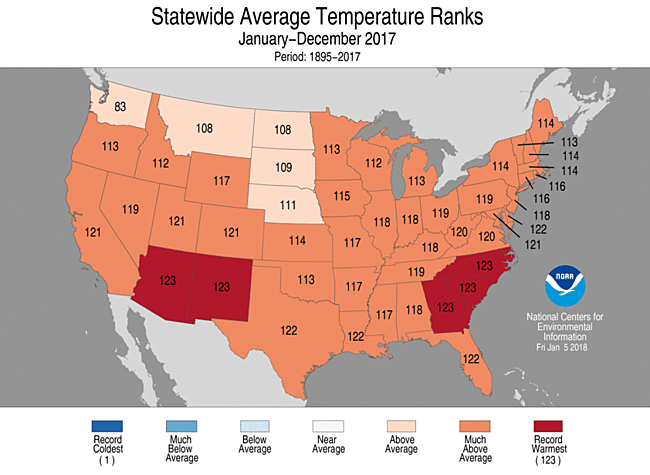
Even without the final report, there is good indication that 2017 concluded as Earth’s SECOND warmest on record, barely being outdone by 2016. The global temperature percentile map below for the first 11 months of the year shows above “average” temperatures worldwide, with just a few tiny oceanic regions experiencing cooler than normal temperatures.

The graph below shows Earth’s temperature trend over the last fifty years or so. Each point is color-coded by the dominant ENSO pattern of that calendar year. Interestingly, we see a warmer overall planet during El Niño years (at least the air at the surface). This is somewhat misleading as ENSO tends to maximize in Northern Hemisphere winter and tail off over the summer. I’d be more interested to see if this holds up with “years” divided in June or July, instead of with the calendar year. This, however, is a topic for another day!
The main take-away here is that 2017 will likely come up just shy of 2016 in terms of overall global mean surface temperature.
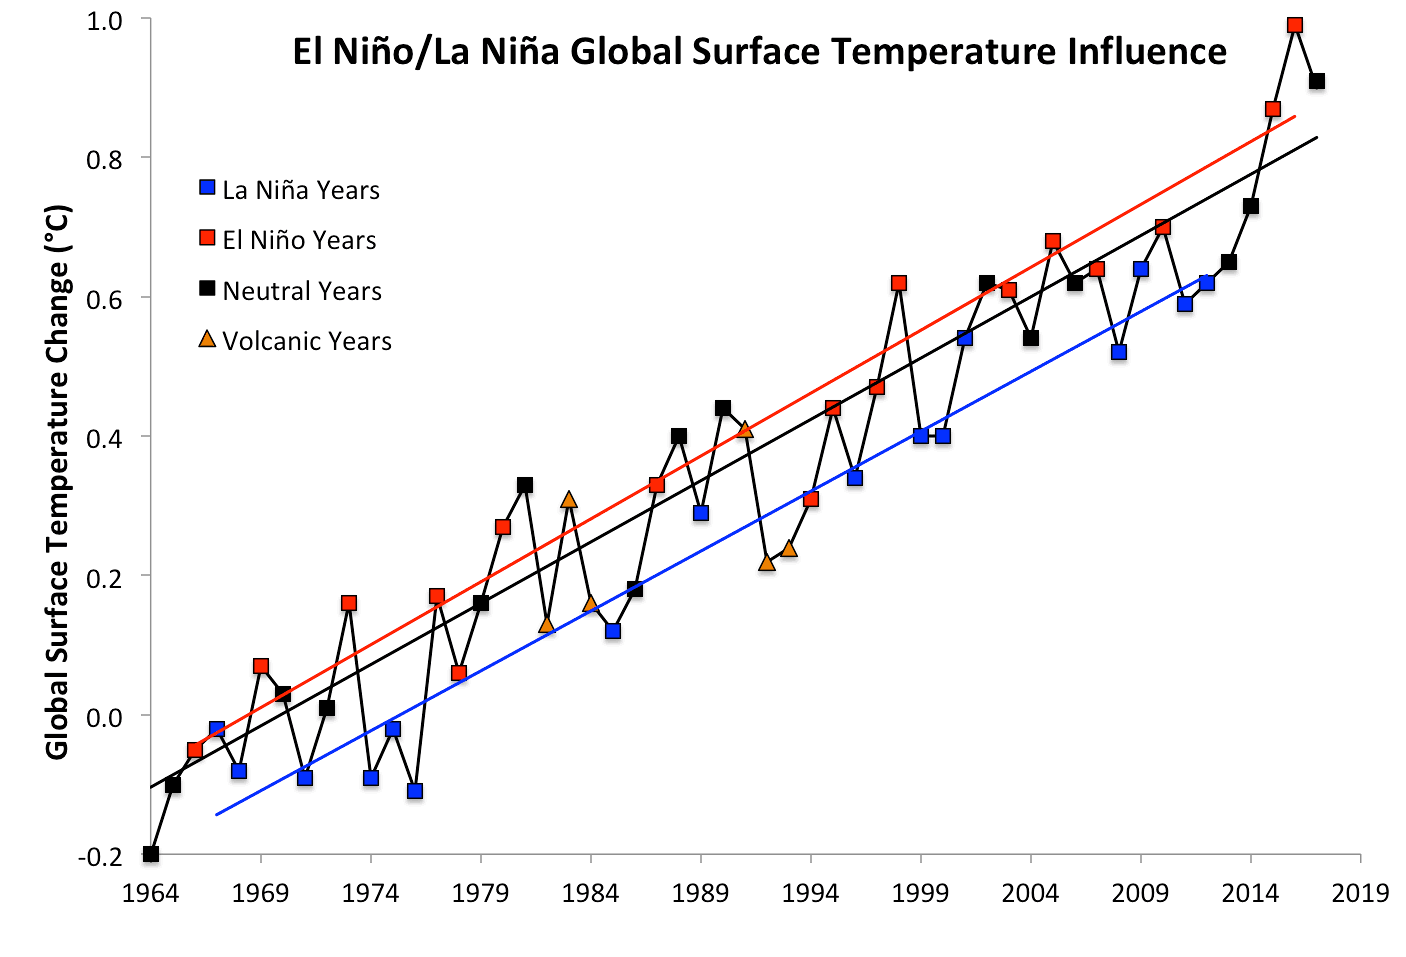
1964–2017 global surface temperature data from NASA, divided into El Niño (red), La Niña (blue), and neutral (black) years, with linear trends added. Source: SkepticalScience
While this long-term temperature trend may not be perceivable easily in every location, positive feedbacks in the Arctic make the changes crystal clear (polar bears don’t like Arctic Amplification). Though Arctic sea ice extent did not reach an all-time minimum in 2017, it was the year with the lowest annual average extent. The graph below also shows increased variability since 2005. This variability results from thinner, less stable sea-ice that now makes up most of the ice coverage in the Arctic. Mutli-year sea ice (ice that survives through the summer to grow thicker the next winter) is quickly becoming extinct….

Source: National Snow and Ice Data Center
Having lived in Greenland on-and-off for several years during my master’s research, the Arctic will always hold a special place in my heart. With how rapidly things are changing there, I wonder what the country will be like in 50, 20, or even 10 years. It saddens me to think that future generations will not get to experience such a unique and mystifying place as Mother Nature intended.
Closer to Home
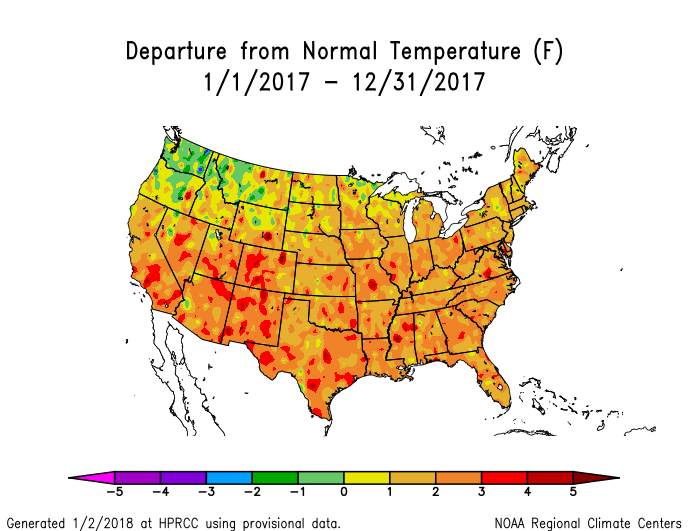
Scaling our perspective back, in the United States, temperatures through all of 2017 were largely above normal by 1 to 3° F. The only exception was slight and encompasses part of the Pacific Northwest. Colorado was more-or-less entirely above average overall for 2017.
When considering a full calendar year of data, like the maps above, we largely filter out the variation caused by “weather” (individual events or storm systems) and capture longer-term synoptic patterns…think on time-scales of a few weeks or so. Not nearly long enough to touch on climate change alone. However, the graph below shows a time series of annual average temperatures for all of Colorado since 1895. The trend is clear. The Rocky Mountain state’s temperatures have been on the rise steadily since the 1970’s. This shouldn’t be news to anyone…move along.
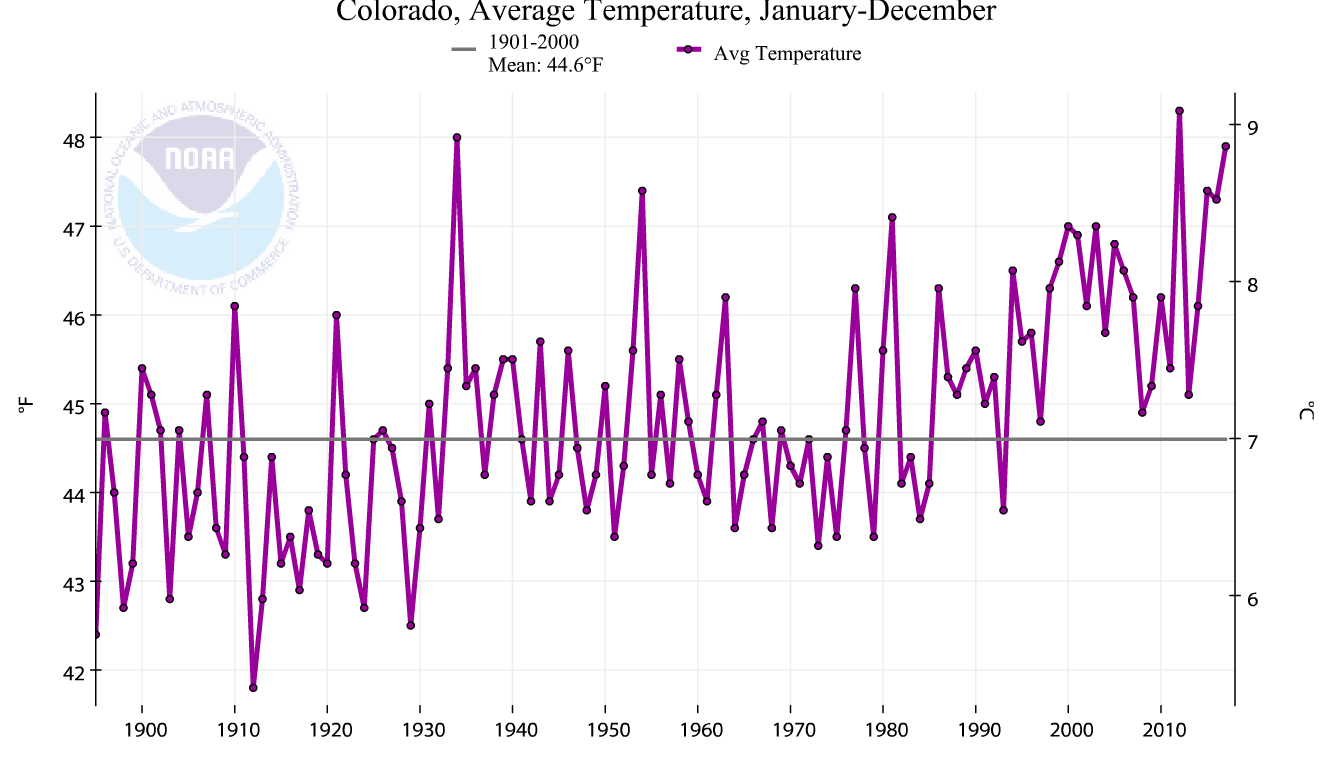
It should be noted that the graph above includes ALL of 2017. Therefore, we can definitively say 2017 was Colorado’s THIRD warmest. This puts 2017 about one half degree Fahrenheit behind 2012, a year where our state was literally on fire more days than not.
The three graphs below show a year’s worth of daily temperature data for Denver in 2017 (apologies about the Celsius). The remarkable graph in the middle depicts mean temperature departures from average through the year, with a 31-day low-pass filter applied (i.e. moving average). The lack of any blue on this graph says there were no extended periods of generally cold weather in 2017 for us.
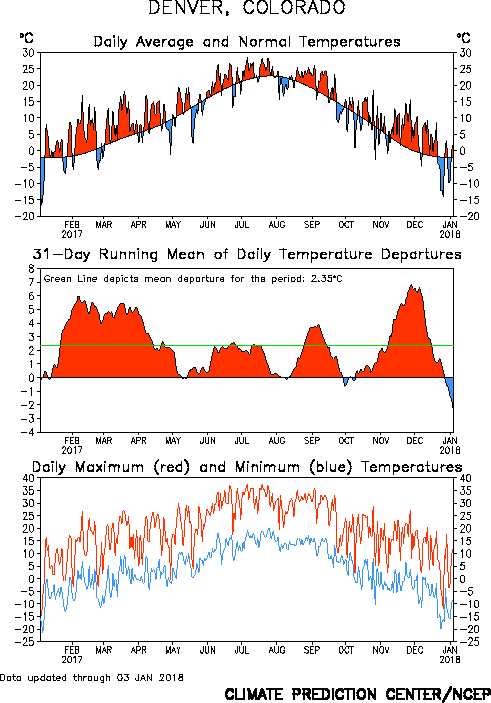
The long-lasting warmth at the beginning of 2017 made for a disappointing spring snow season across the Front Range, while the most significant peak in warmth in November and early December nearly broke the “consecutive days without measurable snow” record.
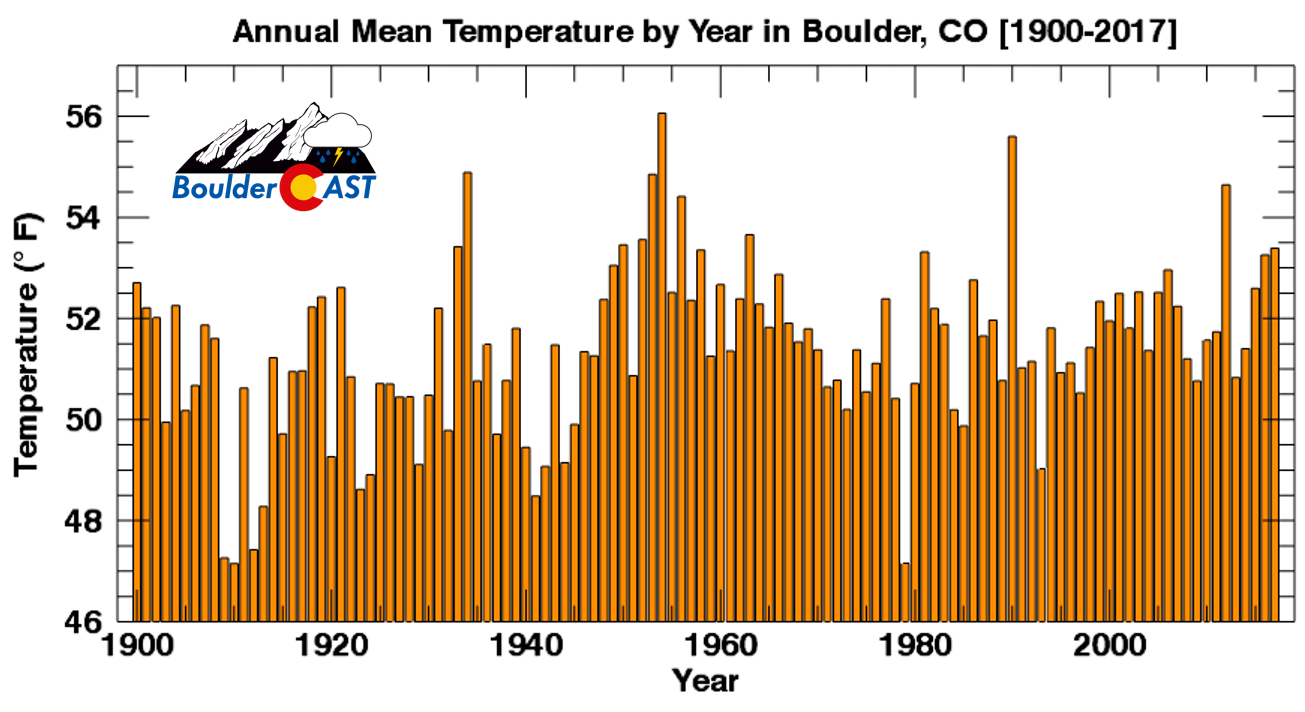
Boulder finished the year with an annual average temperature of 53.3°, well above the climatological value of 51.7°. This puts 2017 at 11th place in the historical database of warmest years in Boulder. At BoulderCAST Station, we recorded an annual mean of 53.4°, with a max of 98° on June 20th and a minimum of 0° on January 5th.
Here are a few of the daily temperature records from 2017…
- 14 new daily record HIGH temperatures
- February 10th (76°), 15th (67°), 16th (73°)
- March 15th (78°), 18th (80°)
- June 20th (97°)
- July 19th (100°)
- September 3rd (97°), 21st (89°)
- October 25th (85°)
- November 24th (72°), 26th (73°), 27th (76°)
- December 12th (68°)
- ZERO new daily record LOW temperatures
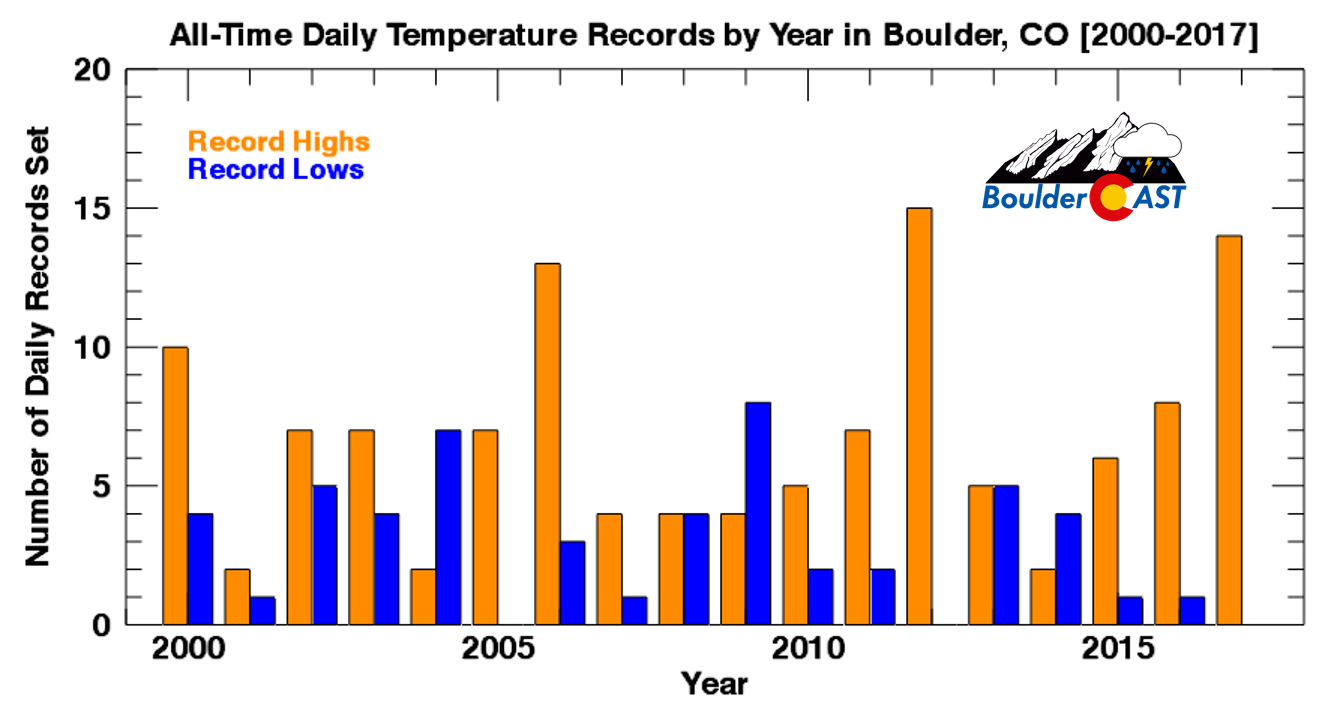
- 6 new daily record HIGH LOWS. “High low” records are when the minimum temperature for the date was the warmest.
- February 9th (54°), 10th (57°)
- March 16th (50°)
- October 20th (64°)
- November 24th (49°)
- November 27th (56°)
- 1 new record LOW HIGH. “Low high” records are when the maximum temperature for the date was the coolest.
- January 5th (8°)
We need snow
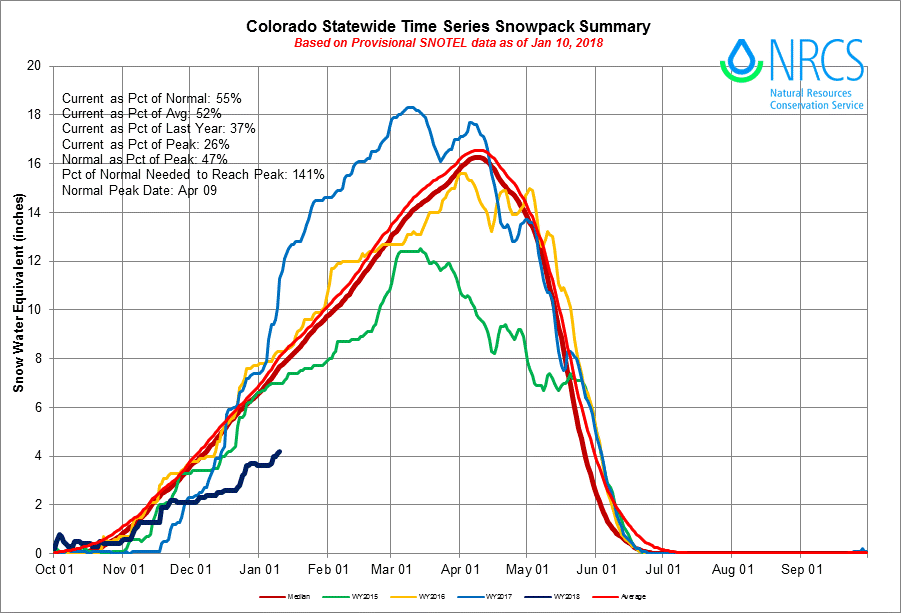
We need snowfall to arrive soon. Our snowpack statewide is at just 55% of normal right now:
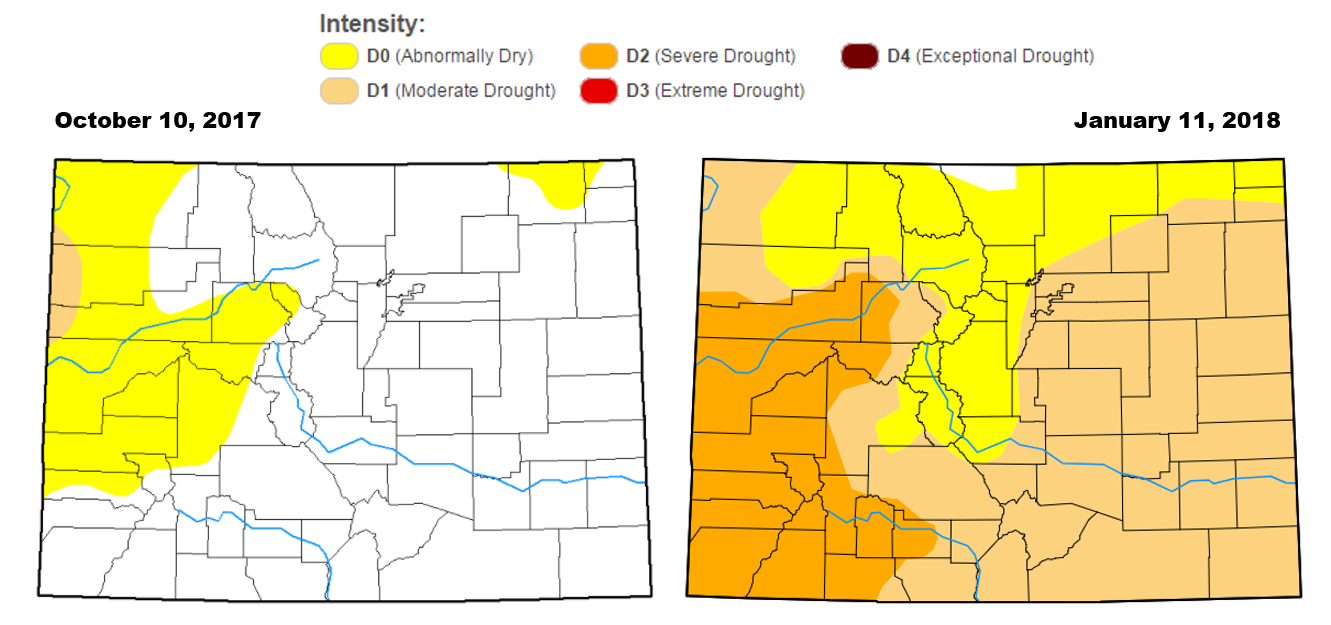
And drought conditions now encompass 78% of the state (including most of the Denver Metro area), up from 1% just three months ago! A severe drought is in place across most of the Western Slope.
We’ll have our outlook for the rest of winter in an upcoming post, along with an interesting twist! So stay tuned on that front! For now, be sure to enjoy the colder days while you can….our overnight low temperatures are already on the rise across the region, with our daytime high temperatures soon to follow suit.
.


You must be logged in to post a comment.