Not surprisingly, many of you are outdoor-oriented and we get asked this question a lot. If you look out the window and see low clouds or fog blanketing your area, there is a decent chance that some or all of the peaks just west of town are soaking in the sun, but not always. We walk you through the process of how to determine the elevation of the top of the cloud deck and how it relates to the hiking options near Boulder and Denver.
Low-level clouds and fog are not terribly frequent in Boulder or Denver mainly due to a lack of available moisture. However, under the right atmospheric setup, shallow moisture-laden upslope can infiltrate northeast Colorado leading to the development of a thin cloud layer near the surface. Sometimes this cloud layer extends all the way down to ground level, which by definition is fog. Low-clouds of this nature often occur following the passage of shallow cold fronts in the transitional seasons or winter, but also sometimes during the overnight hours following widespread rainfall.
While you may or may not be too familiar with Skew-T graphs, which are a staple of weather forecasting by the way, they are vital to identifying cloud layers easily, including the thinnest ones hugging the ground. For recent observational data of low clouds, we would recommend using one of the following two resources:
- University of Wyoming Upper Air Soundings: Change the “Type of Plot” to Skew-T and click DNR on the map for Denver
- NOAA Storm Prediction Center Soundings: For the most recent data, click the first picture of the USA that has “lots” of stars on it. Then on the next page, click the star over Denver.
Let’s step through the process to identify that coveted cloud top with a real-world example (or two).
Back on March 14, 2020, we did a hike during low clouds around mid-day in Boulder to the summit of Green Mountain which has an elevation around 8100 feet. Beforehand, we certainly checked the Skew-T from the 6:00 AM weather balloon launch at Stapleton Airport in Denver that morning. This was what we saw:
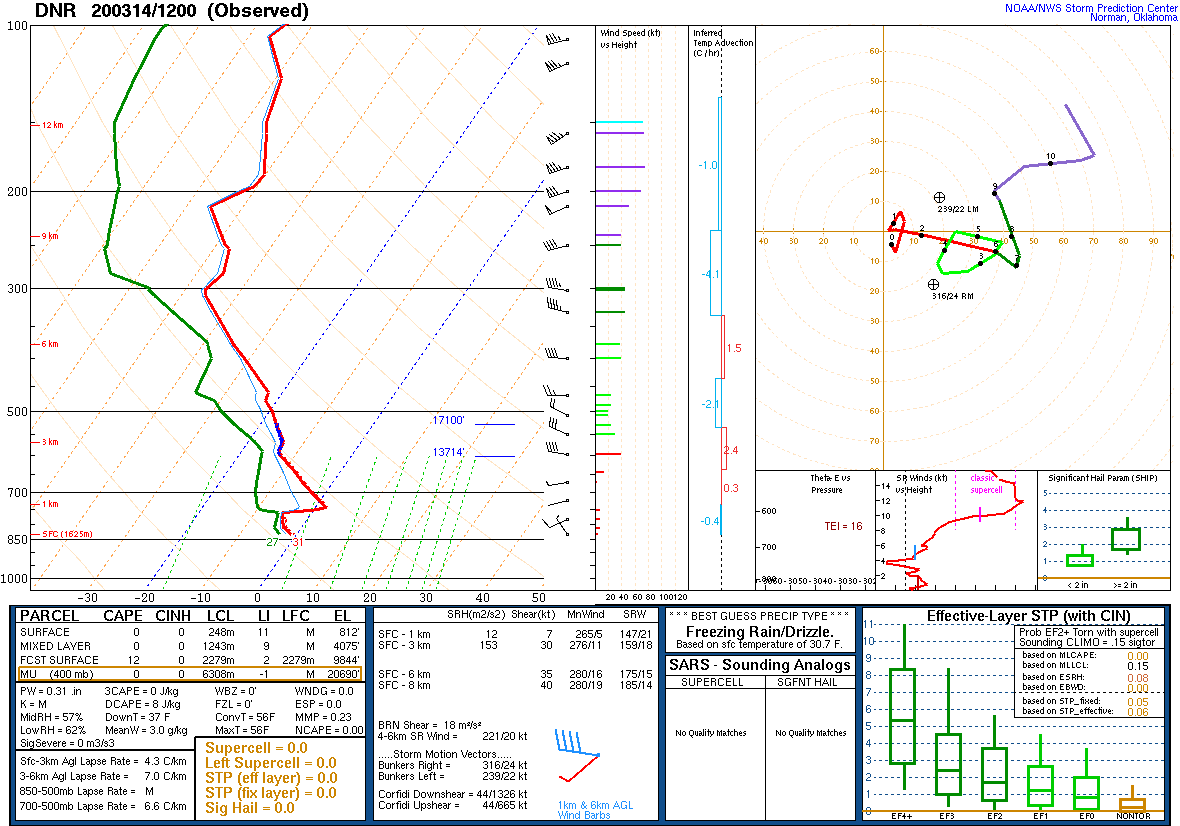
Ignore everything but the upper left graph, which is the Skew-T. If you are curious what the rest of the graphic is showing, see this help page. In the Skew-T, we see a saturated low layer where the green and red lines are almost touching one another (temperature and dew point). This is the low cloud we’re looking for! Then there is a sharp rise in temperature above this and a drop in moisture. This is called an inversion and is where we will find the cloud top. This graphic is difficult to gauge an exact height from, so we need to look at the actual data values, which is given for this time HERE.
Here’s is a look at the 6:00 AM data from March 14, 2020 for Denver:
 DNR   200314/1200

   LEVEL       HGHT       TEMP       DWPT       WDIR       WSPD
-------------------------------------------------------------------
  835.00,   1625.00,     -0.70,     -2.70,    325.00,      4.99
  813.74,   1829.00,     -2.65,     -4.29,    330.00,      8.00
  811.00,   1855.65,     -2.90,     -4.50,  -9999.00,  -9999.00
  782.73,   2134.00,     -4.04,     -5.13,    245.00,      8.00
  762.00,   2344.65,     -4.90,     -5.60,  -9999.00,  -9999.00
  753.00,   2438.00,     -0.27,     -8.53,    220.00,      9.00
  751.00,   2459.50,      0.80,     -9.20,  -9999.00,  -9999.00
  745.89,   2523.60,      2.00,    -10.00,  -9999.00,  -9999.00
  724.73,   2743.00,      0.10,    -11.20,    255.00,      2.00
  700.00,   3019.00,     -2.30,    -12.30,    260.00,      3.00
Pay attention to the TEMP field and notice how it drops with each successive line until the red one where it sharply increases. This is the inversion at cloud top and where the cloud would be gone. Then look at the corresponding elevation (HGHT), which is 2438 meters above sea level. This is ~8000 feet. The vertical resolution of the observations isn’t great, so we can also go back up one line to 2344 meters before the inversion, which would definitely be inside the cloud, to get the range of possibilities for cloud top. This equates to ~7700 feet elevation.
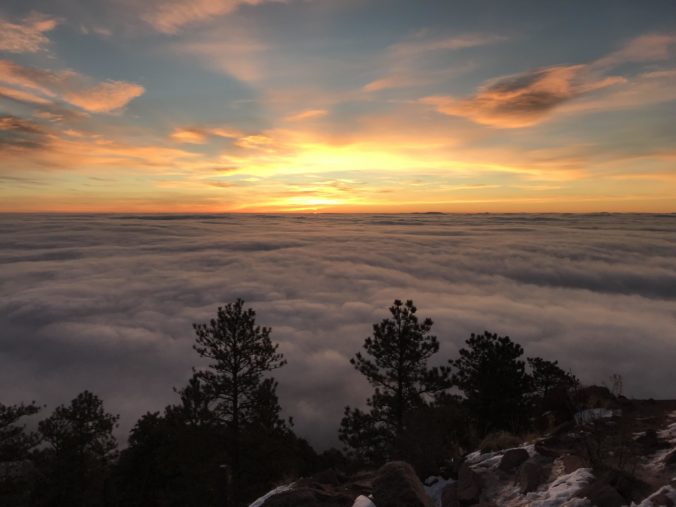
So based on the weather data, the cloud top on the morning we hiked Green Mountain back in March would be somewhere between 7700 and 8000 feet. Below was the view from the 8100-foot summit that day. We poked above the clouds on the final ascent just a few hundred feet from the peak. We’d say it was a good interpretation of the data!
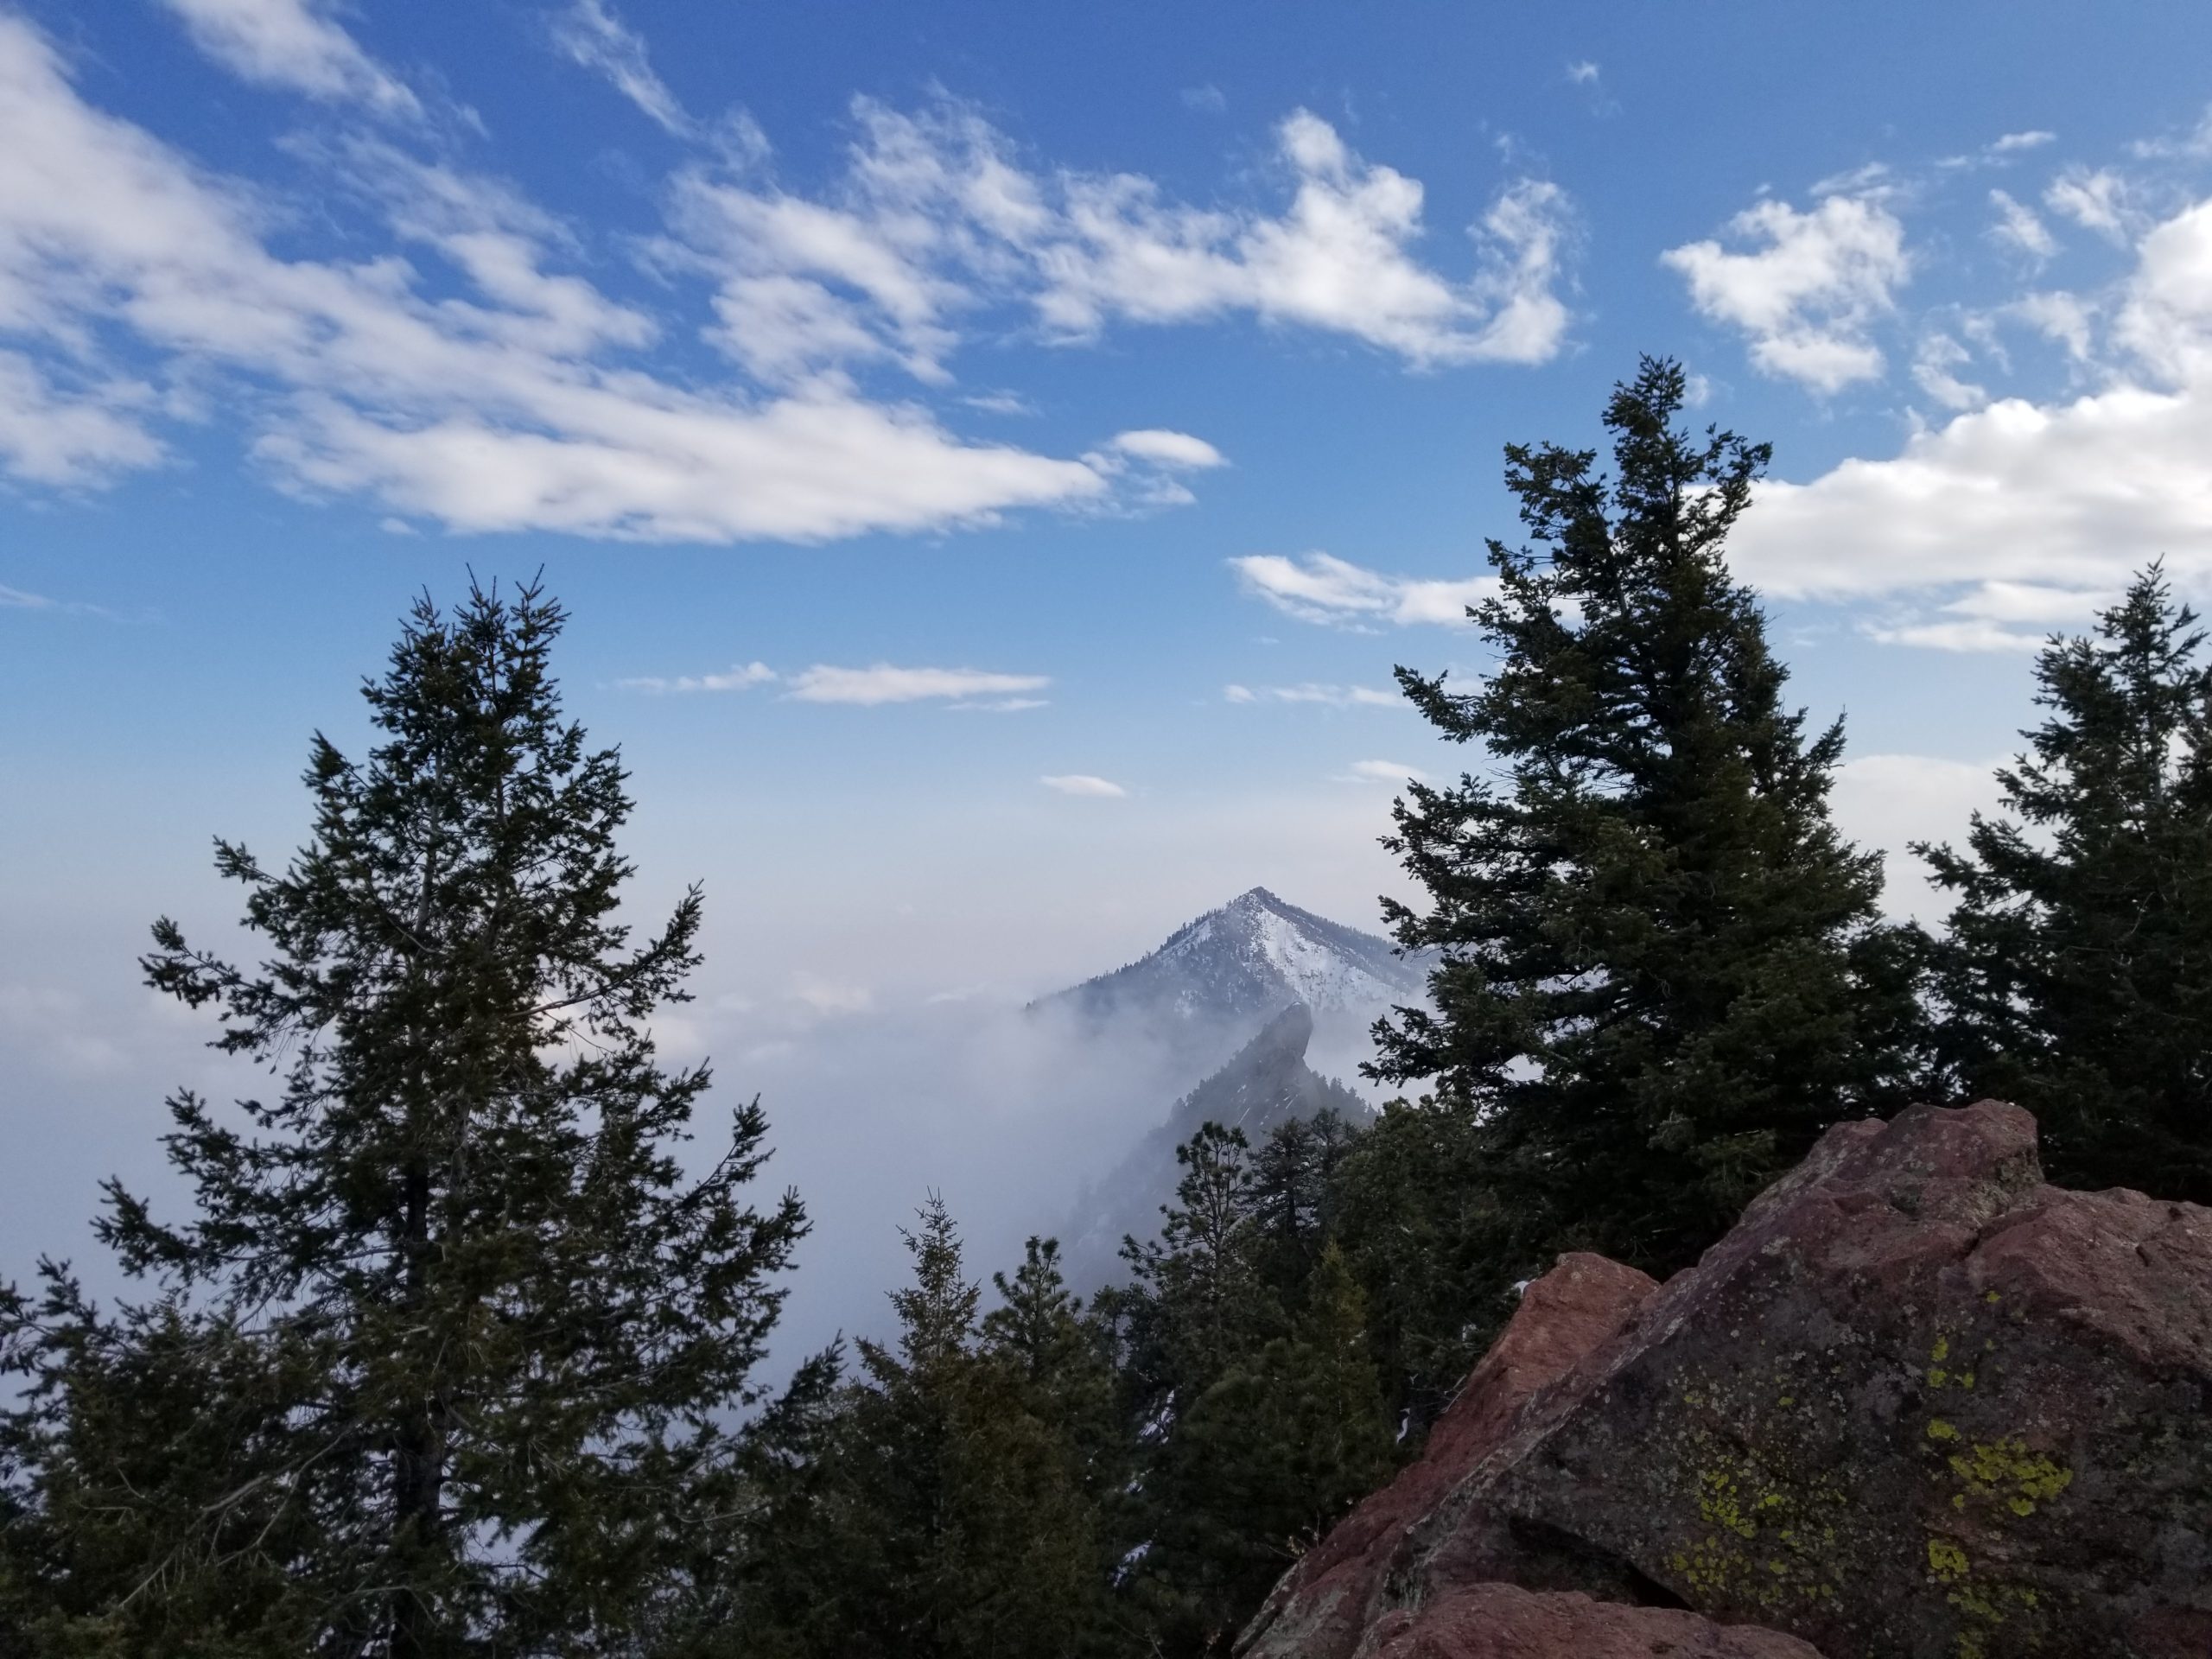
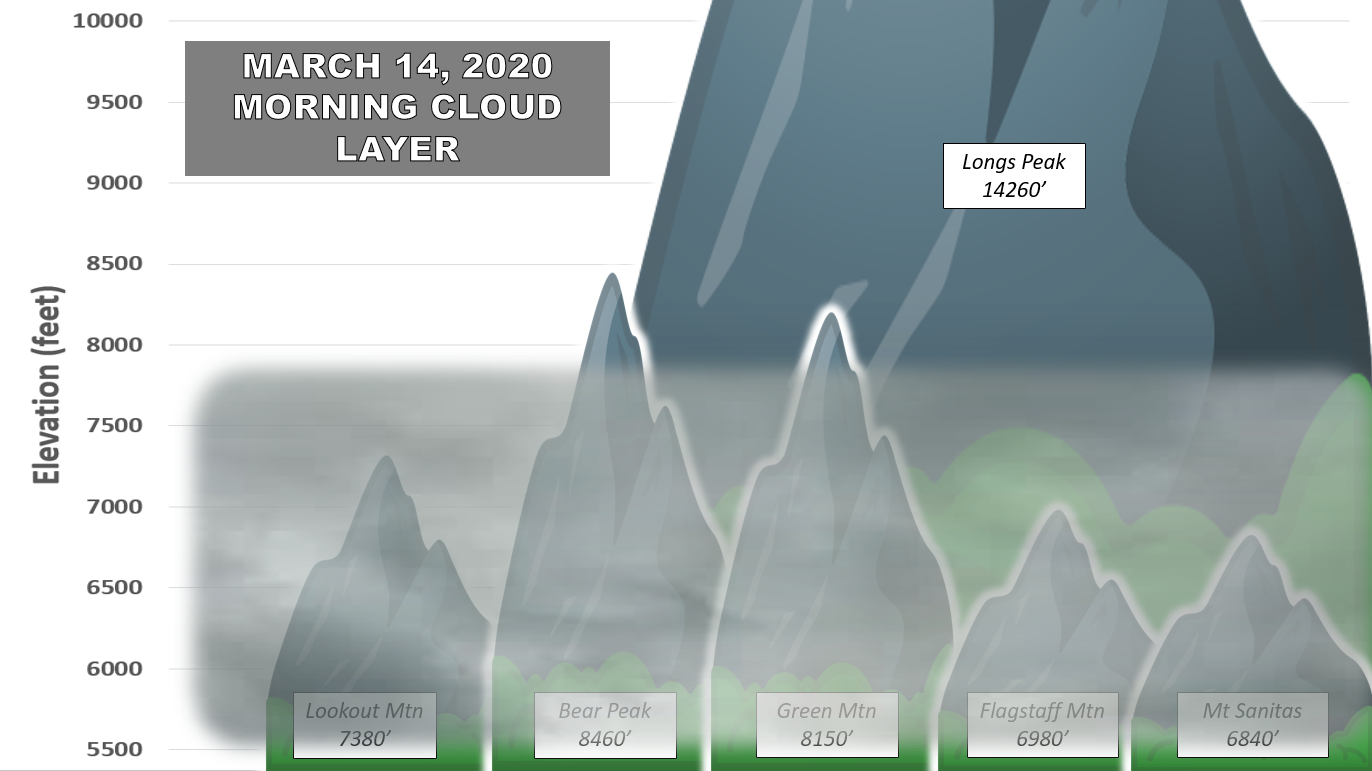
Green Mountain, Bear Peak, and South Boulder Peak would have all been excellent choices that day, but not the more modest Flagstaff or Sanitas. Lookout Mountain west of Golden also would have been a no-go on that day. The graphic below shows several peaks around the area and how they relate to the low cloud deck back on the morning of March 14, 2020. Both Green Mountain and Bear Peak would have been “above the clouds”. Longs Peak always towers above the stratus deck, but the low clouds usually do not extend that far west so it’s rarely a good choice!
Just remember that the closest weather balloon is launched in Denver. It’s 100% accurate (it’s not a forecast!), but it’s still about 30 miles away from Boulder. Fortunately, low stratus clouds are typically uniform and flat when they are forced by shallow moist upslope, so whatever the cloud top is in Denver will be very similar in Boulder under almost all circumstances, give or take 100 feet or so.
Speaking of, there are also forecast Skew-T graphics available from most weather models if you want to have a rough idea of when these type of “above the clouds” scenarios will be possible in the next few days. You can’t viably use low resolution models (such as GFS, NAM, or Euro) as they generally don’t capture the layer of near-surface saturation well. The higher-resolution NAM-NEST model does a fairly good job, and also the HRRR model, but these are short-range models that predict out only 18 to 60 hours into the future at most. We like to use the College of Dupage forecast suite for this application. You can choose the NAM-NEST tab, then pick the region, then the forecast time. Then click over the map near or slightly east of Boulder and it will generate a forecast sounding for that time. It will look something like what is shown below on the left. This forecast is actually for the low clouds/drizzle over Boulder that occurred yesterday morning (May 12, 2020). Observations taken at the same time are shown on the right.
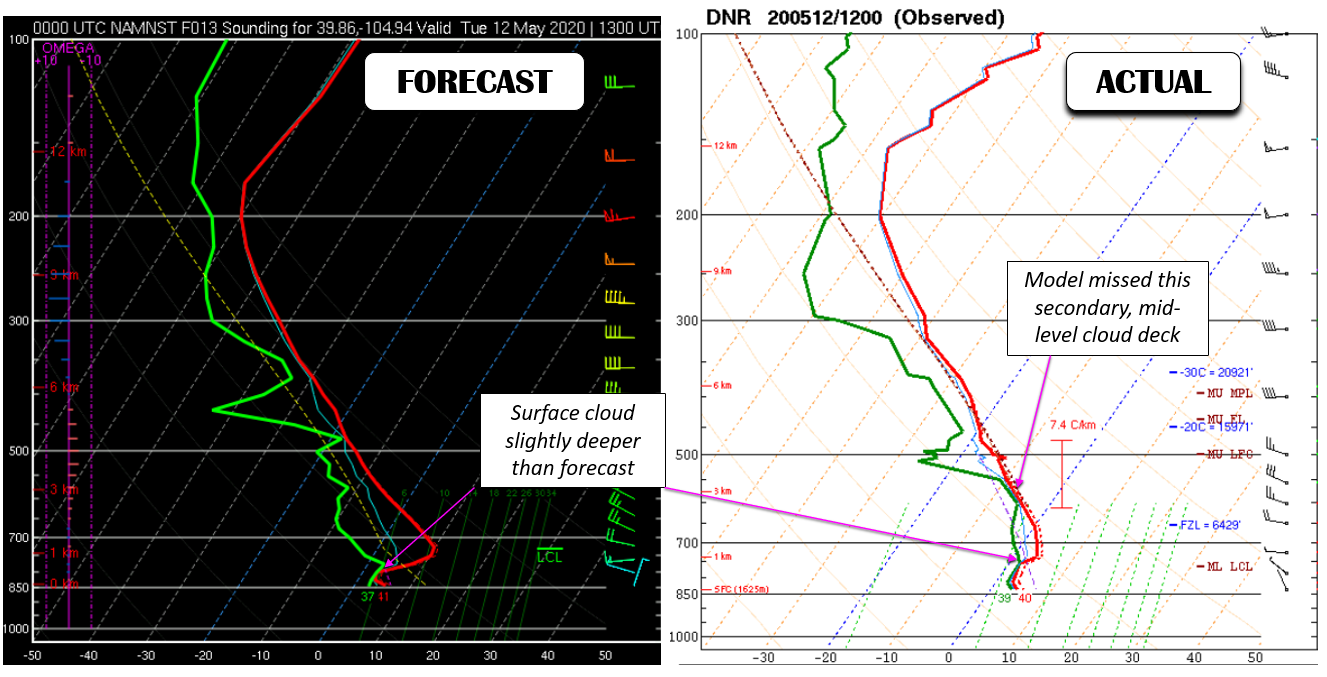
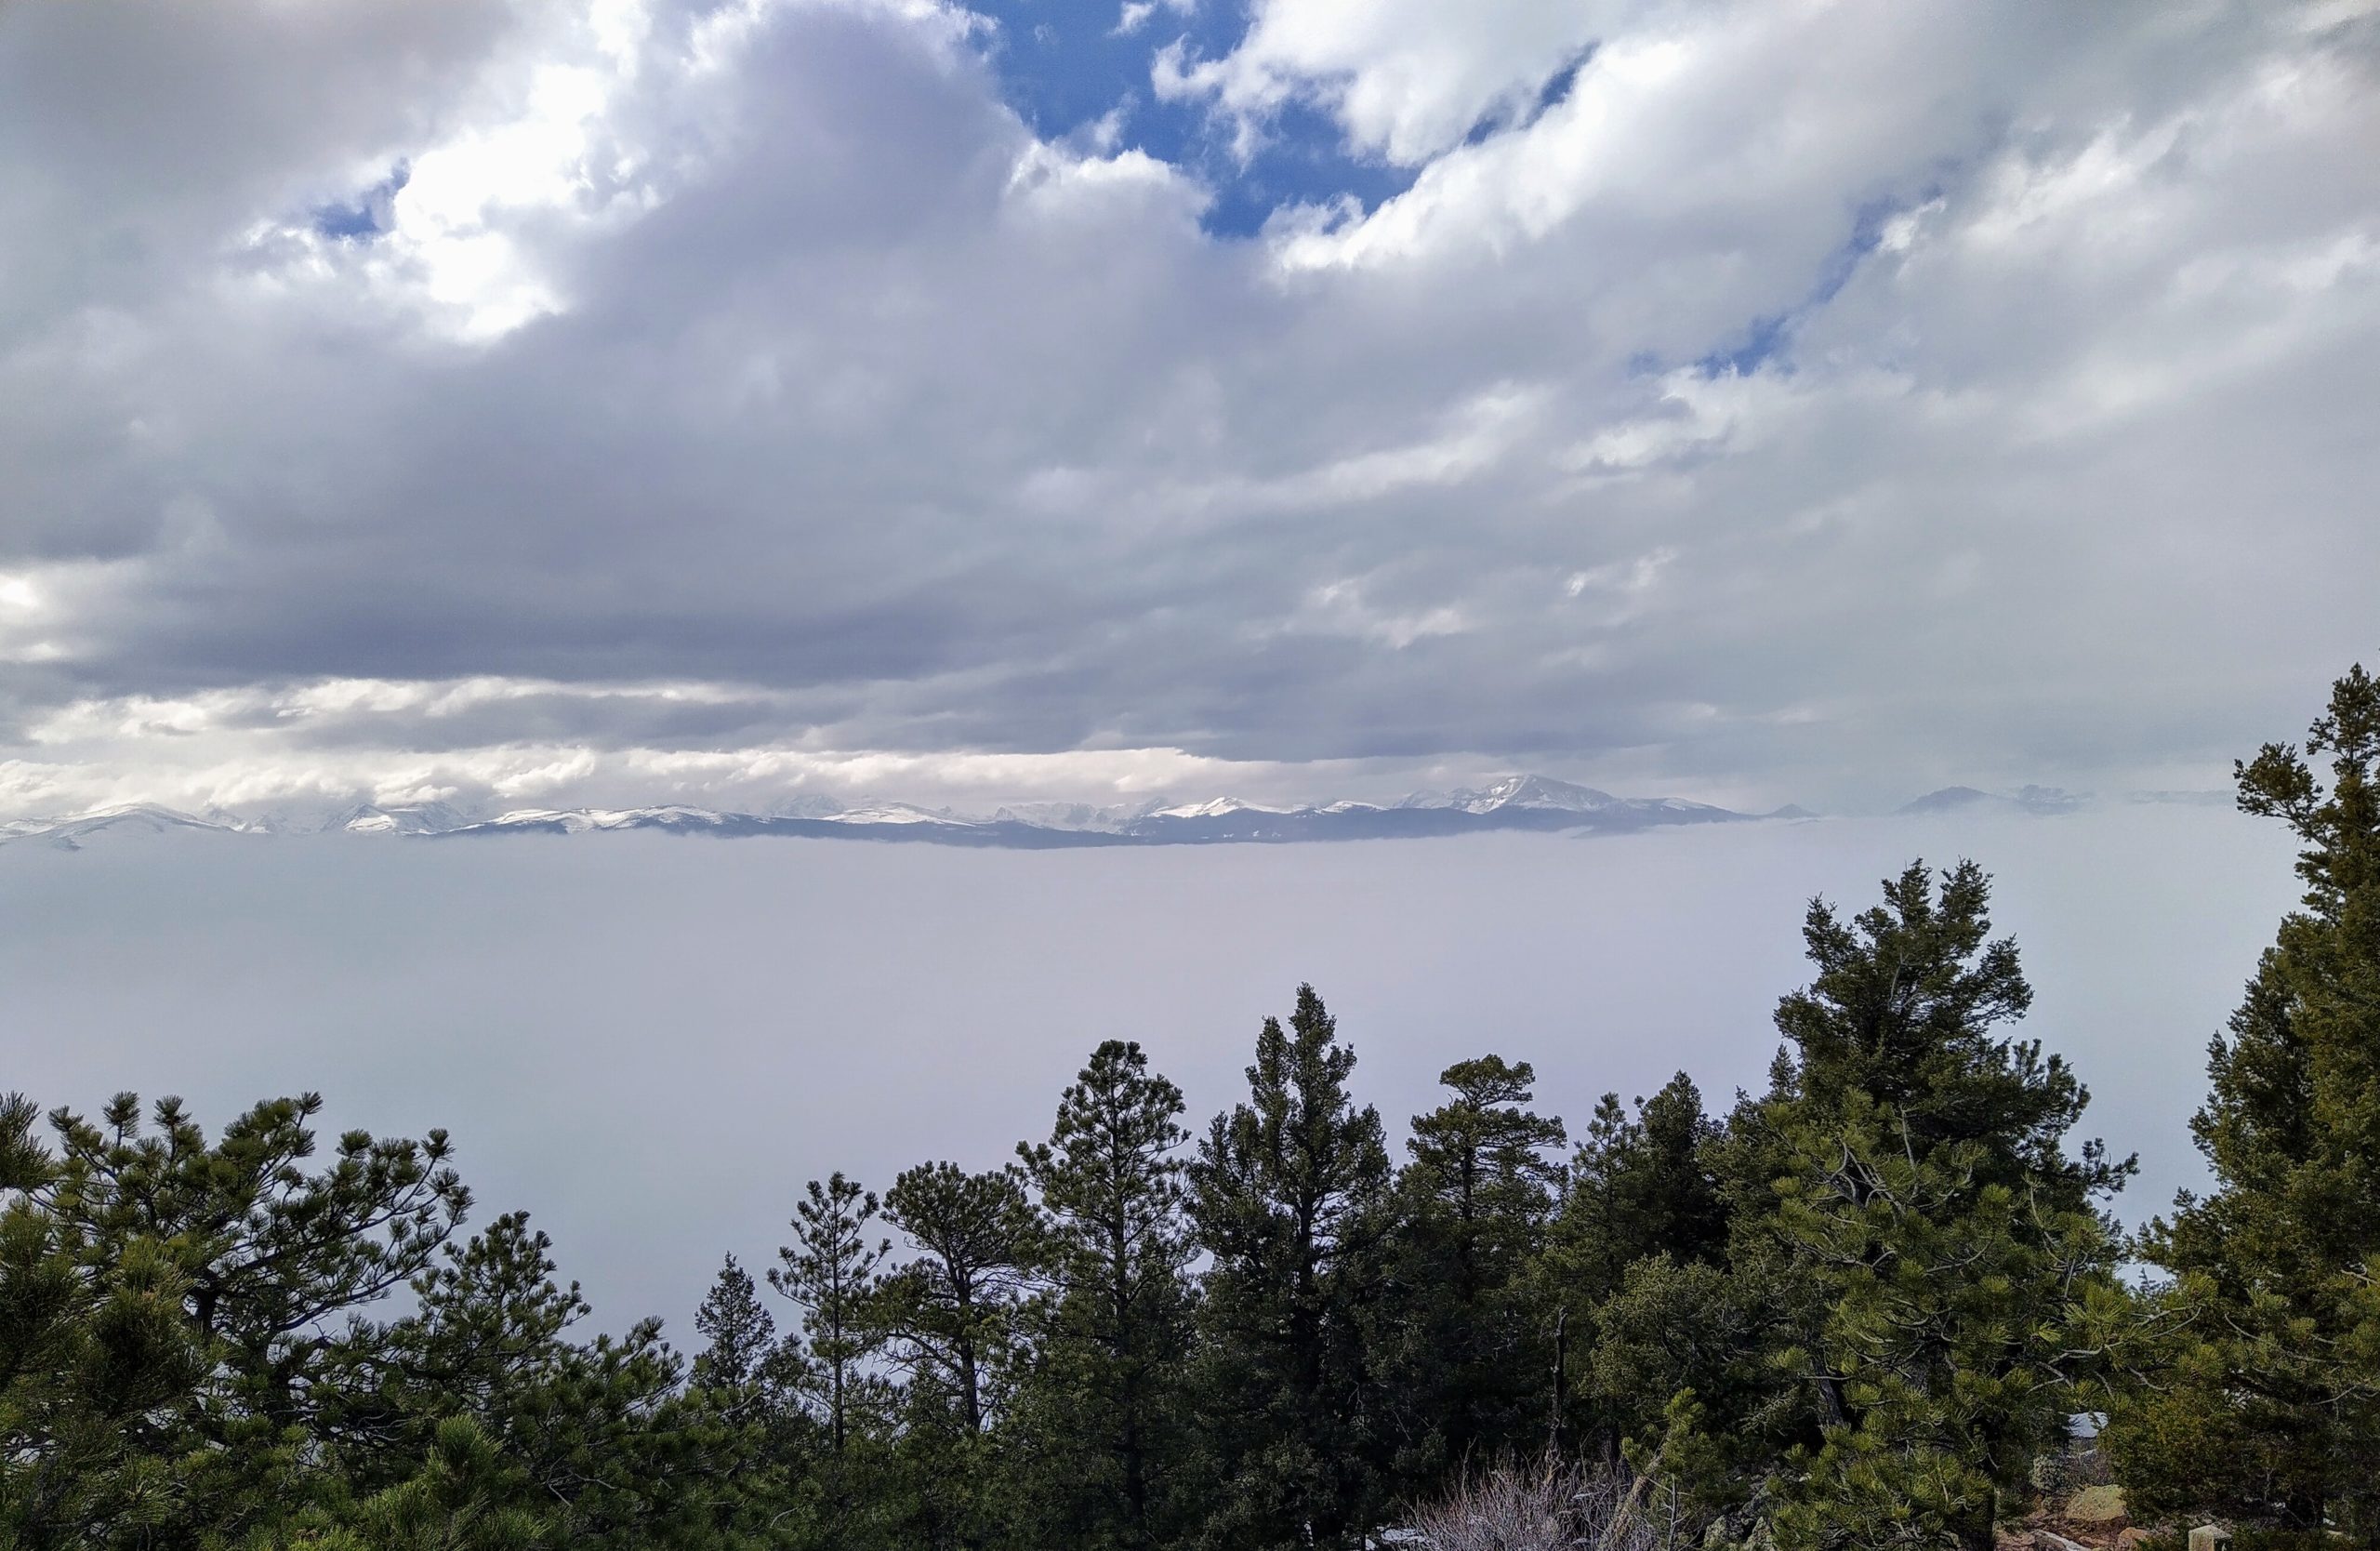
Even though the model forecast on the left was initialized just 12 hours before the observations taken on the right, it didn’t do a great job characterizing the low clouds over Boulder. It definitely did predict low clouds, but the depth of the clouds as off by a fair margin. The model also largely missed a secondary, mid-level cloud deck at around 15,000 feet elevation. Speaking from experience, you want full sun above the low clouds for the most dramatic “above the clouds” experience. If it is just as gloomy as it is in Boulder above the fog, it’s really not that spectacular.
Let’s check the sounding data from yesterday morning in Denver at 6:00 AM (see below). In red we have highlighted the first line where temperature begins to increase which would be above the saturated cloud layer. This corresponds to an elevation of 2632 meters which is 8635 feet elevation. The top of the cloud was located somewhere between this elevation and the one from the line above (2439 meters, 8002 feet).
 DNR   200512/1200

   LEVEL       HGHT       TEMP       DWPT       WDIR       WSPD
-------------------------------------------------------------------
  837.00,   1625.00,      4.60,      3.70,    335.00,      2.99
  816.01,   1829.00,      3.20,      2.30,    350.00,      8.00
  813.00,   1858.63,      3.00,      2.10,  -9999.00,  -9999.00
  785.47,   2134.00,      2.53,      2.01,    310.00,      6.00
  756.15,   2438.00,      2.00,      1.90,    260.00,      6.00
  756.00,   2439.58,      2.00,      1.90,  -9999.00,  -9999.00
  738.00,   2632.53,      4.00,      1.00,  -9999.00,  -9999.00
  727.89,   2743.00,      3.58,      0.35,    275.00,      6.00
  700.00,   3056.00,      2.40,     -1.50,    285.00,      8.99
  658.00,   3555.13,      0.20,     -3.40,  -9999.00,  -9999.00
Based on this data, there were no great choices for getting above the clouds over Boulder on Tuesday as shown in the diagram below. The cloud was just a tad too thick.
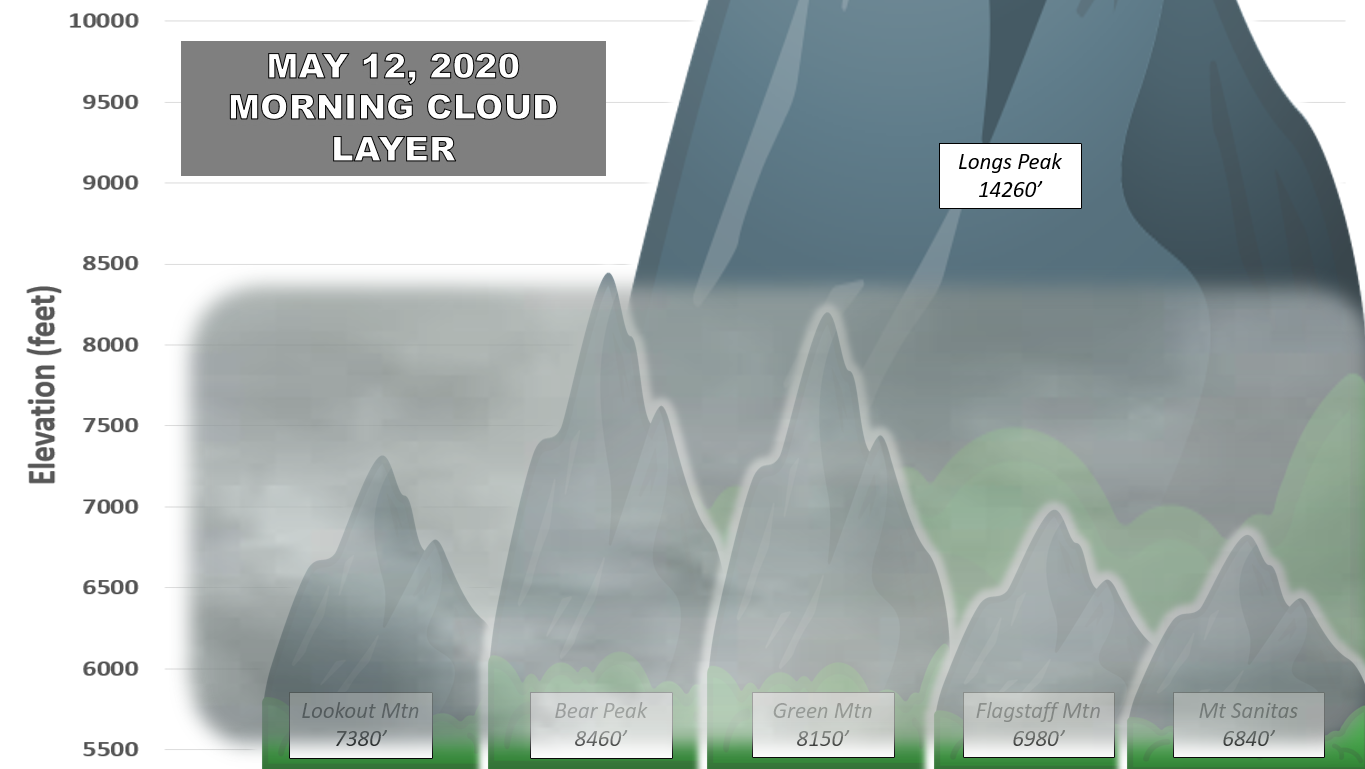
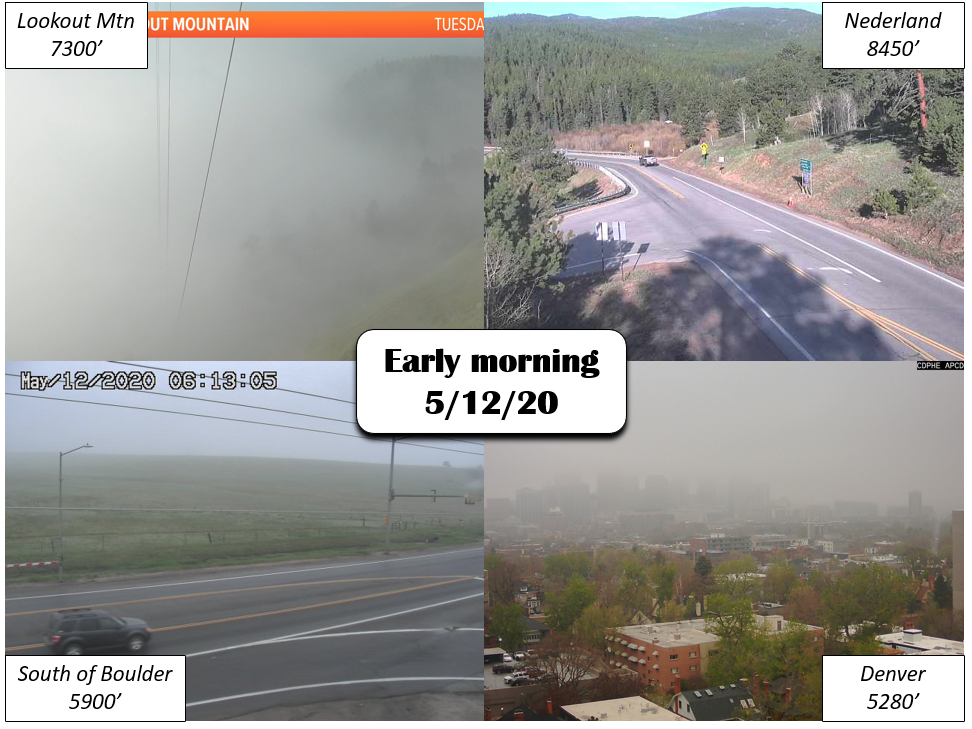
If you were feeling lucky, you could have tried Bear Peak which at 8460 elevation had at least a chance to be “above the clouds”. Based on the webcams at the time, you might have won that bet!
One final consideration when trying to get “above the clouds”: low clouds don’t often stick around too long. With a swift transition to downslope, Tuesday’s low clouds quickly eroded and were almost completely gone by 10:00 AM in most Front Range locations. It is fascinating to watch the burn off in the GOES-East high-resolution visible satellite animation below. Keep this in mind if you’re planning a trip “above the clouds”…they could very well be gone by the time you get to the top!
GOES-East visible satellite animation over Colorado during the morning of May 12, 2020 showing low clouds burning off from the Denver Metro area
If you have any questions about anything discussed here, drop us a comment below.
We discuss Boulder and Denver weather every single day on BoulderCAST Premium. Sign up today to get access to our daily forecast discussions every morning, complete six-day skiing and hiking forecasts powered by machine learning, access to all our Front Range specific weather models, additional storm updates and much more!
Featured image: Freezing fog over Boulder, looking down from Mt. Sanitas (Photo Credit: Josh McClung)
Let your friends know about Colorado weather, share this post:
.


You must be logged in to post a comment.