This week’s weather quiz topic was snowfall forecasting. Read on for some background information, the quiz results, and a deep dive into the answer.
These weather quizzes and resulting discussions are Premium content. For the first (and likely last) time, we are opening a quiz up to all of our readers. Join Premium to get the complete BoulderCAST experience, including these quizzes, our daily forecast discussion every morning, complete 6-day skiing and hiking forecasts, access to all of our Colorado-centric weather maps, additional storm updates and much more! If you love weather, you’ll love Premium. We promise! Plus it truly helps support our team’s efforts to add new features and content on a regular basis. Thank you all for the continued support.
BACKGROUND:
Snowfall forecasts are one of the (few remaining) aspects of meteorology in which humans routinely out-perform computers. This numbers edge stems from custom adjustments for models biases and climatology, and also that “gut feeling” you can only gain from years of specialized forecasting experience. For our team, forecasting snowfall is one of the most rewarding and enjoyable aspects of meteorology. However, it is also one of the most challenging, especially in Colorado’s Front Range.
Listed below are vastly over-simplified step-by-step instructions for making a snowfall forecast.
- Determine the amount of liquid equivalent for the storm. As you may know, weather models output precipitation amount via a parameter called liquid equivalent. In the weather-world, we call this “QPF”, short for “quantitative precipitation forecast”. This is the foundation of a snowfall forecast. You need to get a good handle on how much liquid equivalent is going to make it to the surface. Typically this involves looking at ALL available models AND their ensembles. After sifting though all the data, you then produce an expected forecast range. For example, 0.5 to 1.0″ of liquid.
- Determine the precipitation type throughout the storm. It is up to the forecaster to decide how much of the QPF is going to be snowfall. Thus, it is your job to determine the precipitation type. Models output this parameter as well, but it often needs to be closely inspected. Remember, we only care about snow for a snowfall forecast, not rain or ice. Depending on the exact set-up of the storm, you may also have to consider more than one precipitation type. For the Front Range, it is almost always going to be the change-over timing from rain (or freezing drizzle) to snow. Using your expectations and timing for precipitation type, the liquid equivalent can be partitioned into ONLY its snowfall portion.
- Determine the snow to liquid ratio (SLR): In short, you need to determine whether the snowfall will be super fluffy or a wet slush, or anywhere in between. We discussed this aspect of snowfall forecasting in great detail in the past post, including typical SLR values for the Front Range and the factors that control it. It’s well worth the read if you haven’t already. Determining the SLR mostly comes down to temperature and is an active area of research in winter weather forecasting. There are many different algorithms and methods used to estimate SLR. No single one is always correct or universally accepted.
- Determine your final snowfall forecast range: To get your final snowfall forecast, multiply the upper and lower values in your snowfall QPF range by the expected SLR.
THE QUESTION:
The BoulderCAST team is hard at work tracking the next potential snow event for the Metro area. The current timing is shaping up to be Sunday night into Monday. Four days out, models are understandably not in great agreement. The GFS model in particular is the most bullish with snow amounts for the Front Range. To simplify things for this quiz, we will only be considering the data from a single model, the GFS. Using a single model isn’t by any means a good forecasting practice. And as mentioned, the steps provided are an over-simplification. However, let’s keep things simple for the purposes of this quiz.
Using only the forecast data from the American GFS model and its ensembles shown below, at this point in time four days out, what is your best forecast in Boulder for the potential New Year’s Eve snow event?
1 – Determine the amount of liquid equivalent for the storm
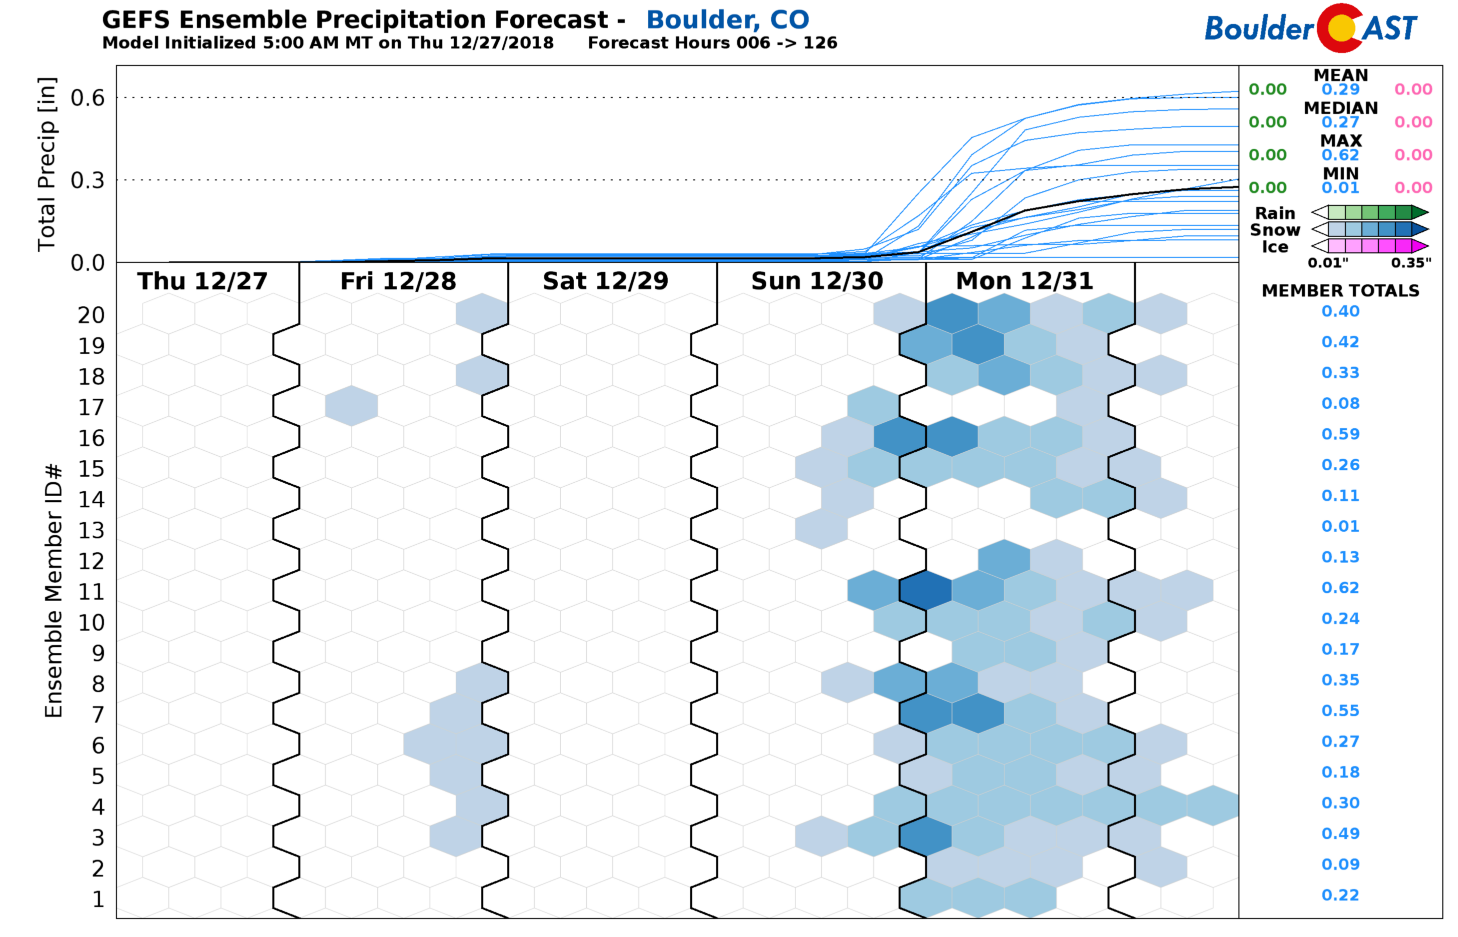
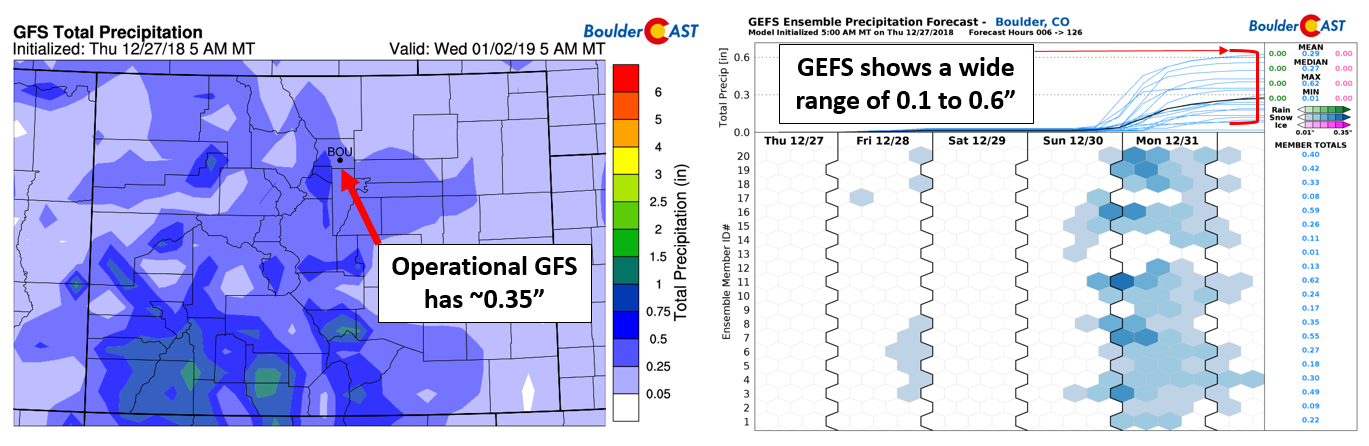
Latest GFS ensemble liquid precipitation forecast plume for Boulder

The latest operational GFS forecast for liquid precipitation for Colorado
2 – Determine the precipitation type throughout the storm
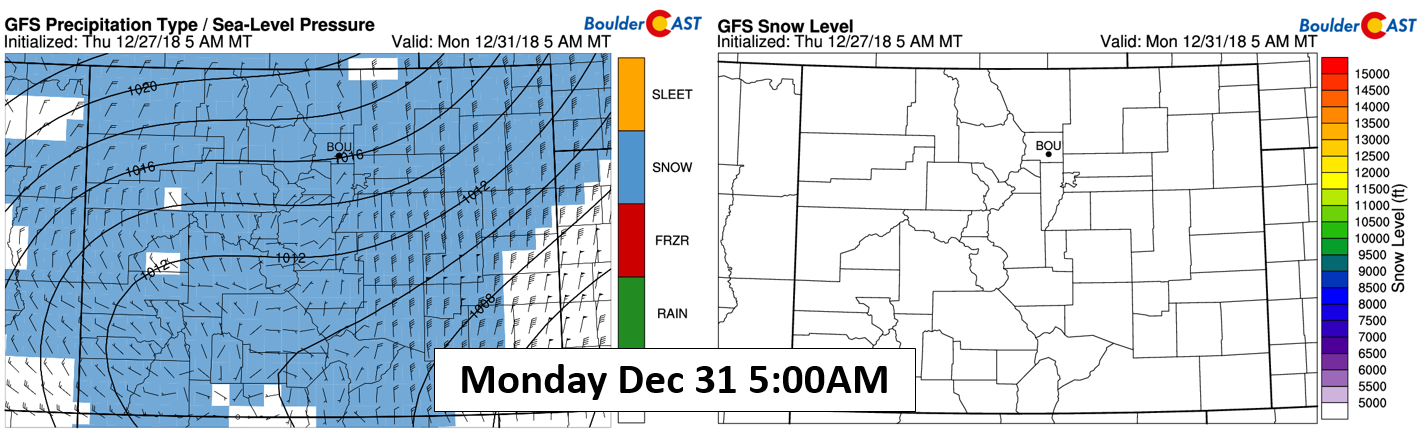
Latest GFS forecast for Monday morning for precipitation type (left) and BoulderCAST model-derived snow level (right)
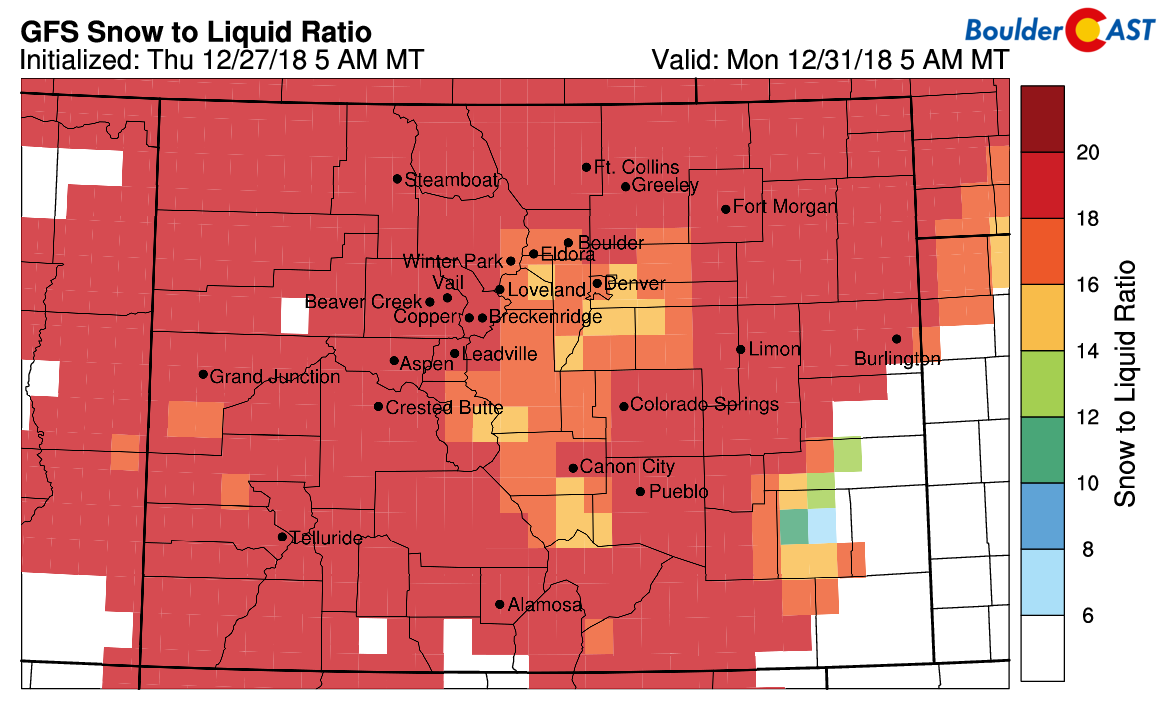
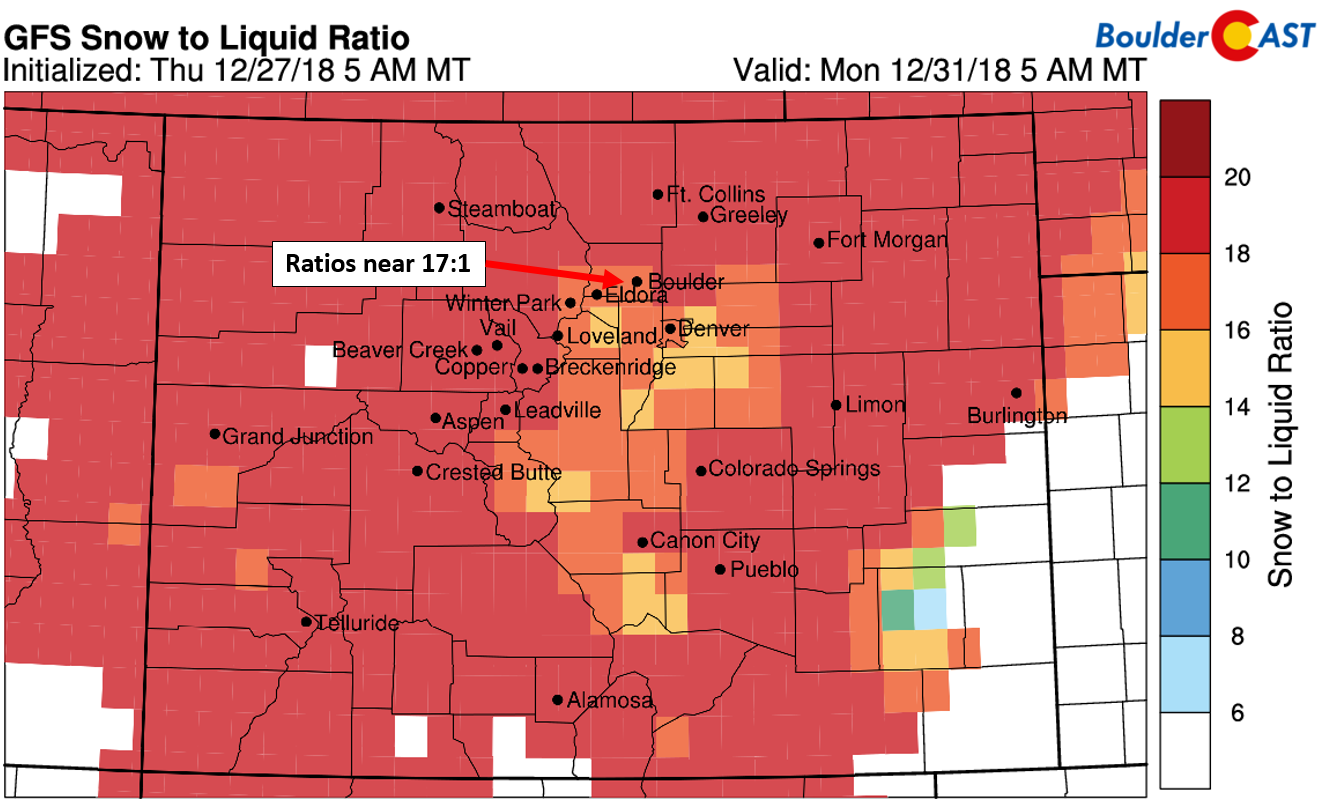
3 – Determine the snow to liquid ratio (SLR)
4 – Multiply the snowfall liquid equivalent range by the SLR
No so fun fact: Meteorologists potentially having access to only some operational weather models may not be that far-fetched. Imagine what would happen if there was a World War III. Global numerical weather data could quickly become top secret military intel. And let’s not forget what a real (i.e. complete) government shutdown could do to NCEP, the part of NOAA controlling most of the United States’ weather modeling efforts.
THE ANSWER:
Let’s work through each simplified step in the snowfall forecast process together…
1 – Determine the amount of liquid equivalent for the storm
The GFS ensembles have a wide range of forecast amounts between 0.1 and 0.6″. This is a large spread, but is fairly typical for a storm that is still four days away. The operational GFS shows an amount in Boulder around 0.35″ which fits comfortably in the range of its ensemble members.
2 – Determine the precipitation type throughout the storm
Checking precipitation type and the snow level, this storm will be all snow. This particular storm dropped out of western Canada and had plenty of cold air. This is typical for mid-winter…usually there won’t be any rain in our area. For this particular storm, we know all of the liquid equivalent forecasted by the models will be snow.

3 – Determine the snow to liquid ratio (SLR)
With the very cold air in place, snow ratios are quite high. Our algorithms show around 17:1 in Boulder.
4 – Multiply the snowfall liquid equivalent range by the SLR
- Lower bound of forecast: 0.1″ x 17 = 1.7″ of snow
- Upper bound of forecast: 0.6″ x 17 = 10.2″ of snow
- Best forecast that can be made using only GFS model data four days in advance: 2 – 10″
Based on the results below, 24% of quiz participants were correct…way to go!
We’ll also give partial credit to the 48% of participants that chose the 3-7″ forecast. The clustering in the ensembles wasn’t consistent enough in our opinion to narrow down the forecast this much, but it is for sure debatable.
The 1-4″ and 5-10″ choices were definitely too low and high, respectively. Sorry…these choices are wrong.
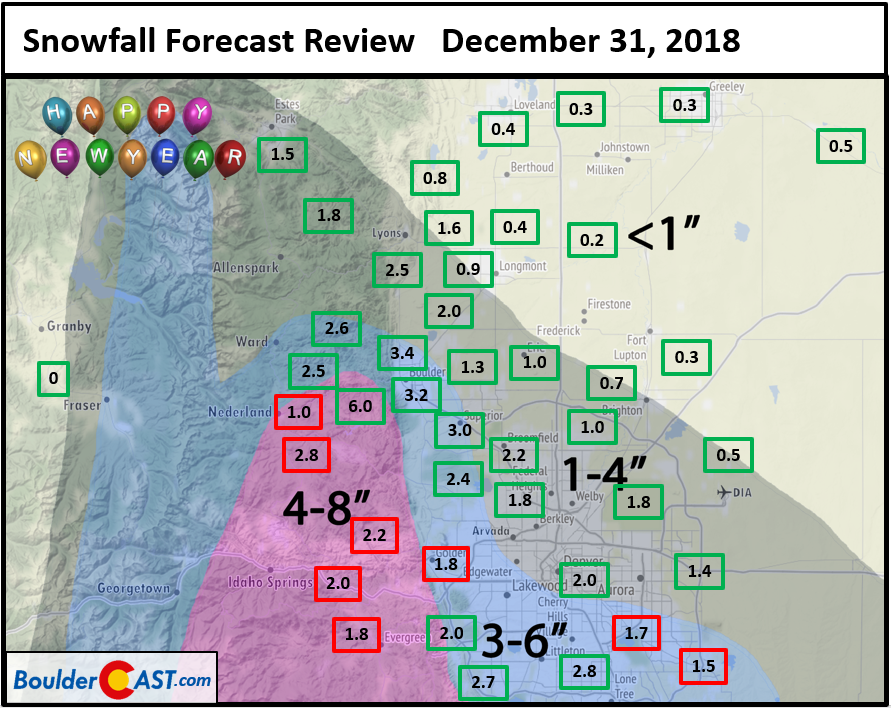
Just for fun, how did the storm actually turn out? 3.2″ of snow was reported in Boulder, nicely within the two most correct quiz choices of 2-10″ and 3-7″. Bravo on your forecasts! The snowfall contained 0.16″ of melted liquid equivalent. Thus the snow ratio was 20:1. For a full recap of the storm, check out our recent post.
Hopefully this quiz has helped you better understand the basics behind making a snowfall forecast. Remember that these steps were vastly oversimplified from the steps meteorologists actually take when forecasting snowfall. We failed to include the data from other models, data from the same model across multiple runs, forecast adjustments for known or perceived model biases, and any form of climatology.
Share this quiz:


You must be logged in to post a comment.