For the first time in three years, La Niña conditions have developed and are expected to last through the upcoming winter. We discuss the forecast, remind you what La Niña actually is, and explain the potential impacts La Niña will have on Colorado for the rest of autumn. If you like pie charts, box-and-whisker graphs and/or 3-D representations of ocean temperatures, this post is most definitely for you!
We discuss Boulder and Denver weather every single day on BoulderCAST Premium. Sign up today to get access to our daily forecast discussions every morning, complete six-day skiing and hiking forecasts powered by machine learning, access to all our Front Range specific weather models, additional storm updates and much more!

Key Highlights from This Post:
- La Niña conditions are now present in the eastern tropical Pacific Ocean and they are expected to linger through the upcoming winter
- For the rest of 2020, we expect in general above normal temperatures and below normal precipitation
- Due to La Niña , we anticipate little to no “big” snow storms through the entire winter, but not necessarily less overall snow
- La Niña does correlate with more cold snaps, more freezing drizzle and more downslope wind events in the Front Range
A La Niña Advisory has been issued
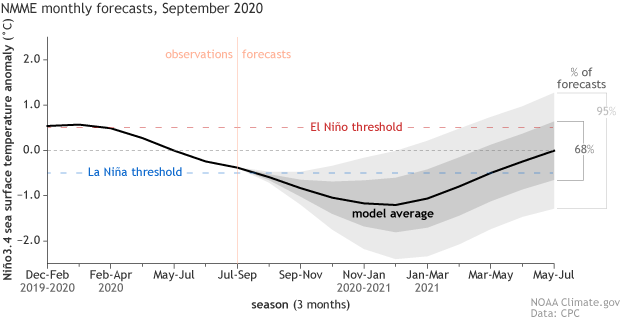
Earlier in the year, it was projected that the Northern Hemisphere would either see ENSO Neutral or La Niña conditions during the 2020-2021 winter season. That forecast has now come to fruition. The weak El Niño we had last winter absolutely imploded on itself during the spring months earlier this year. We’re now in a full-blown, albeit weak La Niña (for now). Climatologists are projecting 75% odds that La Niña will stick around through the autumn and upcoming winter seasons. The remaining 25% odds go towards an ENSO-Neutral winter, leaving no chances for our beloved El Niño!
What is La Niña?
La Niña is associated with cooler than normal ocean temperatures in the central and eastern tropical Pacific Ocean, with enhanced easterly trade winds along the Equator and a shift of the warmest waters westward in the Pacific towards Polynesia.
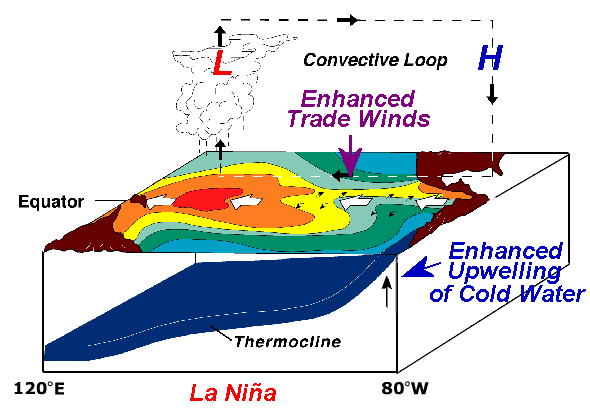
Large-scale upward motion in the atmosphere and the resulting thunderstorm development along the Equator follows the warm pool of ocean water westward. This creates a convective loop across the expansive Pacific Ocean from west to east (shown above). These are just the localized effects of La Niña. Our atmosphere and ocean are intimately coupled on a global scale. This leads to locations all around the world, including Colorado, being influenced by ENSO. This is the topic of today’s discussion!
Tracking La Niña
To keep eyes on ENSO, researchers have deployed large arrays of buoys throughout the Pacific to monitor ocean temperatures at the surface and deep below. The most widely accepted/correlated temperature measurements come out of a region known as Niño 3.4 (shown below). From these measurements, the Oceanic Niño Index (ONI) is used to determine the current state of ENSO, with an ONI > 0.45 indicating an El Niño (which is a warm anomaly), an ONI < -0.45 categorized as La Niña (which is a cold anomaly), and an ONI in between coined as ENSO-Neutral.
The 3.4 Niño region in the Pacific Ocean. This area is heavily monitored by scientists in order to keep tabs on ENSO
Scientists have been tracking the ONI index since the mid-20th century. The table below shows the ONI index values for each month in the last 10 or so years. Four of our last six winters have been El Niños, including what was the strongest El Niño in recorded history back in 2015-16.
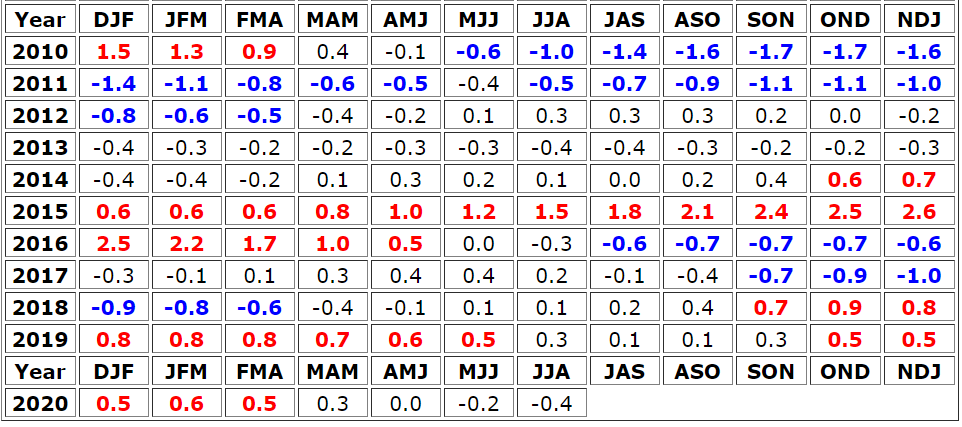
As of October 1st 2020, the normalized temperature anomaly in Niño 3.4 is -1.0°C with the latest ONI being -0.4°C (representing June through August). Waters are forecast to continue to cool in the eastern tropical Pacific Ocean with La Niña growing even stronger. The graphs below of temperature anomalies show the expansion of the cool water below the ocean’s surface since August 1, 2020. Essentially this is a time-lapse of La Niña being born!
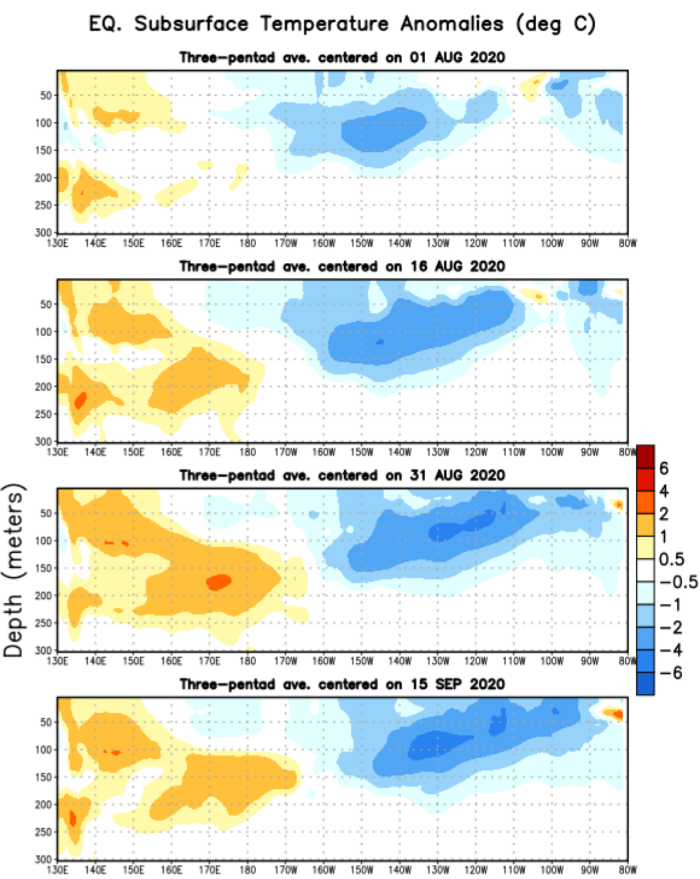
You may be having trouble visualizing what the graphs above physically represent as the axes are longitude (in degrees west) versus depth in the ocean (in meters). We found this animation from NOAA fairly useful for putting things into perspective! The data in the animation ends on September 5th, however.
The main take-away here is that La Niña is here to stay for the autumn and winter! Let’s take a look at the expected impacts on our weather.
What does this all mean for Front Range Colorado this winter?
The (admittedly oversimplified) diagram below shows the general conditions during the positive and negative phases of ENSO across North America. A “typical” La Niña winter sees the jet stream keep a more northwesterly orientation across Colorado (top diagram below). Most of our storms will therefore be the cold and relatively dry Canadian variety. This is opposed to the juicy and comparatively warm storms that are a staple of El Niño winters for the Front Range. This jet position during La Niña also produces more orographic snows for the Mountains favored by northwest flow (those near Steamboat, plus Winter Park).
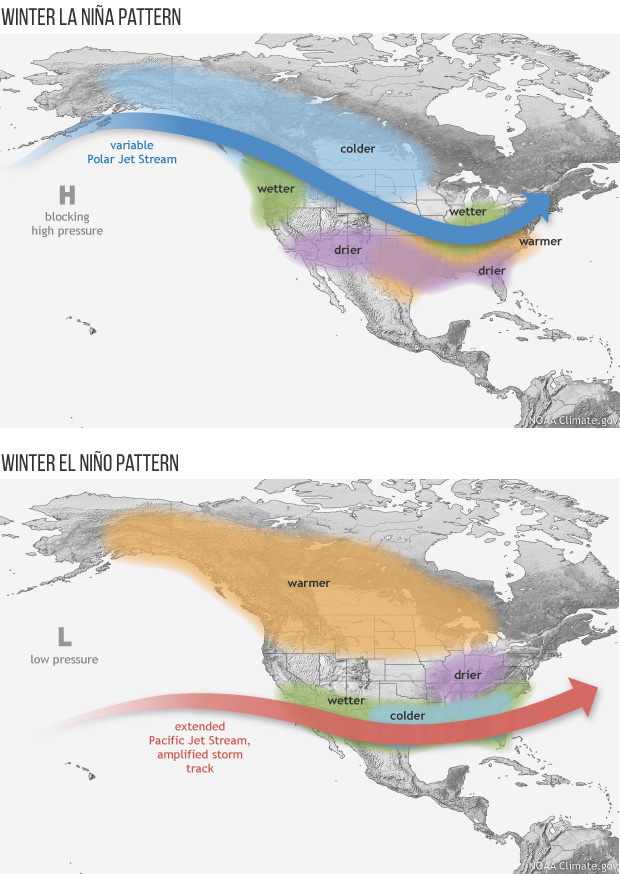
Another consequence of this jet pattern is the potential for more frequent Arctic outbreaks across the central United States and also the Denver Metro area. Some of these outbreaks can be accompanied by freezing fog and freezing drizzle under the right circumstances. This is exactly what unfolded during the last La Niña winter nearly three years ago. At times, it seemed like we couldn’t go a single week without a freezing drizzle event. Trust us, as weather forecasters this shift away from snow and towards freezing drizzle got annoying quickly. That’s without even considering the constant struggle of chiseling ice off the windshield that winter!
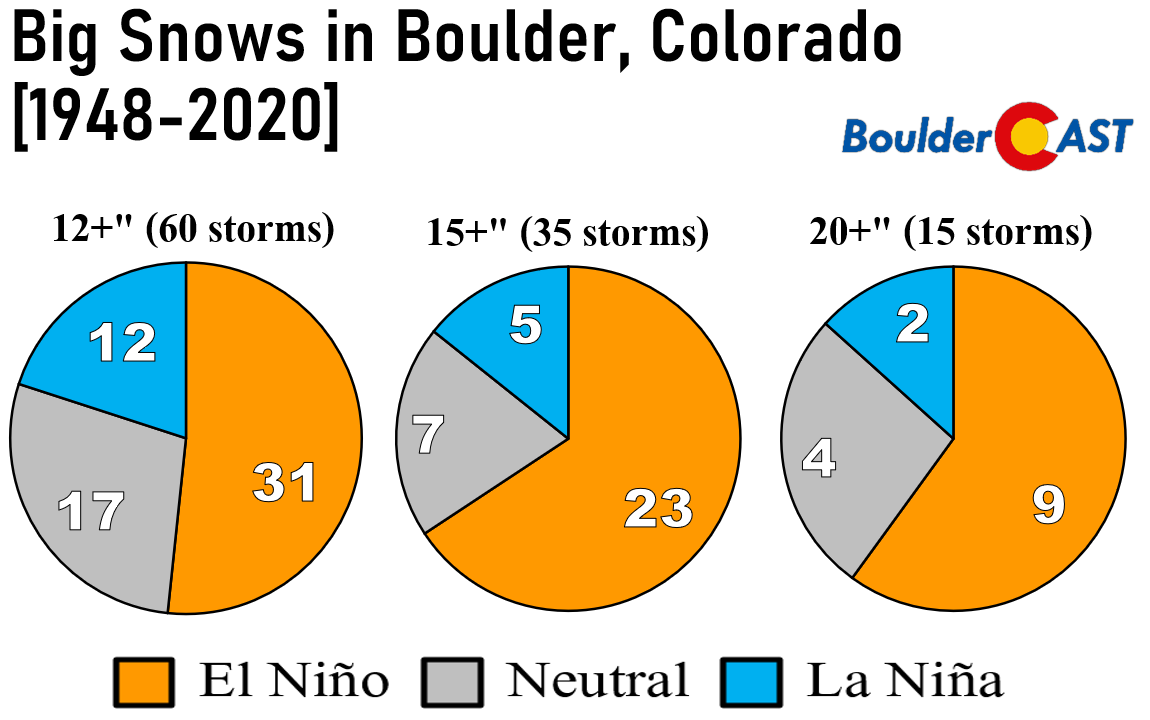
The last two La Niña snow seasons (2016-17 & 2017-18) combined had only ONE snowstorm that produced more than 9″ in Boulder. Let that sink in for a moment! Just one 9-incher in two years! To put this into perspective, the following two El Niño seasons (2018-19 & 2019-20) had five storms that dumped more than 14″ of snow in Boulder. This is no surprise though. Big snow storms are indeed less frequent for us during La Niña years, and by a titanic margin. Over the last 70 years, only 5 out of 35 snowstorms (14%) dropping at least 15 inches in the city of Boulder occurred during La Niña conditions, relative to neutral or El Niño conditions. Furthermore, NONE of our top 15 biggest snowstorms on record came when a La Niña was present. Insert sad face here. The pie graphs below show just how skewed our biggest snowstorm climatology is towards El Niño and away from La Niña.
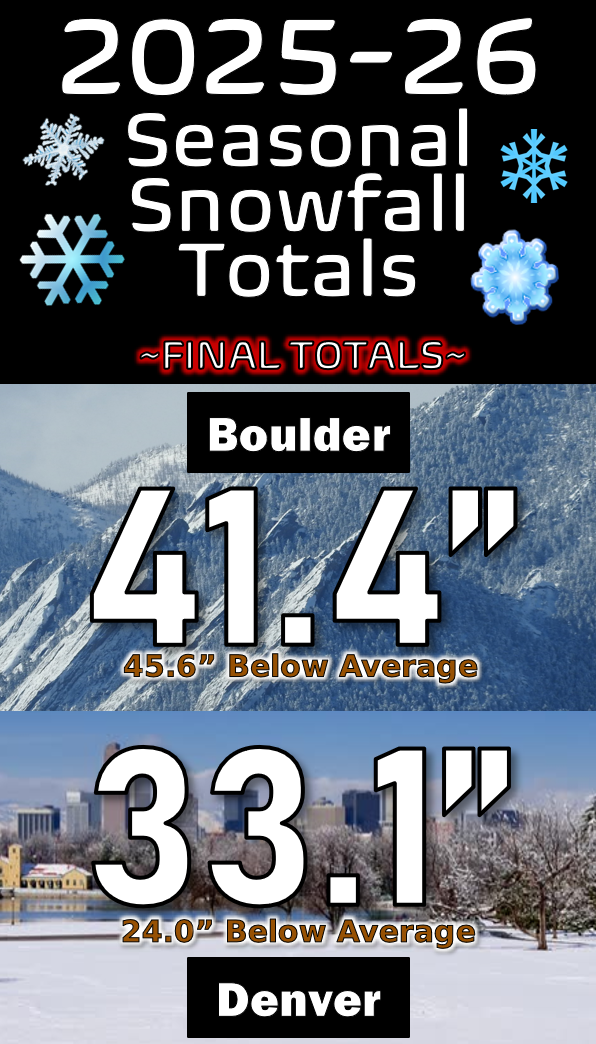
It literally pains us as meteorologists to point out that Denver only saw 22″ and 26″ of snowfall during the last two La Niña winters. The former was Denver’s second lowest seasonal total all-time. Despite these two very poor snow years for Denver, we do want to reiterate that long-term there is no correlation between ENSO and total seasonal snowfall in the Front Range mountains or Plains. The less frequent big dumpings of El Niño are replaced with relatively more frequent small snow events during La Niña. These opposing paths to snow accumulation more-or-less balance each other out across our area. So we’re not totally hosed for precipitation and snow this winter. Not yet at least!
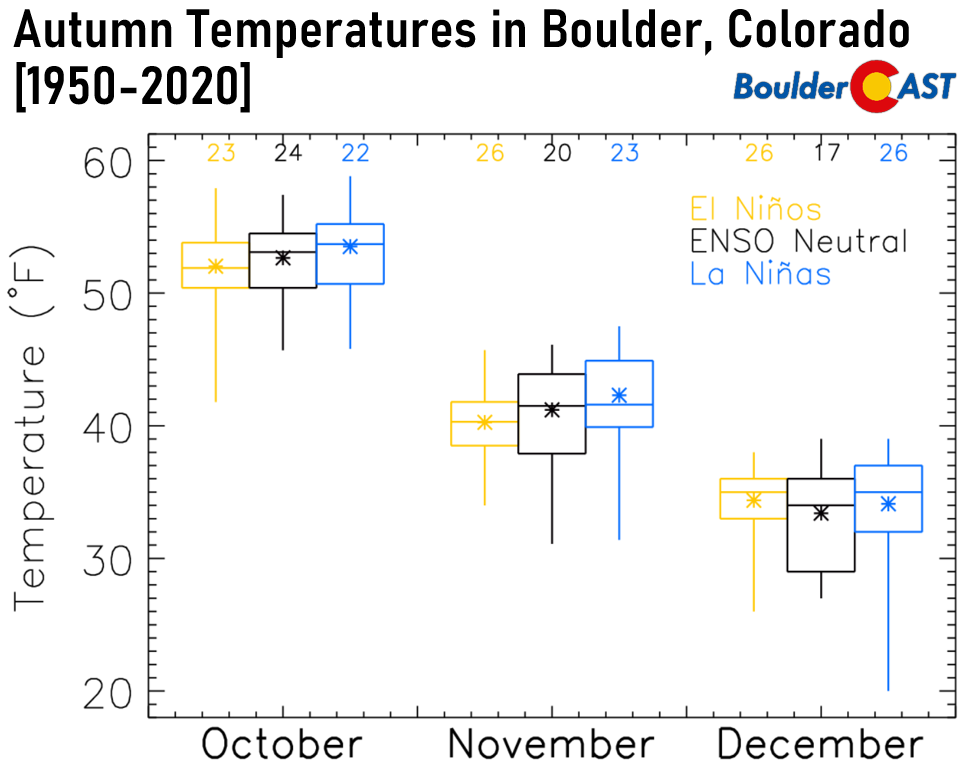
Our perceived thoughts on weather conditions surrounding La Niña are indeed backed up by data. Based on temperature and precipitation analysis from the Climate Prediction Center, the autumn period (OCT/NOV/DEC ) under La Niña has a clear warm and dry theme for all of northeast Colorado (i.e. Climate Division #46).The graphs below are called box-and-whisker plots. The red lines indicate the median value….the blue boxes contain 50% of all years….while the “whiskers” fan out to the more extreme years.
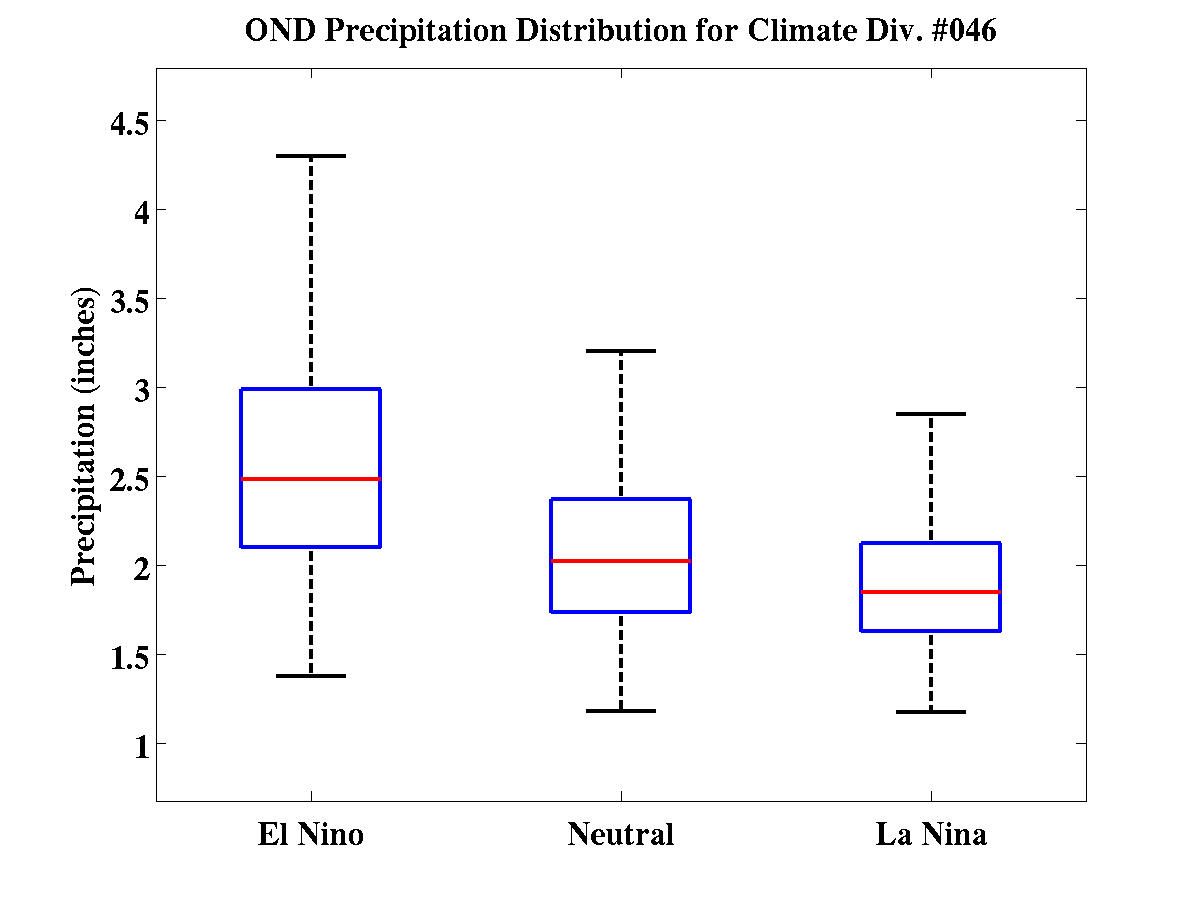
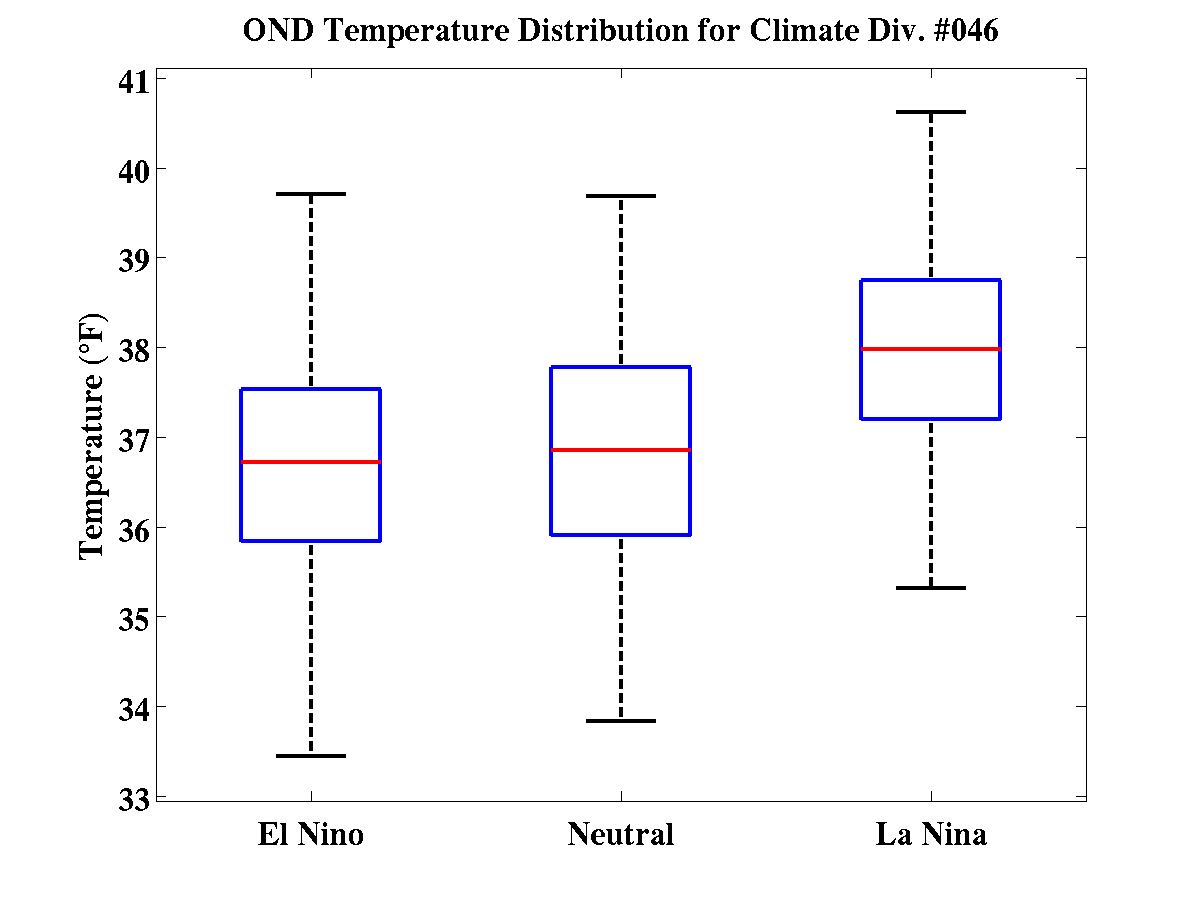
La Niña autumns definitely trend warmer and drier for northeast Colorado. Furthermore, precipitation variability compared to neutral autumns, and certainly El Niño autumns, is greatly reduced. This is seen by a shorter “whisker” length in the La Niña precipitation graphic and is largely due to the lack of intense southern storms that tap into Gulf of Mexico moisture. These big events tend to make-or-break El Niño winters and can be highly variable, especially in autumn.
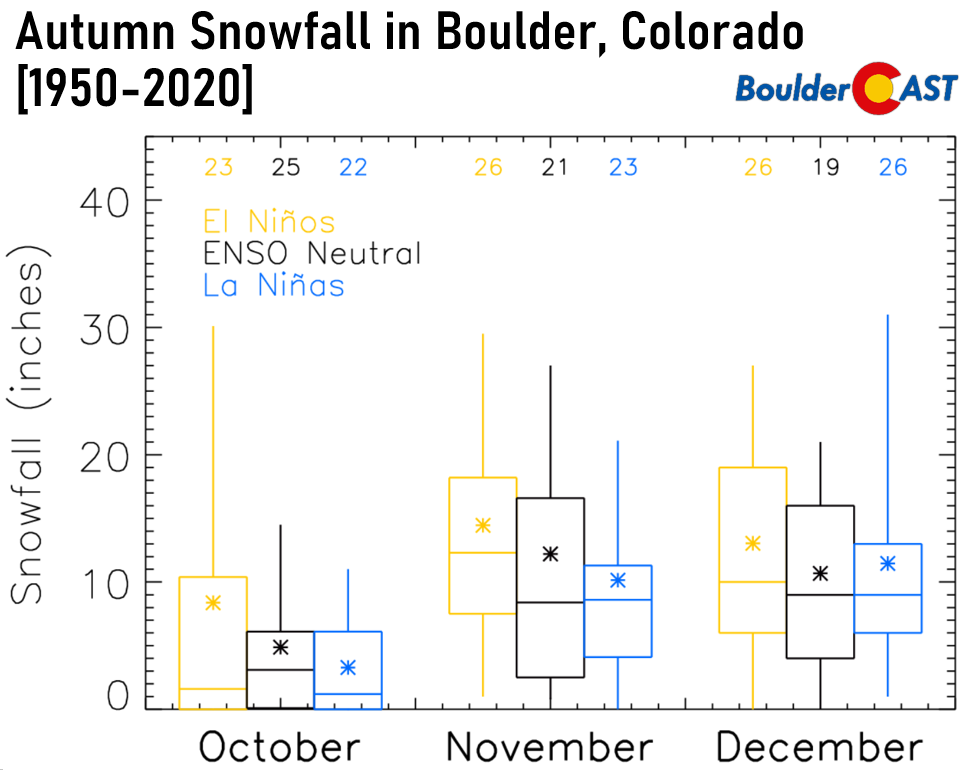
We repeated the same analysis as above, but only for the city of Boulder. The data is very similar with a generally dry and warm trend observed during La Niña autumns in Boulder, too. Precipitation is particularly nerfed during the month of October during La Niña . This dry signal is not significant in November or December, at least in Boulder.
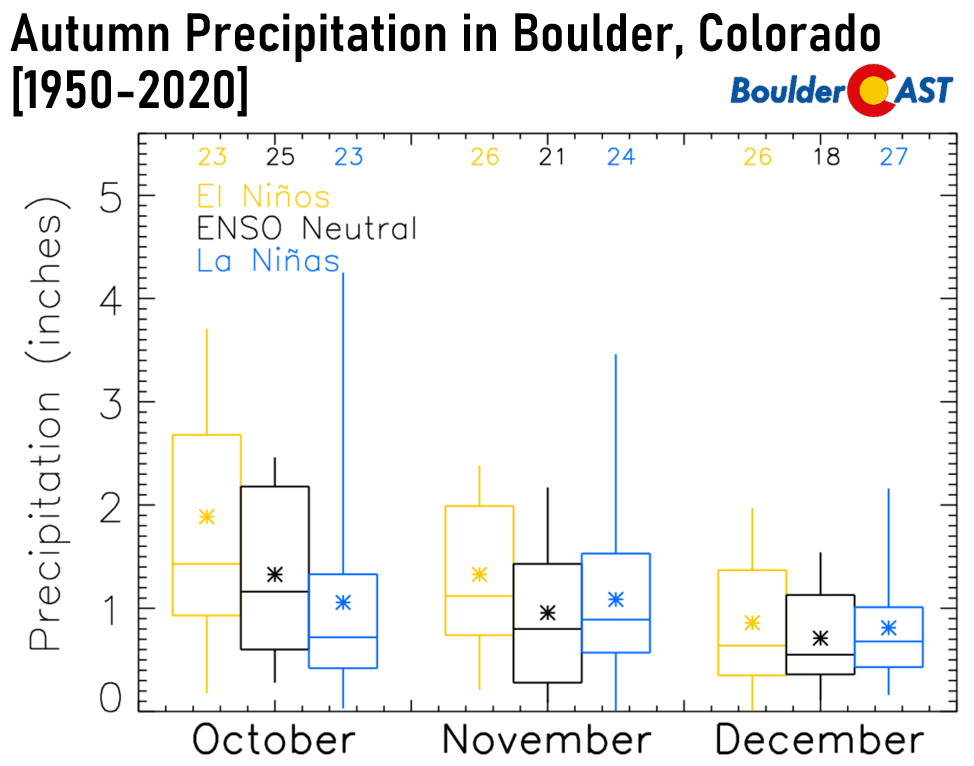
In respect to temperatures, both the mean and median values in Boulder are higher during La Niñas for all three months, so at least on paper we have a good chance at a warm fall this year. Interestingly, we start to see the bottom “whisker” of La Niña temperatures extend quite far downward in November and especially December. This is a signal of the Arctic outbreaks we alluded to earlier that generate little in the way of snowfall, but may produce freezing drizzle across the Front Range and in Boulder. These bitter cold snaps become more common during the heart of winter into early spring.
What about the snowfall outlook? Well, it’s probably safe to say that Boulder will see less snow this winter compared to last year. Surely you remember the one-hundred fifty-two inches of utter nonsense that fell last year? Out of all three ENSO phases, La Niña consistently produces the least snowfall during October and November in Boulder. December is more variable, but the median snowfall is still lowest during La Niña. All in all, we should expect less snowfall than normal these next few months.
The temperature and precipitation seasonal outlook from the Climate Prediction Center for October through December is shown below. Their outlook is right in-line with of our thinking for Colorado, one we have touched on already. That is, increased chances for a warmer and drier than normal conclusion to 2020.
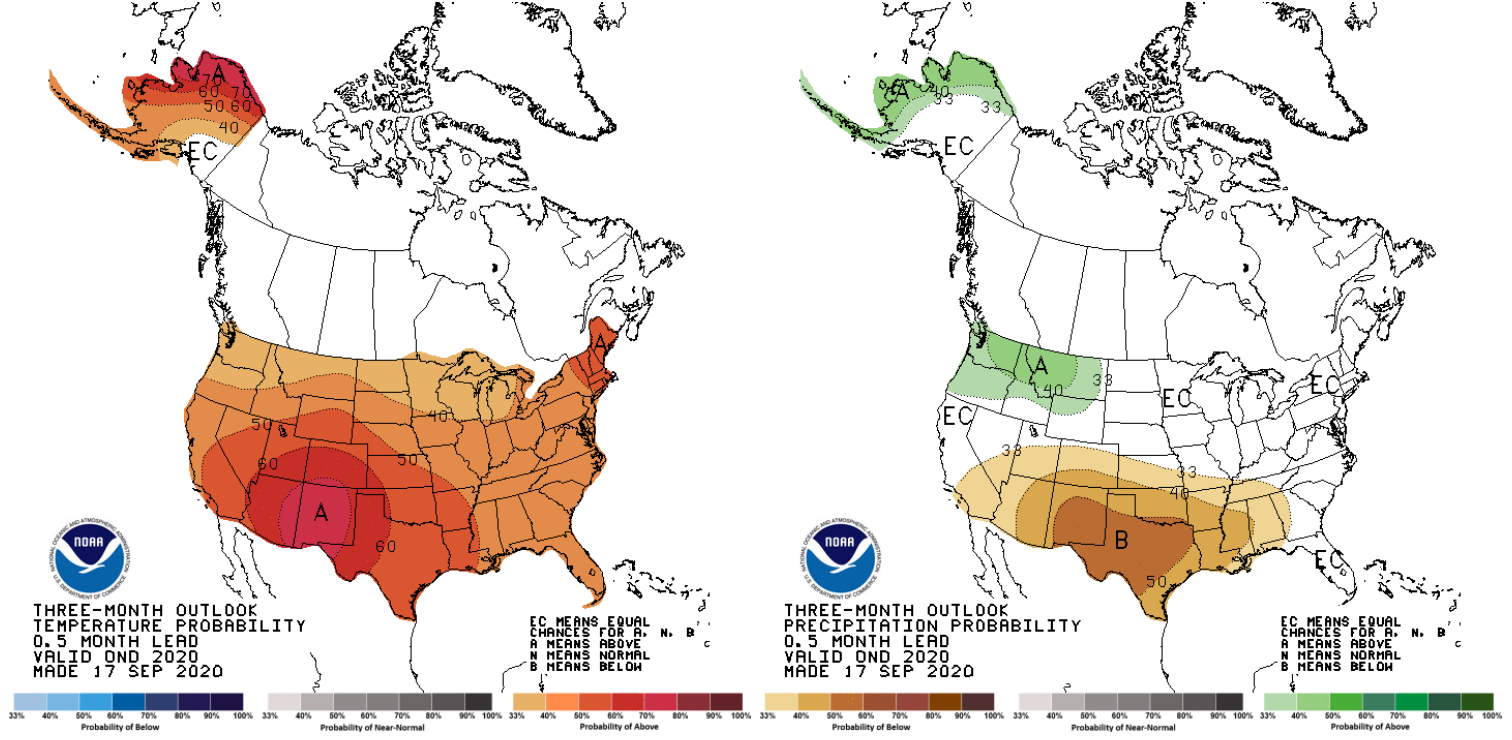
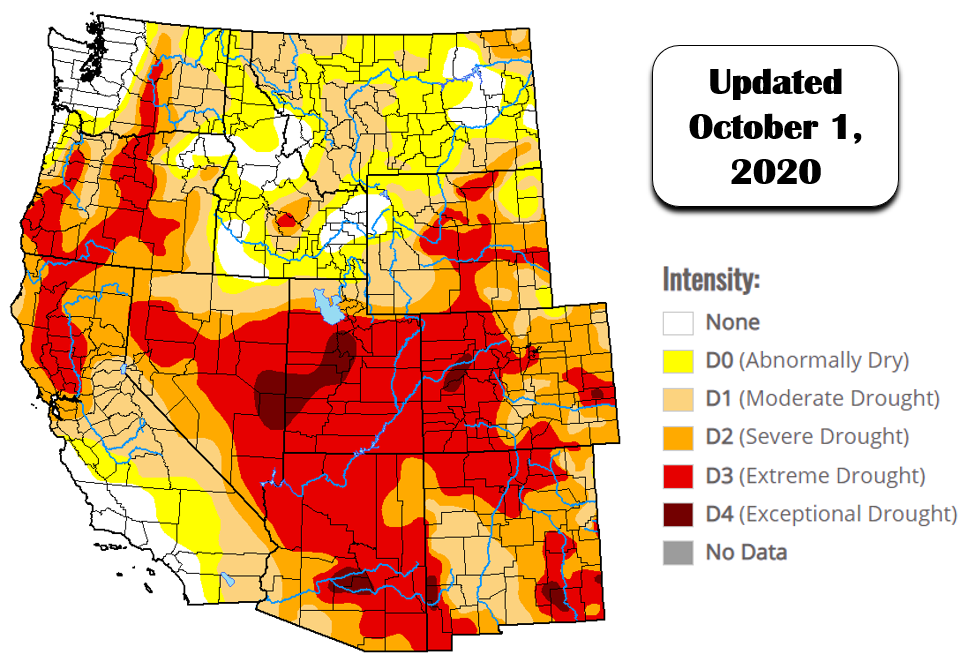
Given the outlook, drought conditions will likely intensify further across Colorado, while some reprieve seems possible this fall for the Pacific Northwest and far northern Rockies.
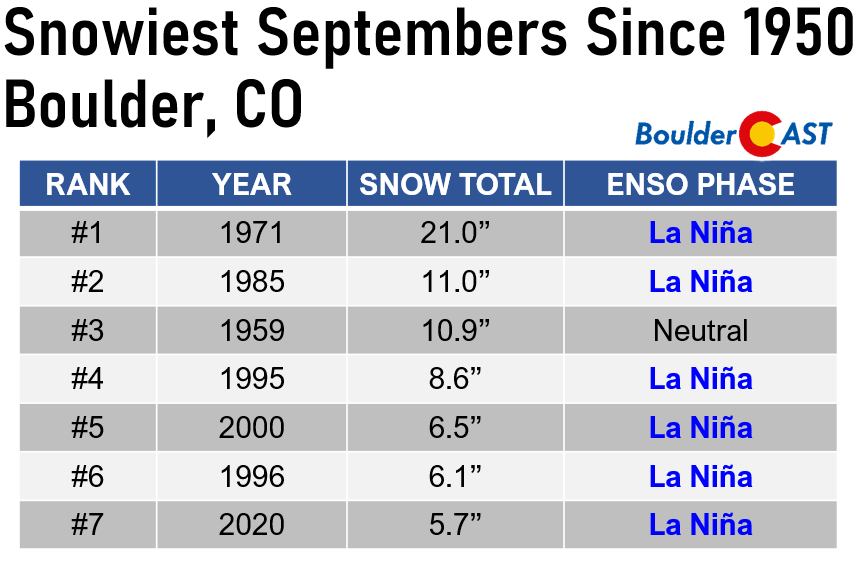
Colorado’s fate isn’t 100% sealed, though. ENSO just gives us an idea towards the most likely conditions to occur during the fall and winter. The “randomness” of Earth’s complicated weather patterns from year-to-year is much more dominant on our weather than ENSO could ever be. We do note that some of the wettest/snowiest autumn months in Boulder’s history have occurred during La Niñas (November 1983 & October 1984), so it’s not impossible that we squeak out some beneficial precipitation before the end of the year. It’s just not very likely. You never know though…we are already off to a excellent head-start in the snow department following the historic early snow last month, at least in Boulder. As it turns out, a snowy September in Boulder is exactly what one would expect during a La Niña. Go figure!
We discuss Boulder and Denver weather every single day on BoulderCAST Premium. Sign up today to get access to our daily forecast discussions every morning, complete six-day skiing and hiking forecasts powered by machine learning, access to all our Front Range specific weather models, additional storm updates and much more!
.
Enjoy this content? Please share it with your friends!
.


You must be logged in to post a comment.