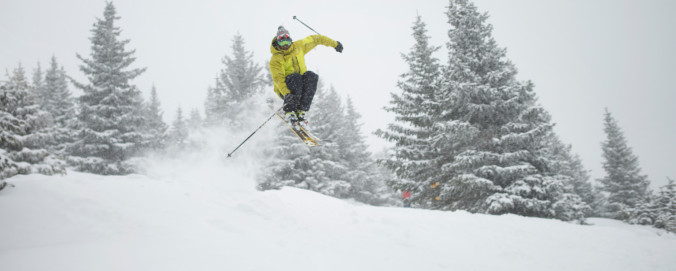
With a bulk of this winter’s snowfall now behind us, we’d like to take a moment to review the outcomes of our snowfall forecasts. From the early-season storm that flew completely under the radar, to the epic blizzards in late February and mid-March, it was a great year for powder across the Front Range! From the good, to the bad, to the downright ugly, we crunch the numbers to see how well our snowfall forecasts verified throughout the Denver Metro area across the entire winter season.
Accountability
Here at BoulderCAST, one of the biggest things we try to stress is accountability. While tracking and publishing our own accuracy can be a little nerve-racking, it’s one of the greatest practices that helps us to improve and get better. It shows us where our forecasts were off, by how much and how often, and it pushes us to learn and evolve for our future forecasting endeavors. While this type of transparency and full-disclosure makes us more vulnerable to criticism, we owe it to you, our followers.
Weather forecasters are often the butt of jokes, usually pertaining to how hit-and-miss our forecasts are. We’re often mocked…“Only a weather forecaster can be wrong all the time and still keep their job!” If more forecasters exhibited this same level of transparency to their followers, it would uncover poor forecasting techniques, force the bad forecasters out of the business, bring merit to the good forecasters, and raise the reputation of the profession in general. It’s not good for the industry, it’s not good for you, and it’s not good for the public when meteorologists are dodgy about their track record. When’s the last time you saw 9NEWS or the Weather Channel publish their outcomes or even own-up to a blown forecast?
As weather forecasters, it’s impossible to be right 100% of the time, even with the best computer models at our finger tips. The atmosphere is a non-linear, chaotic system; there is absolutely no shame in being wrong. Accountability doesn’t imply that we need to be right ALL of the time. Accountability is simply our obligation to look you in the eye and admit when mistakes have been made and to help you set realistic expectations for our future weather forecasts.
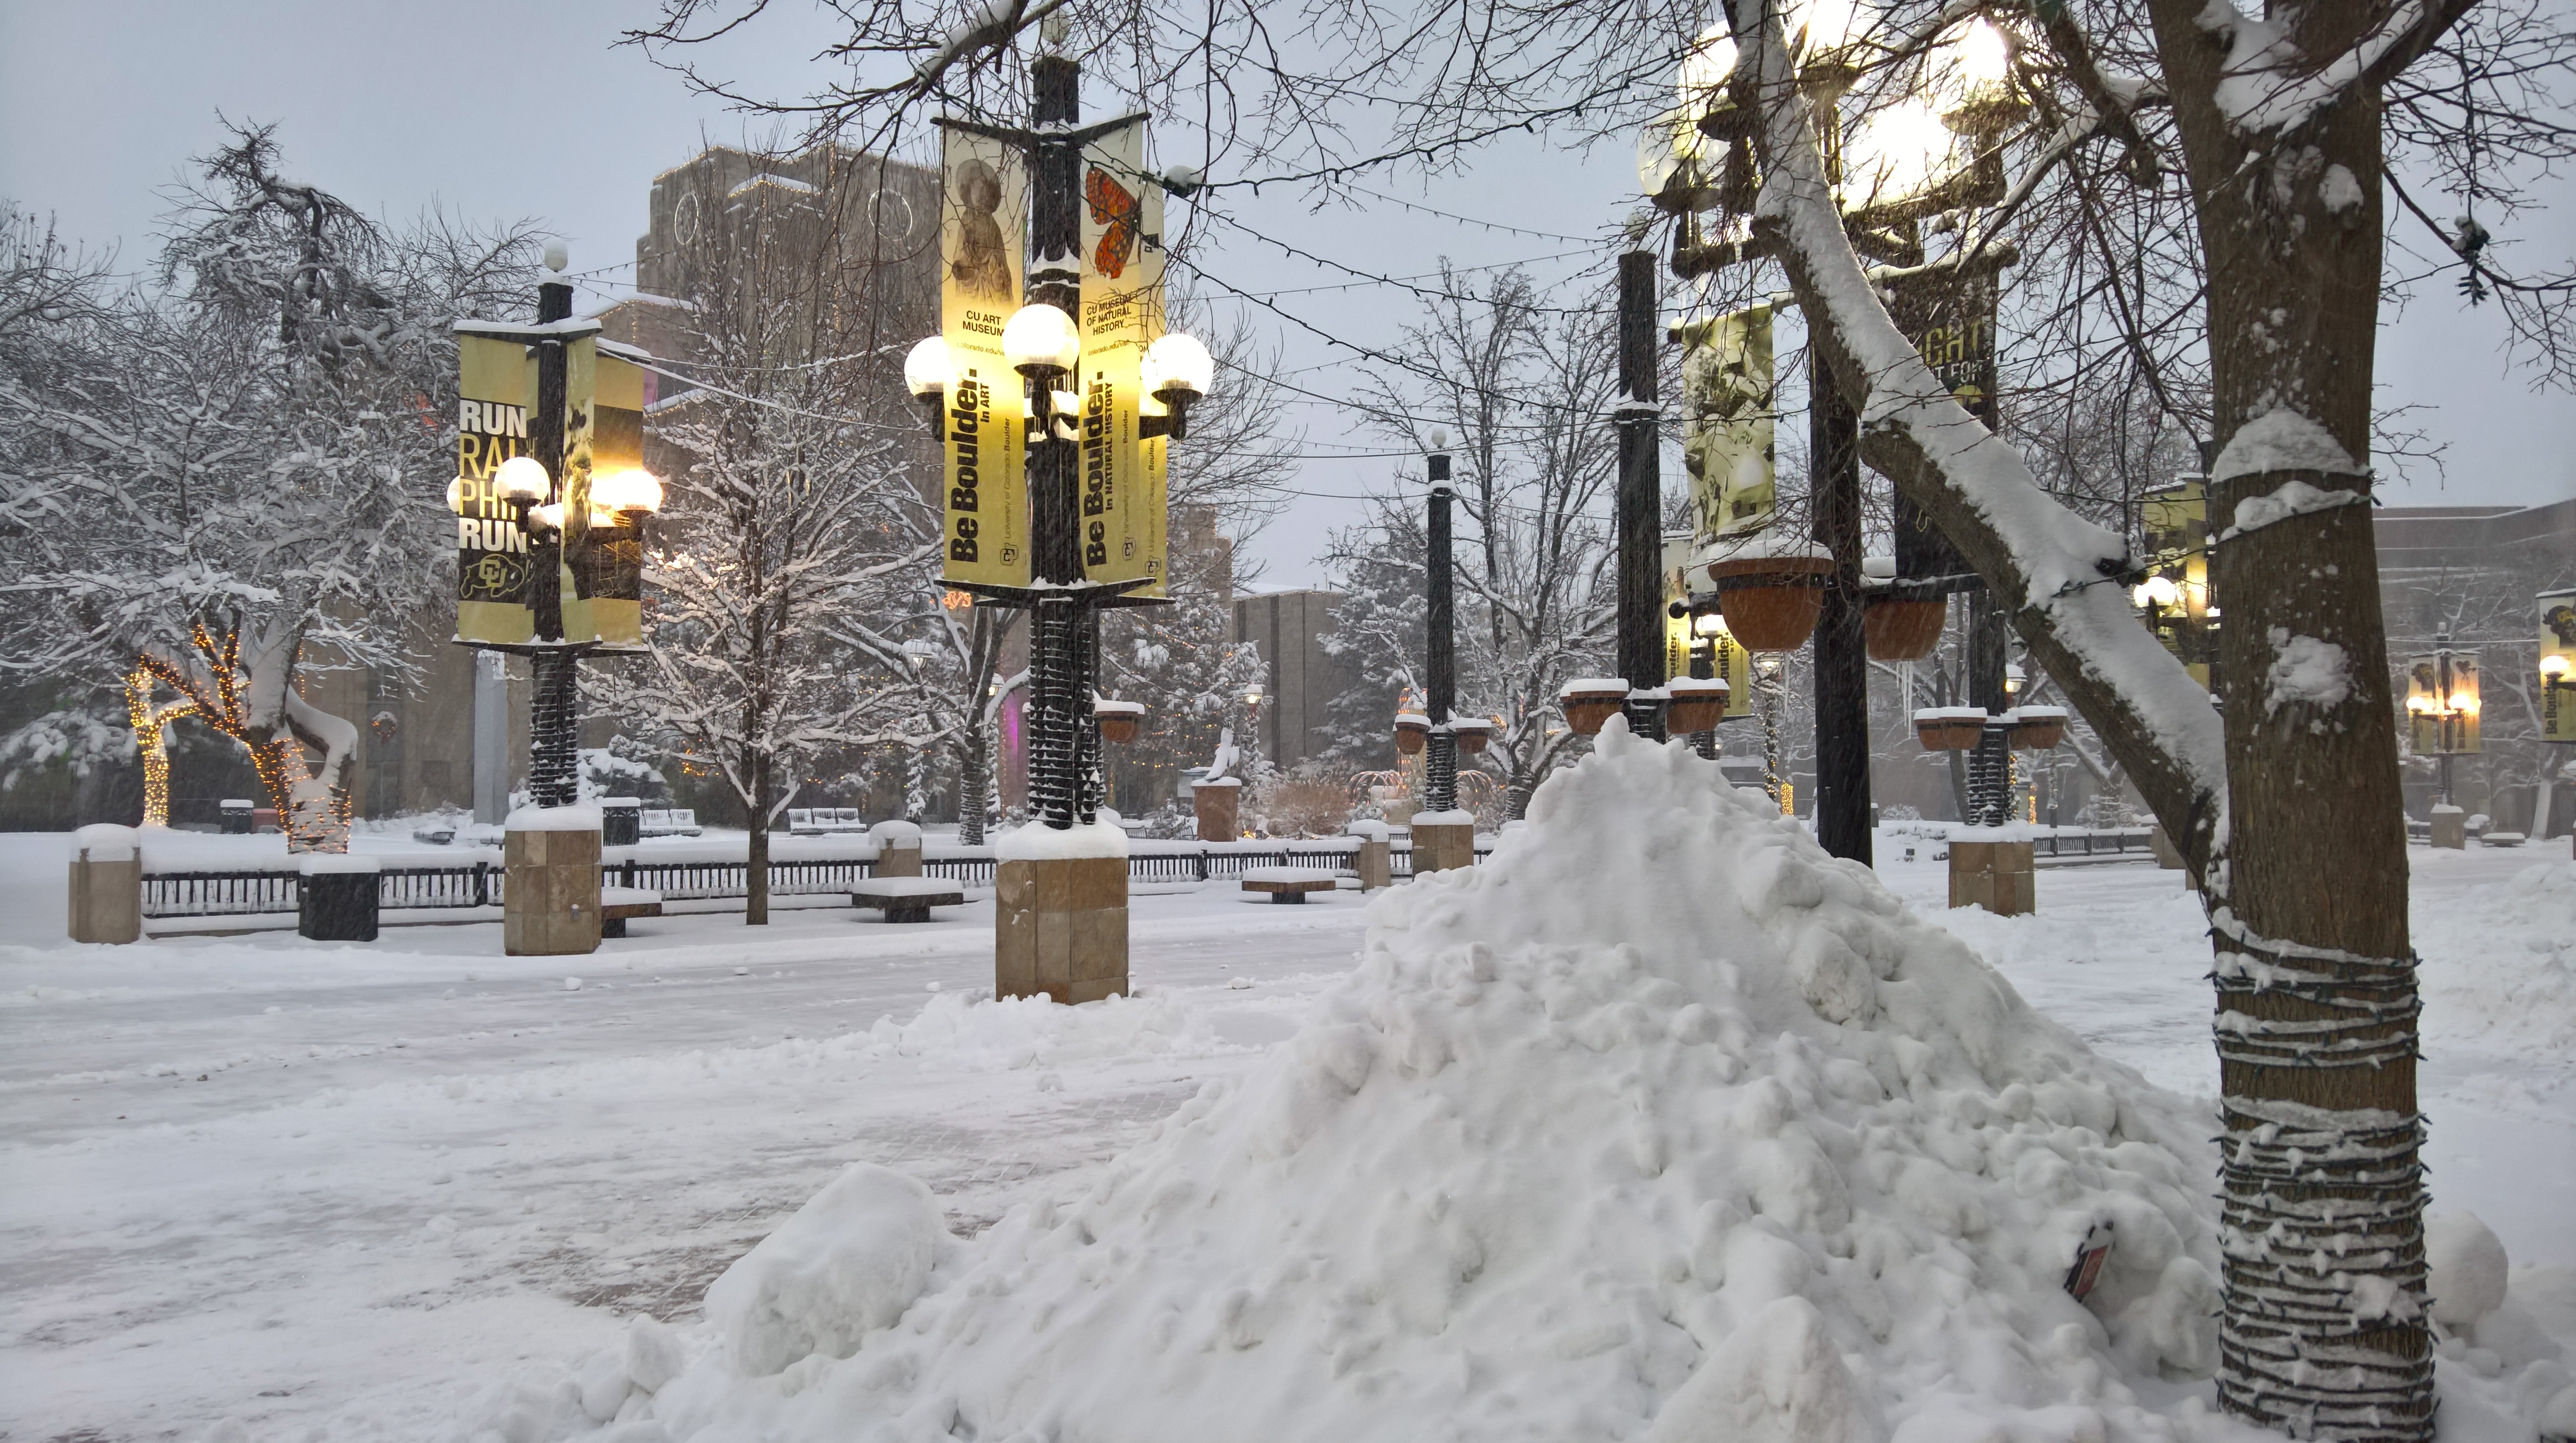
Pearl St. Mall, December 15, 2015
A great year for forecasting snow!
El Niño’s tendency to produce bigger Front Range snow storms has definitely materialized this winter. Boulder has climbed to a seasonal snow total of 106″, including three storms that exceeded 15″. Since 1950, 19 out of 36 (53 %) 15+” snowstorms have occurred during active El Niños.
If a Front Range forecaster can thrive given what Mother Nature has thrown this winter, other years should be a stroll through the park!
Below we verify our forecasts for a winter’s worth of snowstorms! There were a total of 15 different events for which we issued “official” snowfall forecasts, spanning a time period from November 10th to April 30th. Almost all of these “final” forecasts were issued at least 12 hours before any flakes started flying. Some were posted more than one day in advance.
It’s never good to simply cherry-pick a few places and only show where we’re accurate. Accountability… remember? We have included a fairly comprehensive list of 18 locations spread over 8 counties across the northern Denver Metro area, including some of the smaller towns in the Foothills.
We gave a “Yay” or “Nay” as a correct forecast for each of the 15 events at each location. To be labeled as a correct forecast, the observed snow total needed to be within 1″ of our given forecast range. If it was outside that “buffer inch”, we deemed that forecast incorrect.
| City | % Correct | # Under-forecasted | # Over-forecasted |
|---|---|---|---|
| Allenspark | 81% | 2 | 1 |
| Aurora | 80% | 2 | 1 |
| Berthoud | 73% | 3 | 1 |
| Boulder | 73% | 3 | 1 |
| Broomfield | 67% | 4 | 1 |
| Denver (DIA) | 80% | 1 | 2 |
| Denver (downtown) | 87% | 2 | 0 |
| Erie | 67% | 3 | 2 |
| Estes Park | 88% | 1 | 1 |
| Genesee | 69% | 5 | 0 |
| Golden | 73% | 3 | 1 |
| Jamestown | 88% | 1 | 1 |
| Lakewood | 93% | 1 | 0 |
| Longmont | 80% | 2 | 1 |
| Lyons | 87% | 1 | 1 |
| Nederland | 81% | 2 | 1 |
| Niwot | 80% | 2 | 1 |
| Superior/Louisville | 73% | 3 | 1 |
Okay, let’s get the elephant in the room taken care of right away. We were only correct for the city of Boulder 73% of the time this winter (11 out of 15 storms). Our four shortcomings were:
- The monster snowstorm in late March which shifted west in the final hour, bringing 16″ of snow to Boulder (when we only forecasted 5-12″).
- Another, weaker storm a week earlier in March dumped 15″ in Boulder, just above our forecast of 5-12″. For this storm, we forecasted well above all the other weather outlets. The National Weather Service only had a winter weather advisory for Boulder for this event, calling for 3 to 6 inches.
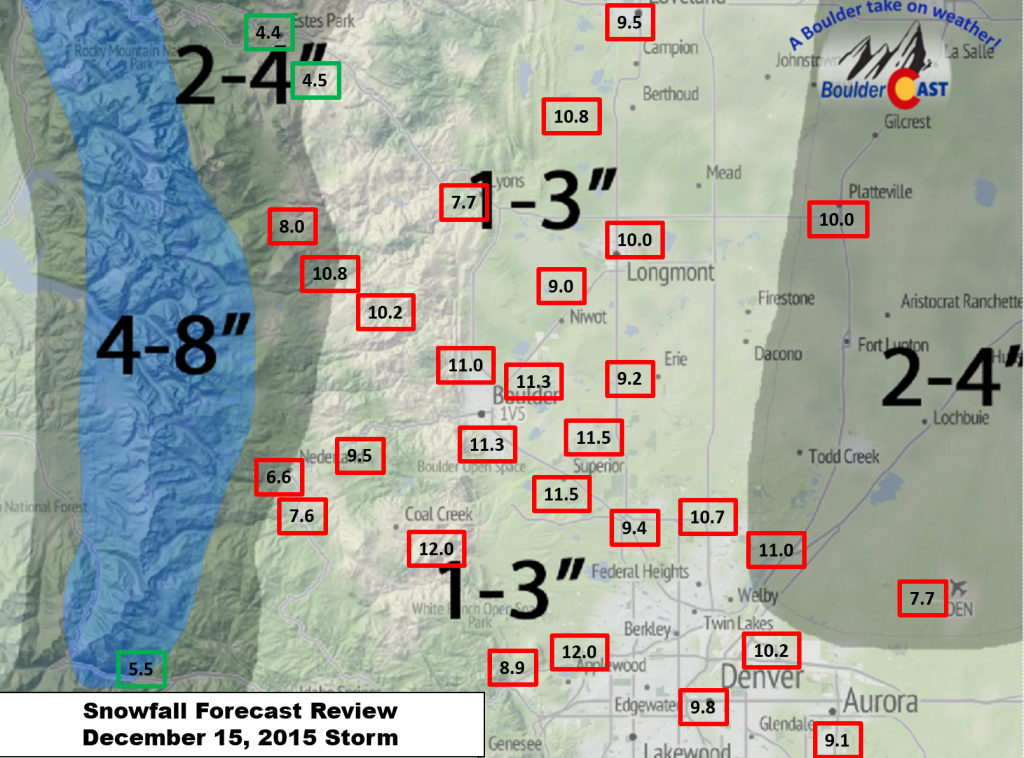
- December 15th “surprise storm” which shifted westward at the last minute as well. Our final forecast called for 1-3″, but Boulder (and most of the Denver area) managed 11″. We did post an update right before it began snowing that our forecast was probably going to be too low. We covered what wen’t wrong with this forecast in a prior post.
- Mid-November “Snowmagedon” storm that was hyped for many days leading up to the event for 1-2 feet of snow in Denver and south. Boulder was on the fringe of the storm, but even our 3-7″ forecast was too high. Boulder remained mostly rain and recorded less than 1″ of snow. The storm as a whole under-performed across all of Denver.
We didn’t over-pad our statistics with small, insignificant storms either. We nailed 8 out of 11 events where at least 3″ of snow was recorded in the city (70%), and 4 out of 7 storms that dumped at least 5″ (57%). Three out of the four mistakes were under-forecasts (it snowed above our forecast range).
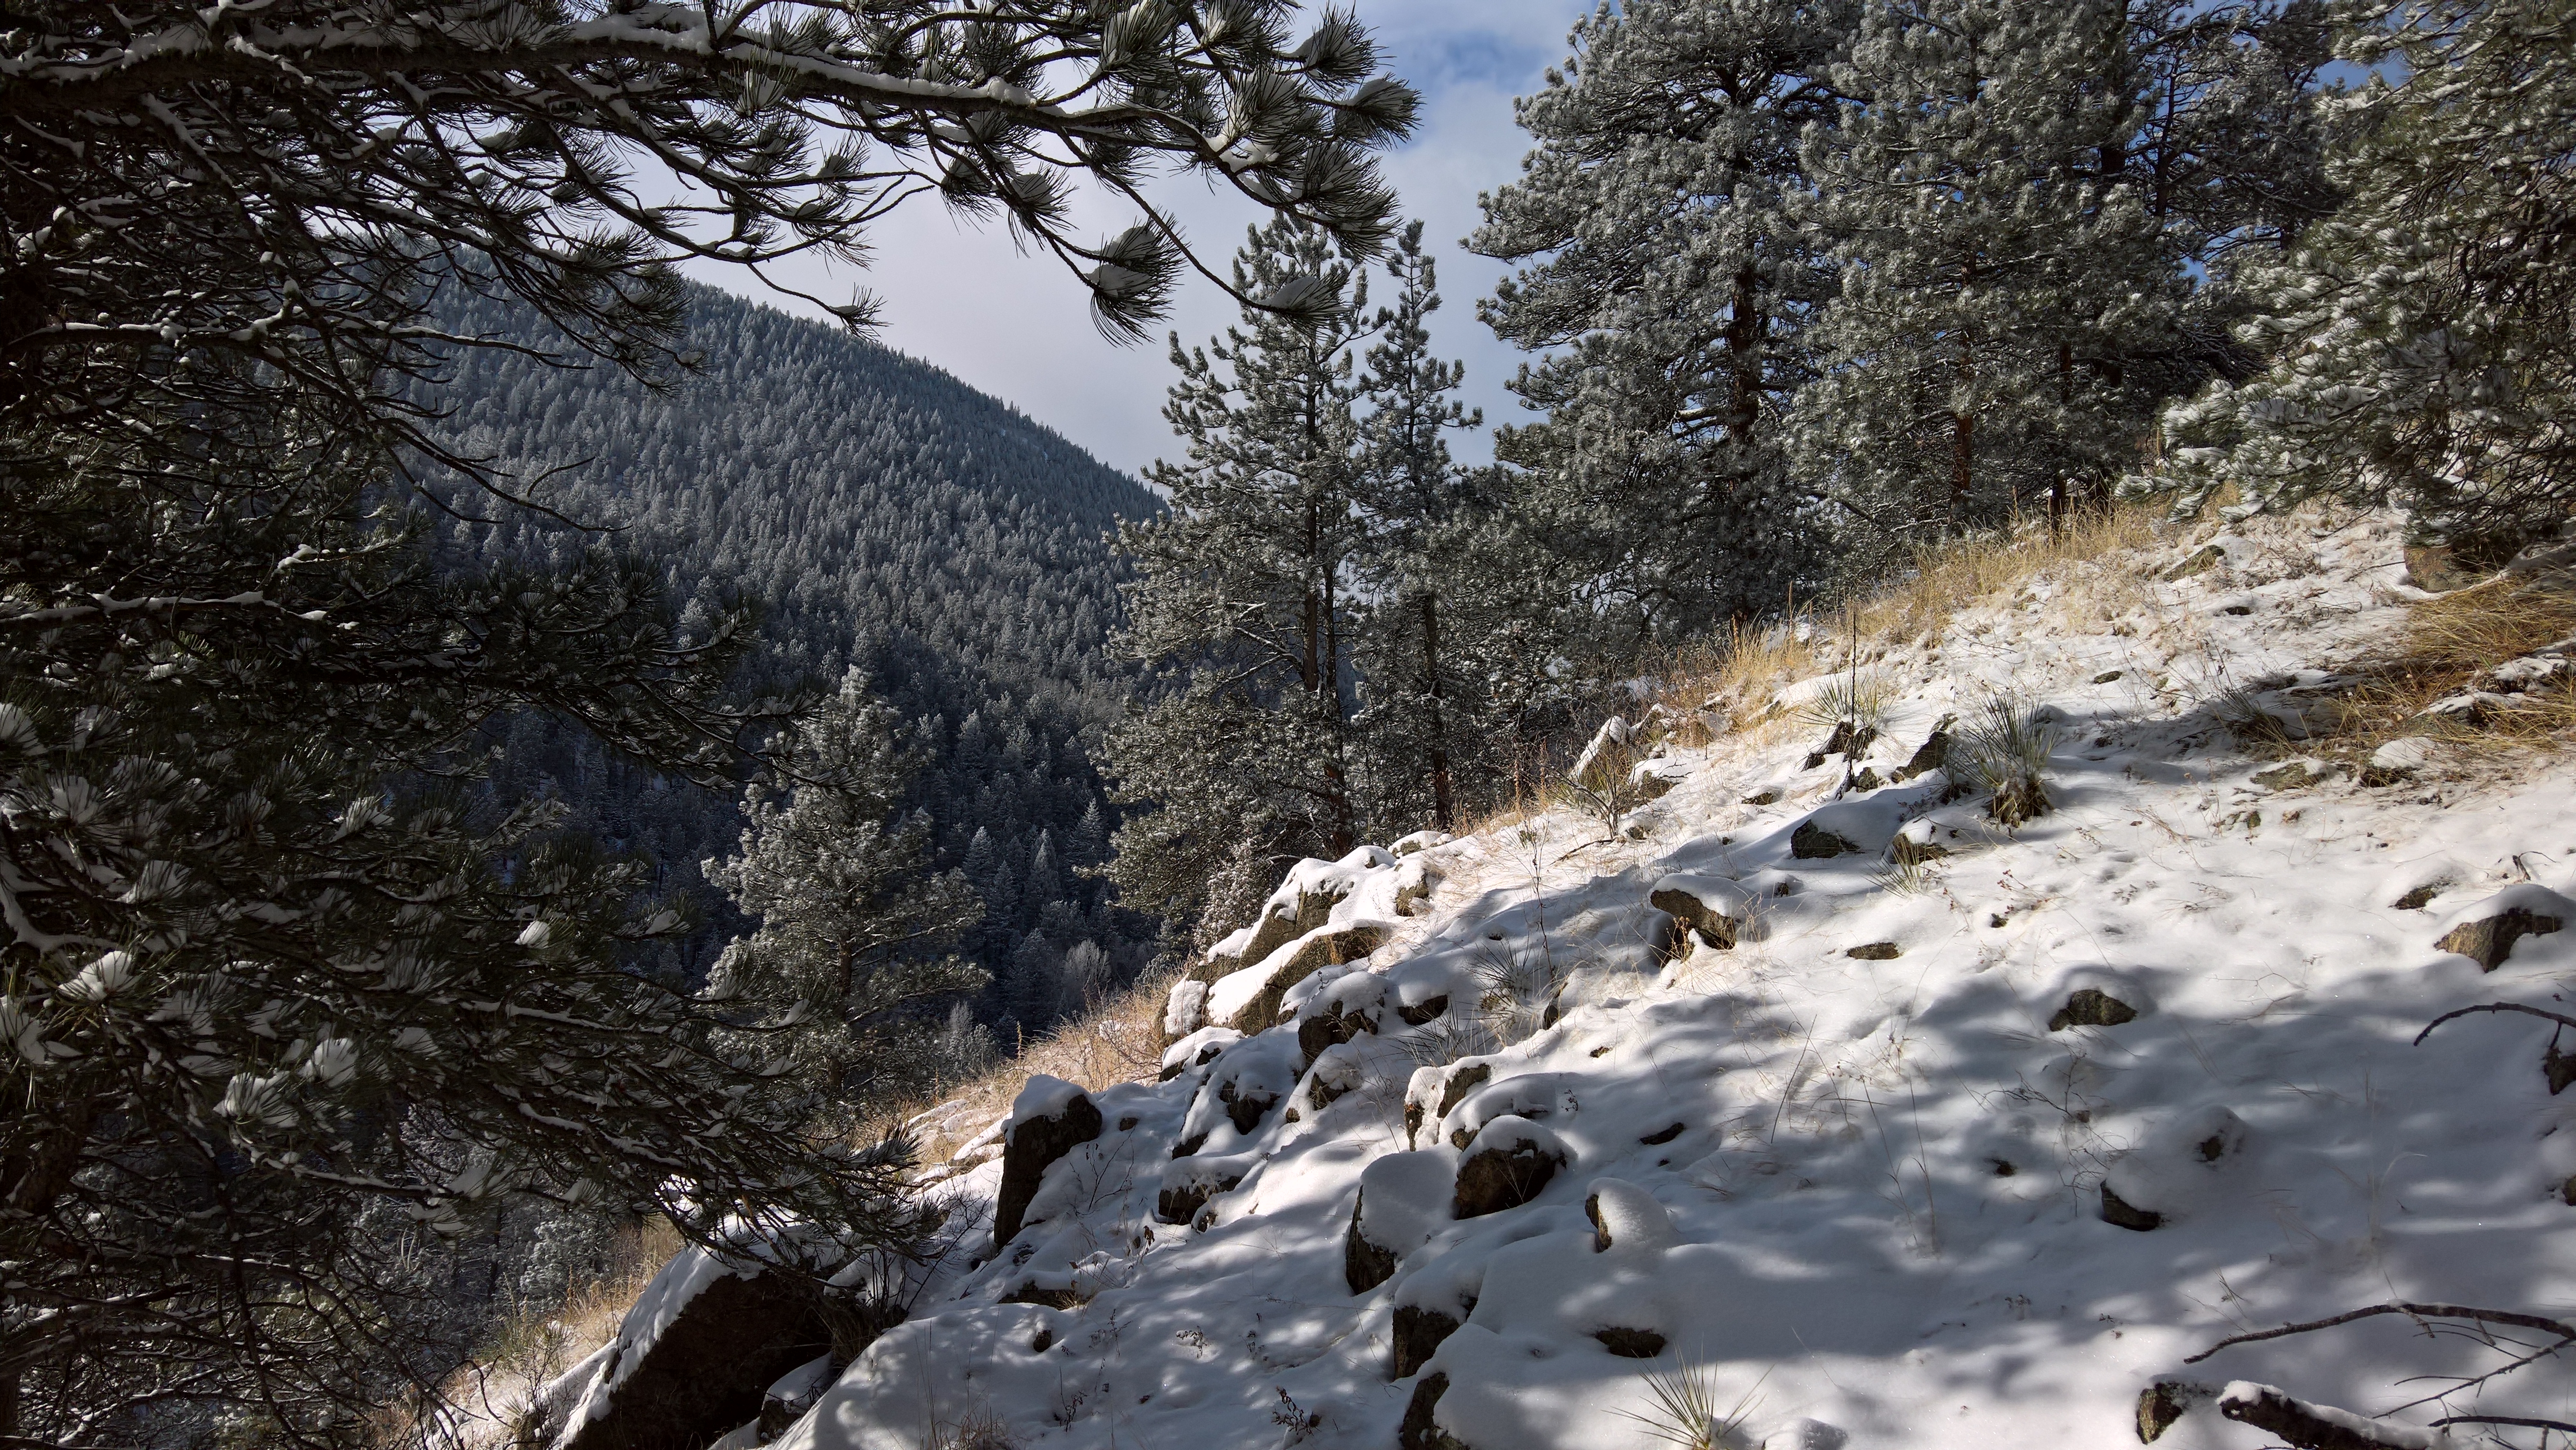
Lefthand Canyon, early March 2016
Overall, we’re happy with our results in the city for which our company is aptly named. We guarantee you won’t be able to find another weather outlet with a better track record in Boulder. Of all the populated locations across the Front Range, Boulder is definitely one of the most unpredictable, especially when forecasting snowfall.
Looking at the results from around the rest of the Denver Metro area, we tend to be correct 70-90% of the time. This is particularly evident in the Foothills locations (Nederland, Allenspark, Genesee, Estes Park etc). At first this may seem a little odd. Don’t the Foothills have even more complex topography than the lower elevations? Yep! That’s just it. They do, and we usually account for this elevated ambiguity with comparatively wider forecast ranges for the Foothills and Mountains. It’s easier to hit a bigger target, as they say.
Our brightest shining star was Lakewood, with 93% of snow forecasts being correct! We only tripped up on one of the 15 storms this winter here. Though, we’re also happy with percentages near or above 80% in most of Denver proper!
Want more specifics for your location? Check out THIS spreadsheet for all the gory details for every storm at each location and a conglomeration of all the statistics. Furthermore, we have included links to all of our wintry forecasts and recaps below, as well as a quick-look photo for a visualization of how each storm turned out across the Front Range.
Thanks for reading!
Let is know in the comments how we did in your specific location. We’d love to hear both your positive and negative feedback!
Keep it tuned to BoulderCAST as we progress into severe weather season and eventually, the summer monsoon. Of course, now that we posted a winter recap, you know there will be one more late season snow day. Enjoy!
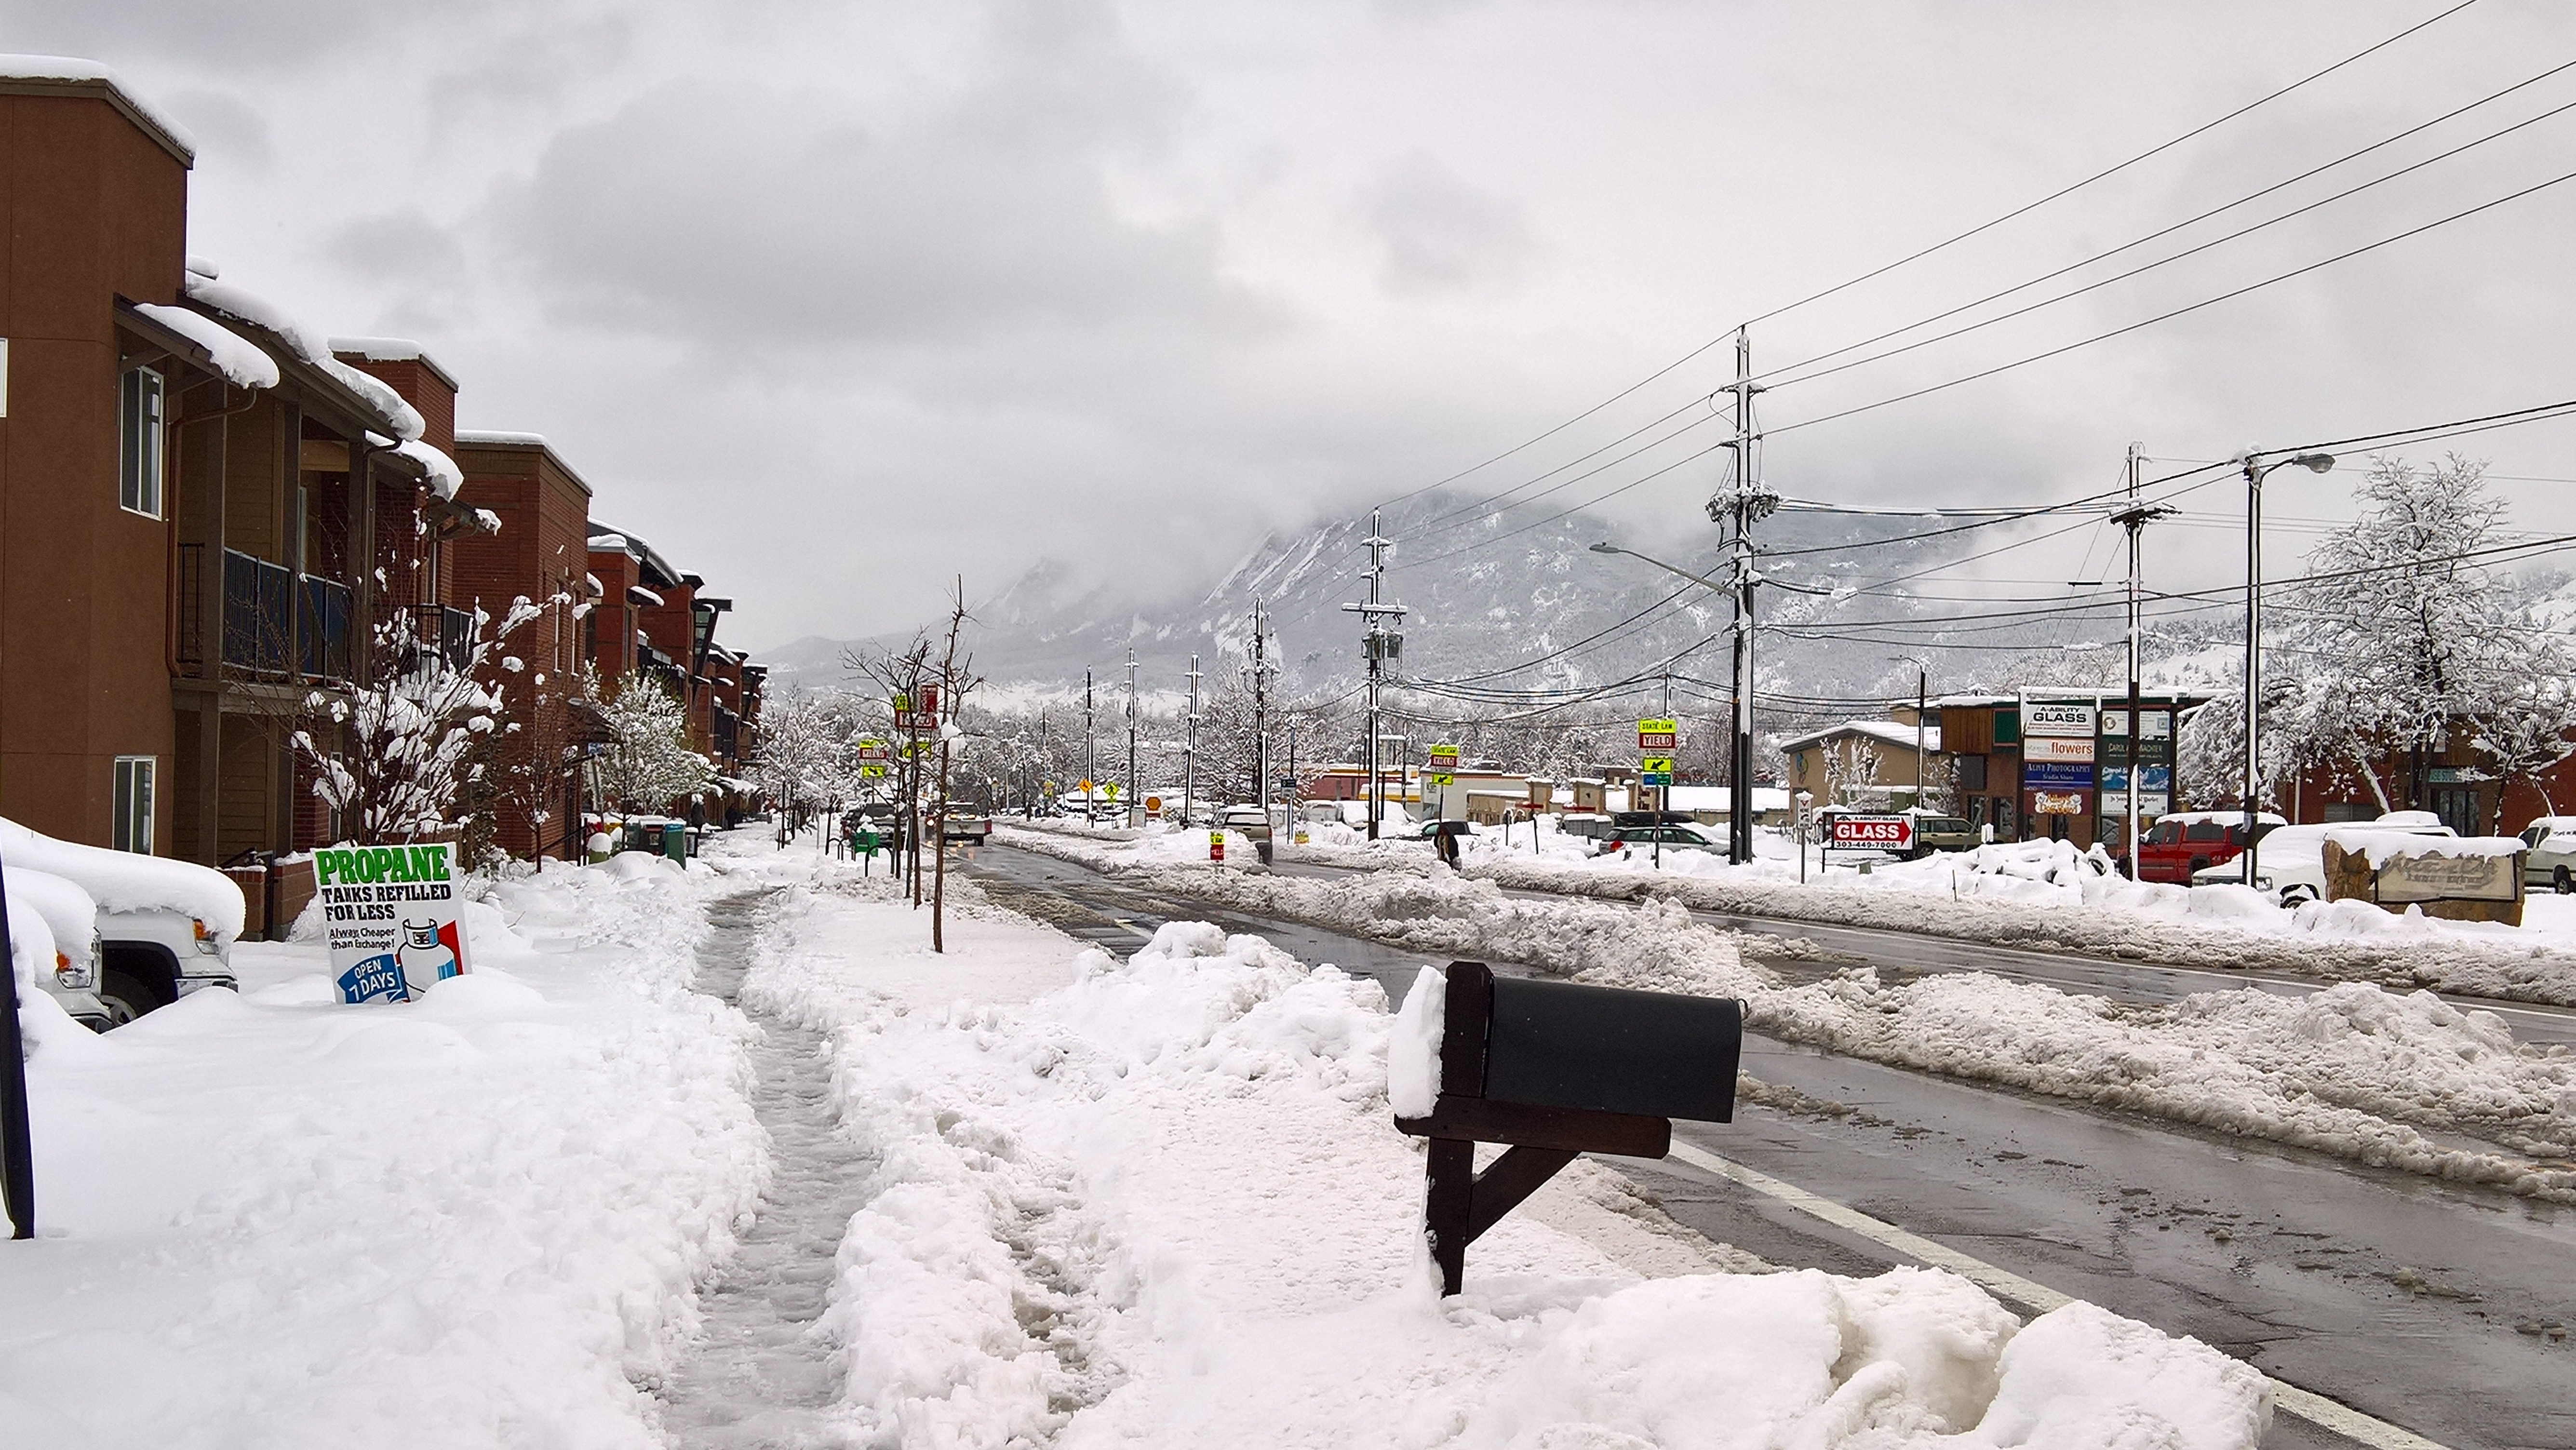
North Broadway, February 2, 2016
2015-16 Storm Summaries (reverse chronological order)
May 16-17, 2016
Boulder: None (None forecast)
Denver: None (None forecast)
Storm Forecast / Recap

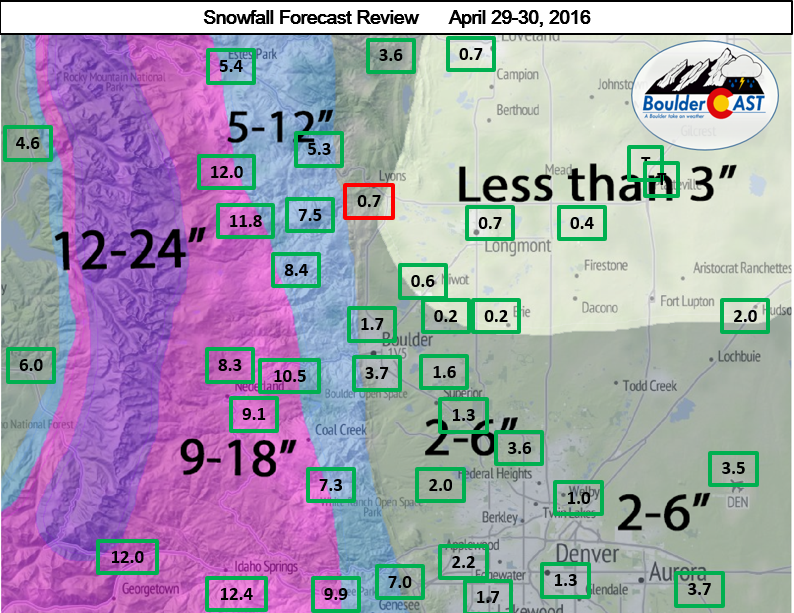
April 29-30, 2016
Boulder: 3.8″ (2-6″ forecast)
Denver: 3.5″ (2-6″ forecast)
Storm Forecast / Recap
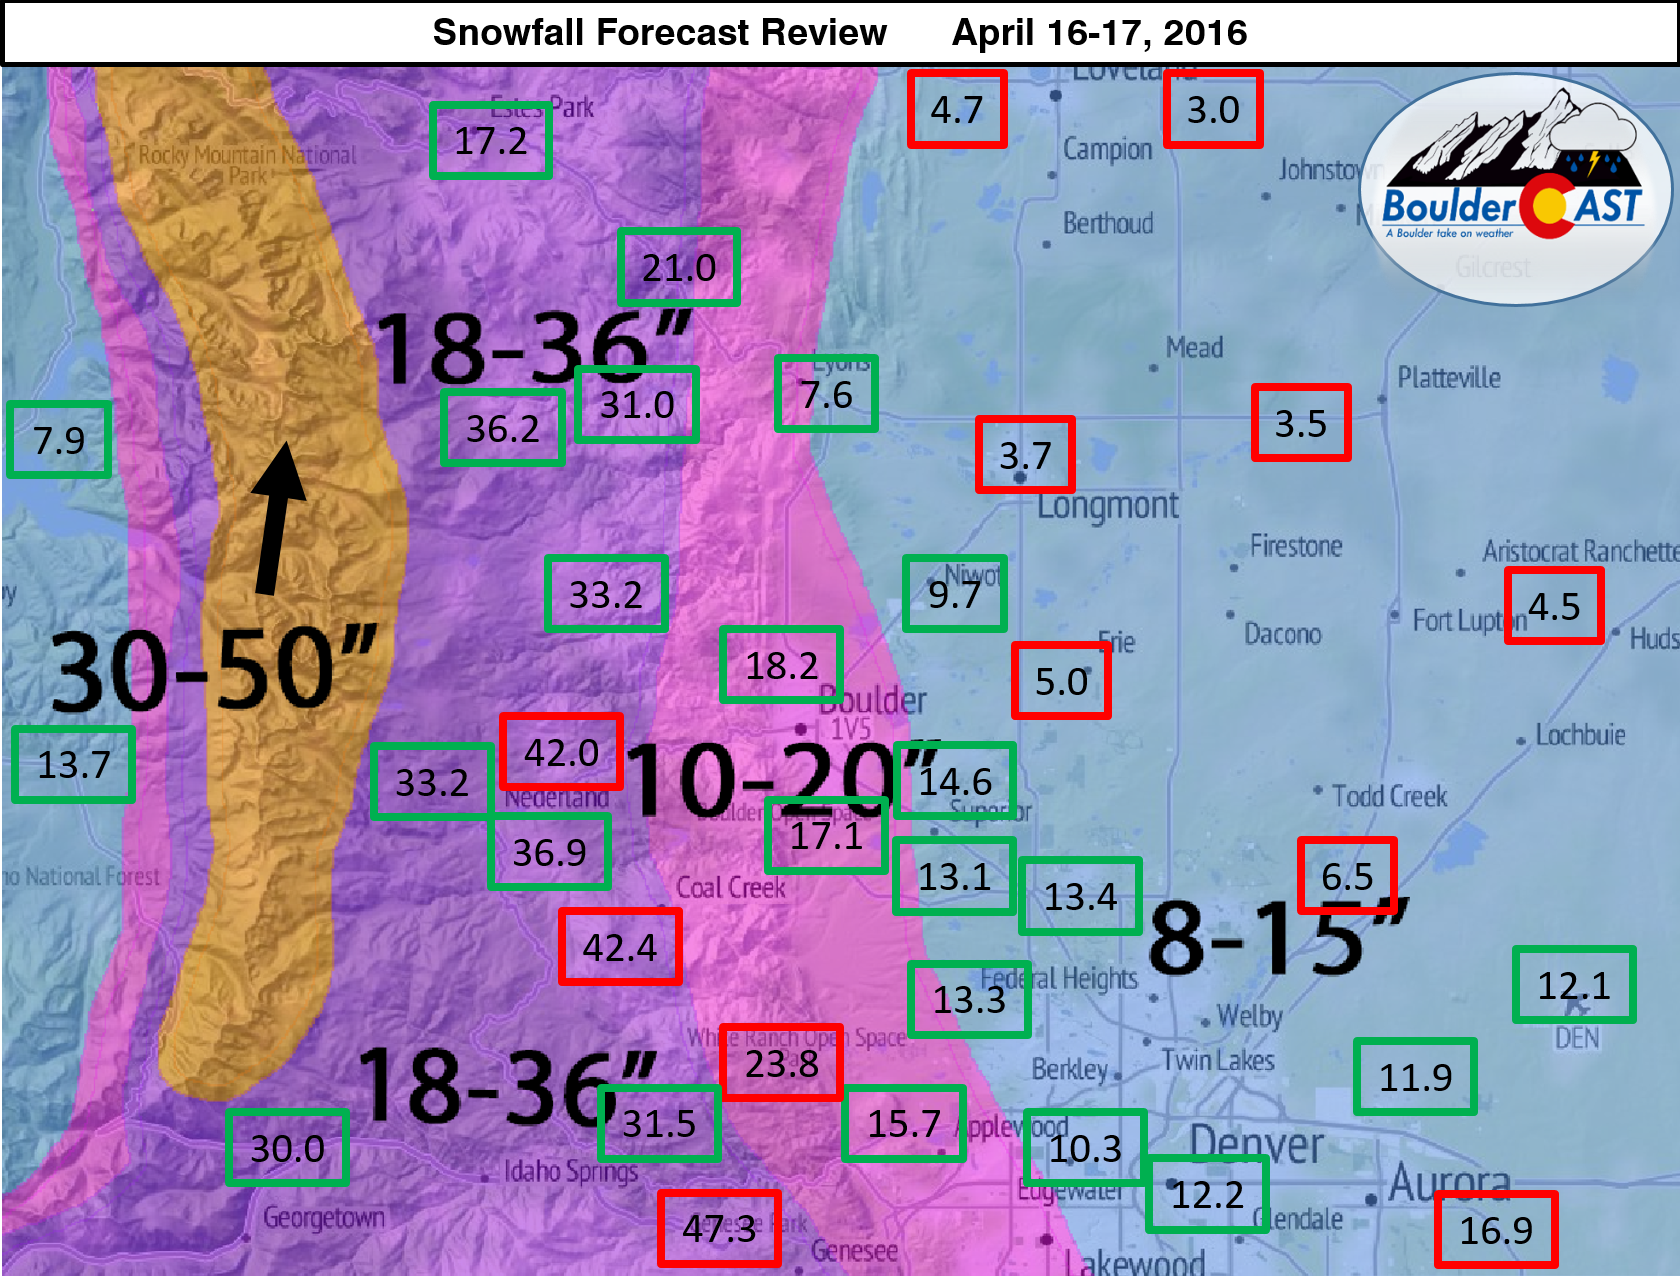
April 16-17, 2016
Boulder: 18.3″ (10-20″ forecast)
Denver: 12.1″ (8-15″ forecast)
Storm Forecast / Recap
March 31, 2016
Boulder: Trace (1-3″ forecast)
Denver: None (Less than 1″ forecast)
Storm Forecast / Recap

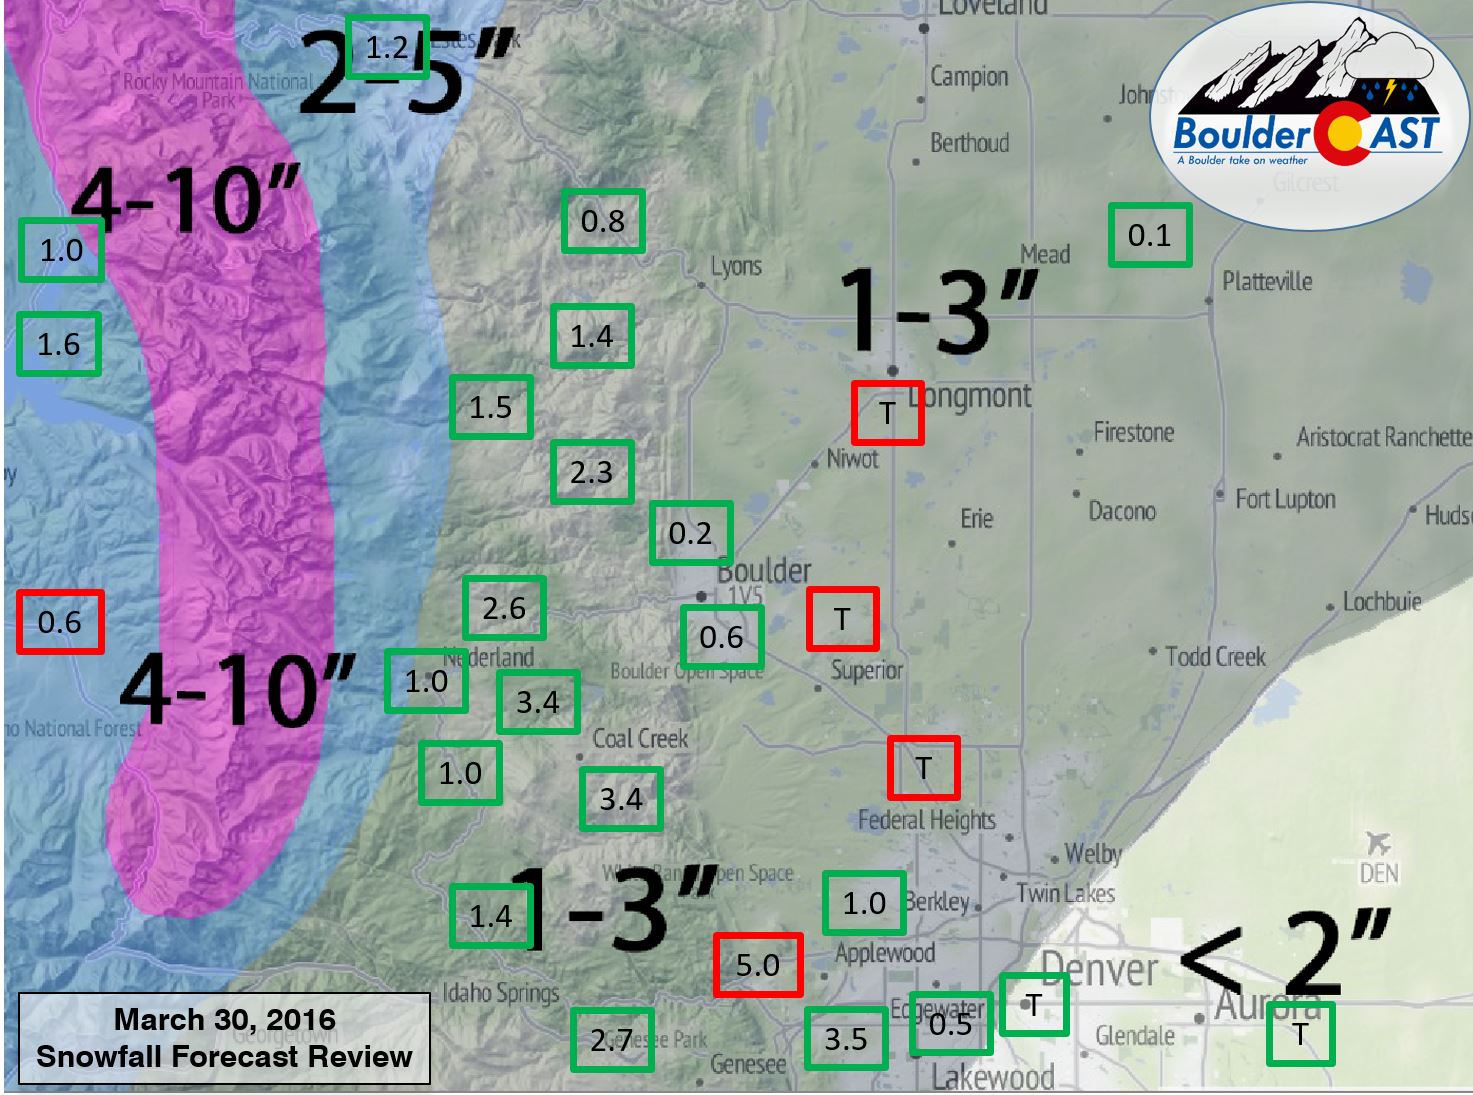
March 30, 2016
Boulder: 0.6″ (1-3″ forecast)
Denver: None (Less than 2″ forecast)
Storm Forecast / Recap
March 23-24, 2016
Boulder: 16.4″ (5-12″ forecast)
Denver: 13.1″ (5-12″ forecast)
Storm Forecast / Recap
*No map available*
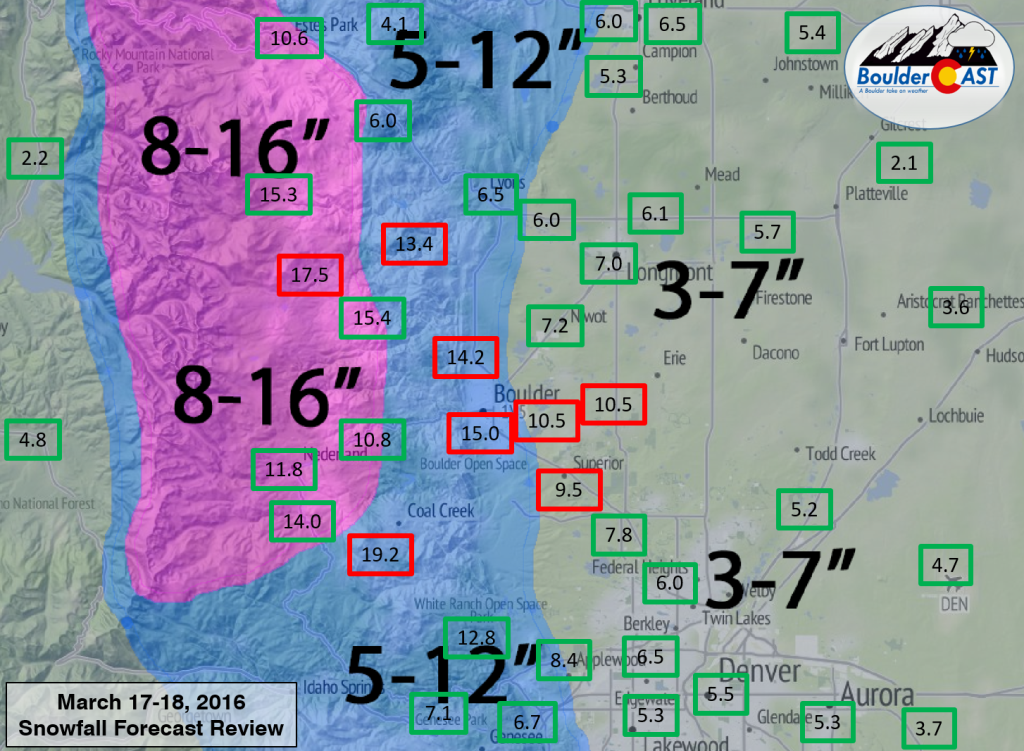
March 17-18, 2016
Boulder: 15.0″ (5-12″ forecast)
Denver: 4.7″ (3-7″ forecast)
Storm Forecast / Recap
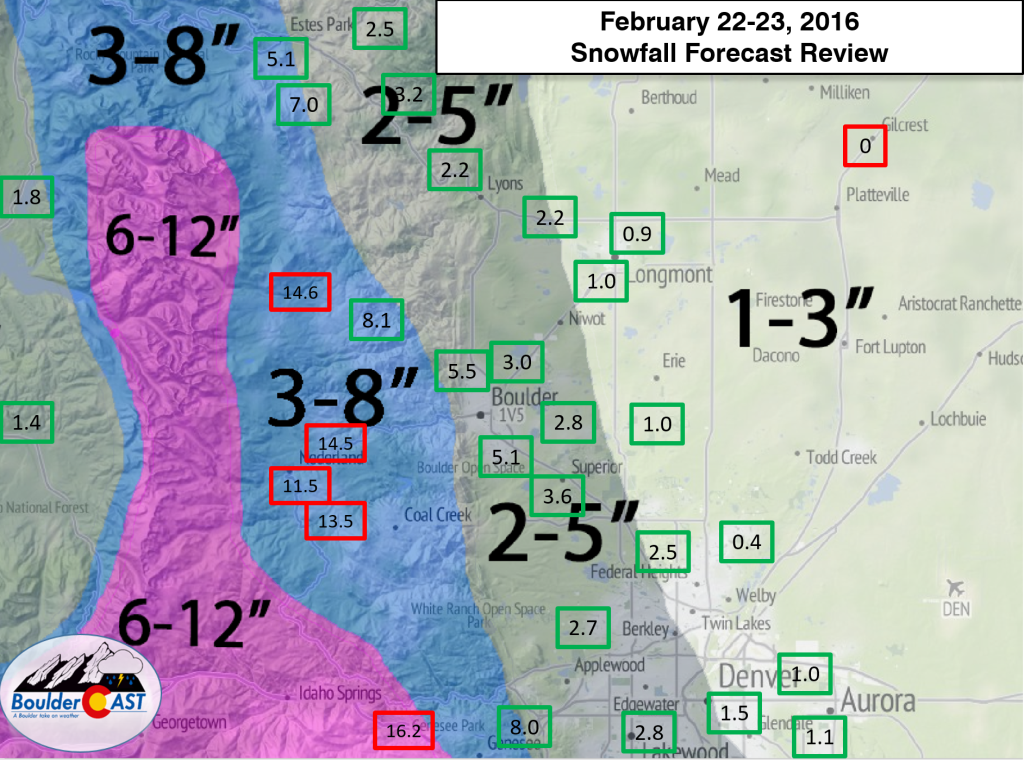
February 22-23, 2016
Boulder: 5.2″ (2-5″ forecast)
Denver: None (1-3″ forecast)
Storm Forecast / Recap
January 31-February 2, 2016
Boulder: 17.4″ (10-16″ forecast)
Denver: 11.6″ (6-12″ forecast)
Storm Forecast / Recap

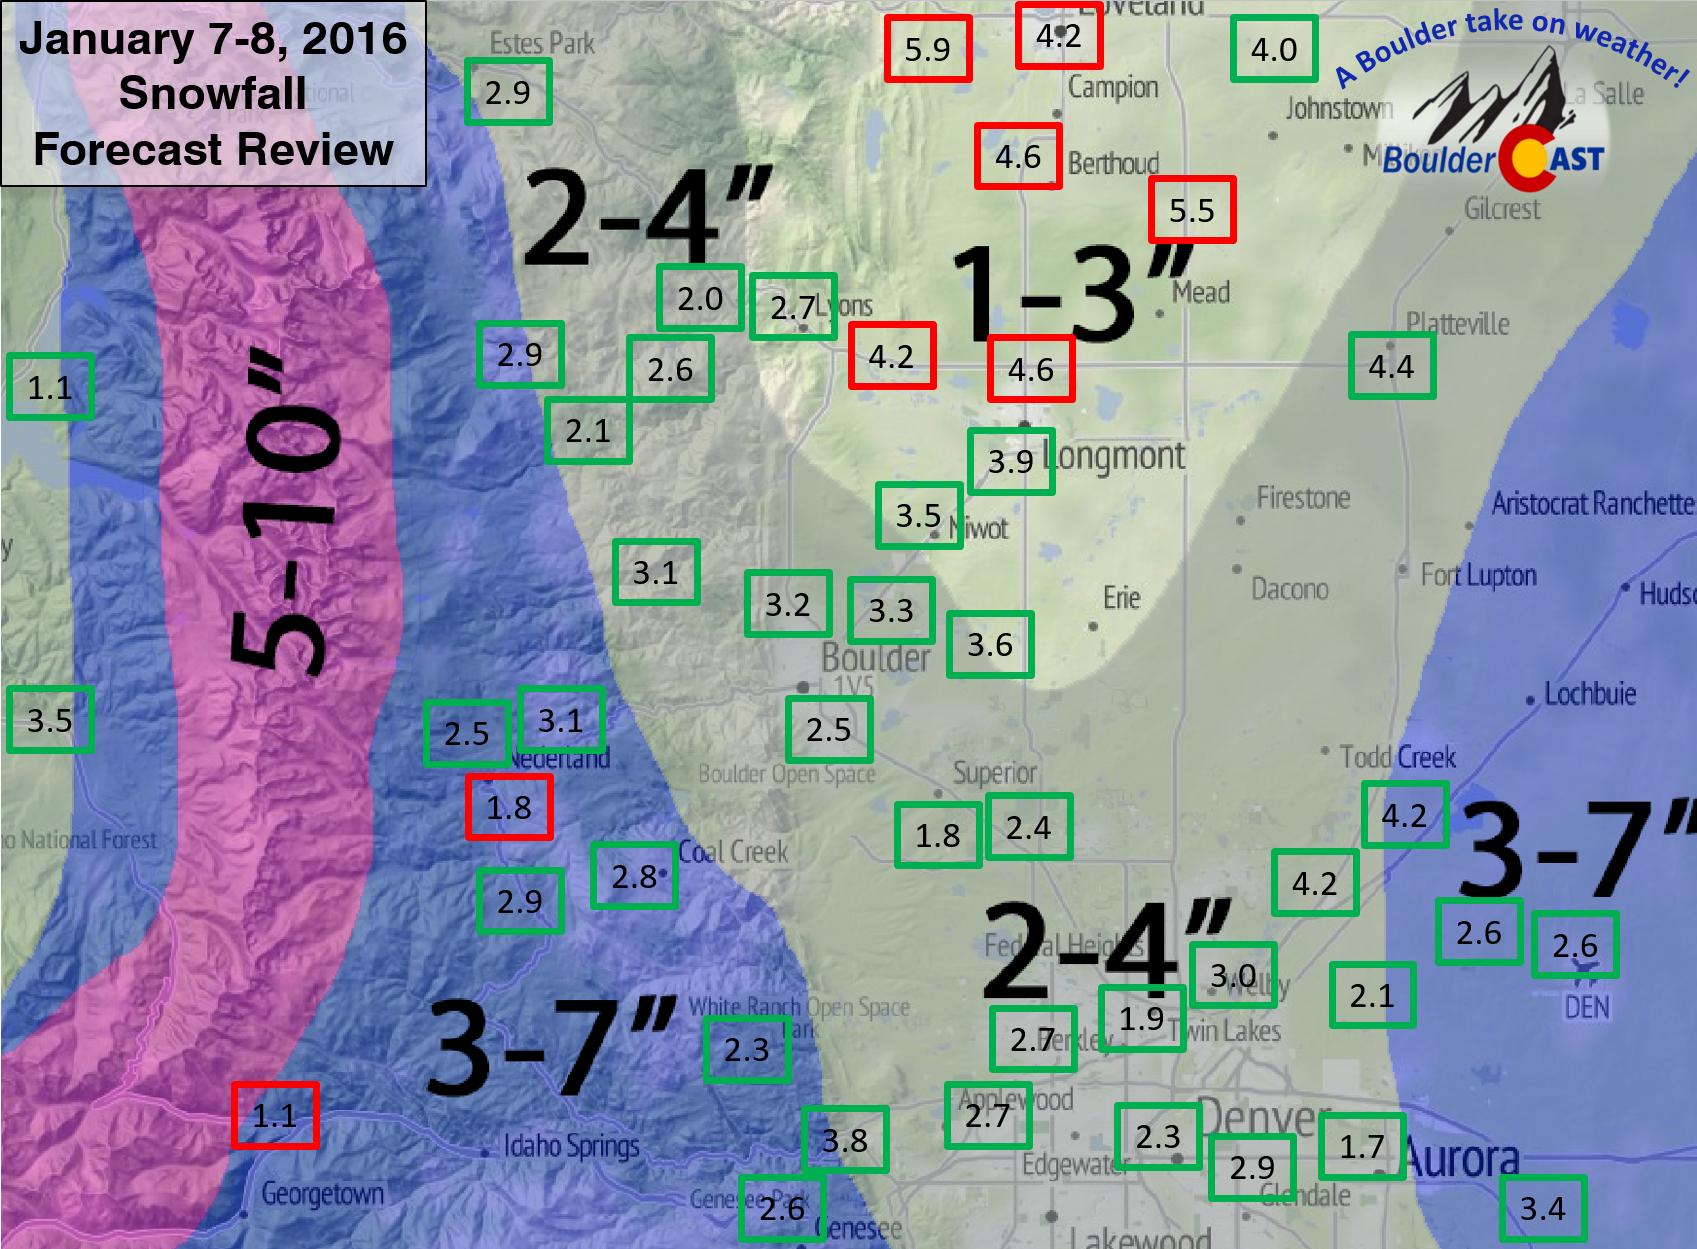
January 7-8, 2016
Boulder: 2.5″ (2-4″ forecast)
Denver: 2.6″ (3-7″ forecast)
Storm Forecast / Recap
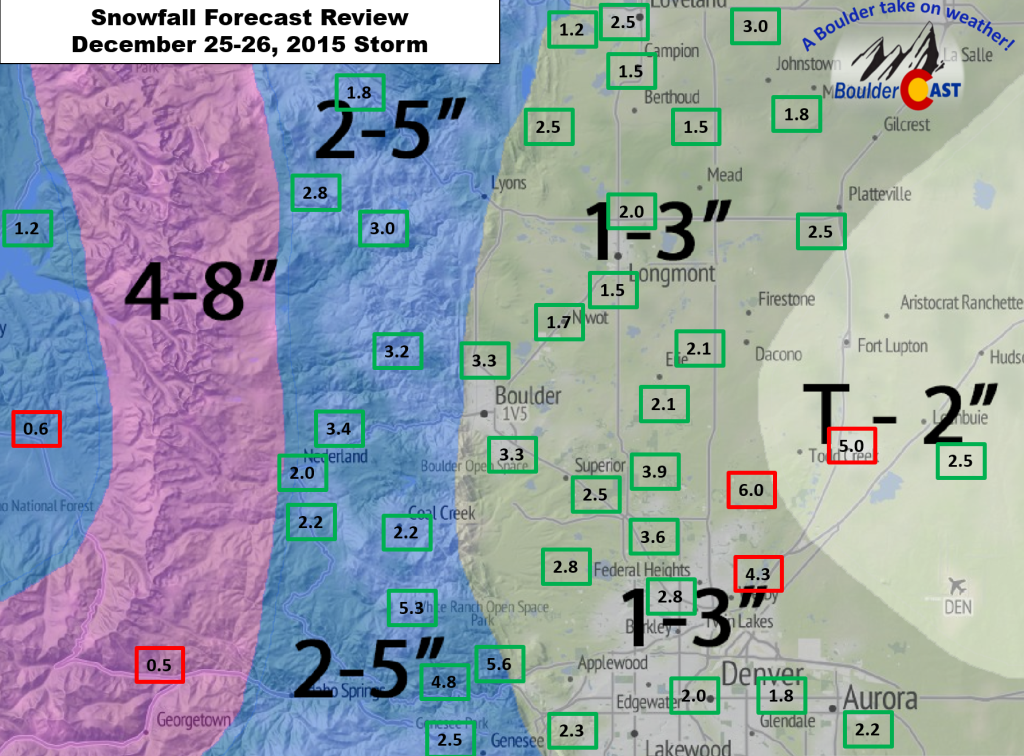
December 25-26, 2015
Boulder: 2.6″ (1-3″ forecast)
Denver 3.3″ (T-2″ forecast)
Storm Forecast / Recap
December 14-15, 2015
Boulder: 11.3″ (1-3″ forecast)
Denver 7.7″ (2-4″ forecast)
Storm: Forecast / Recap
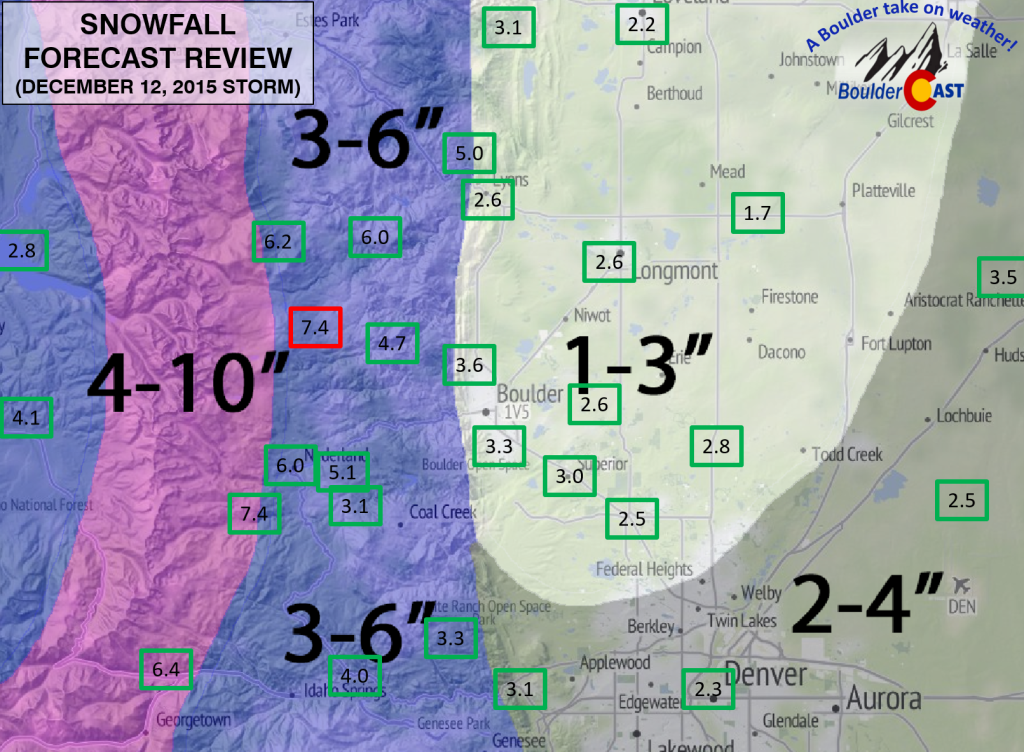
December 12-13, 2015
Boulder: 3.3″ (1-3″ forecast)
Denver: 1.3″ (2-4″ forecast)
Storm Forecast / Recap
November 26-27, 2015
Boulder: 7.1″ (3-8″ forecast)
Denver: 1.3″ (2-5″ forecast)
Storm Forecast / Recap

November 16-17, 2015
Boulder: 0.1″ (3-7″ forecast)
Denver: 4.0″ (6-12″ forecast)
Storm Forecast / Recap

November 10-11, 2015
Boulder: 1.7″ (2-5″ forecast)
Denver: 2.3″ (2-5″ forecast)
Storm Forecast
*No map available*


You must be logged in to post a comment.