Check out seven unique graphics we created recapping 2018’s weather!
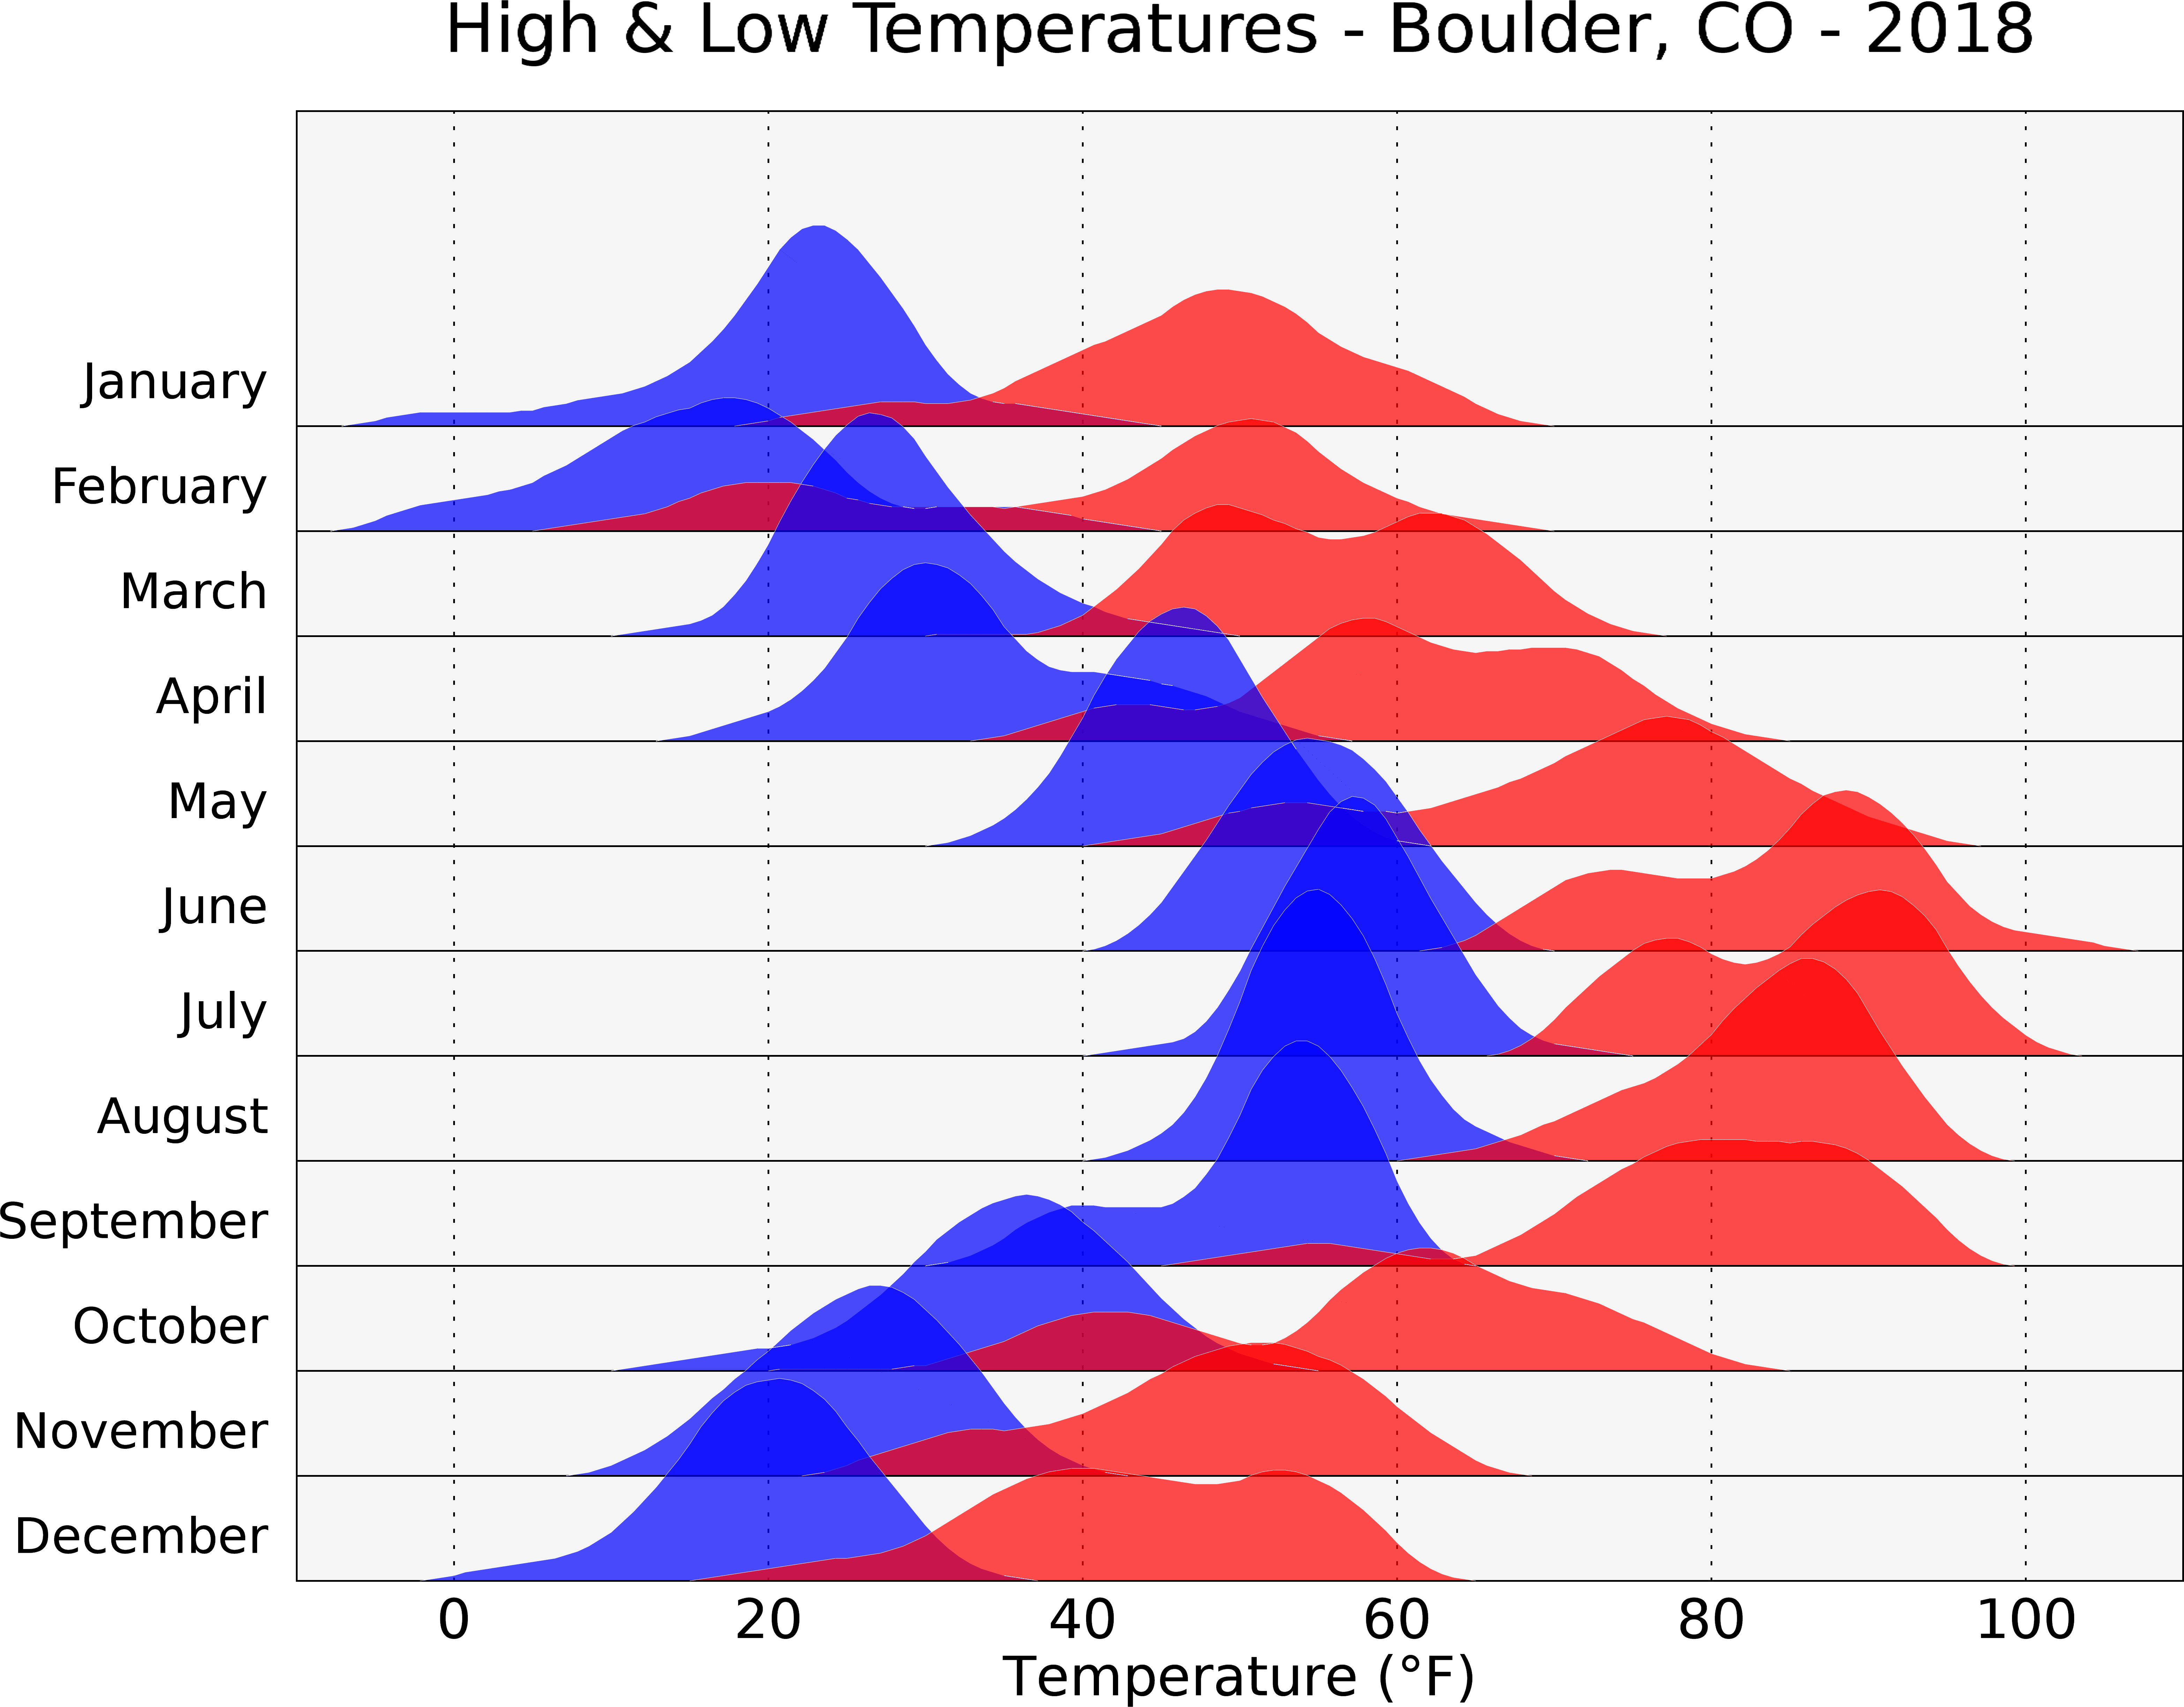
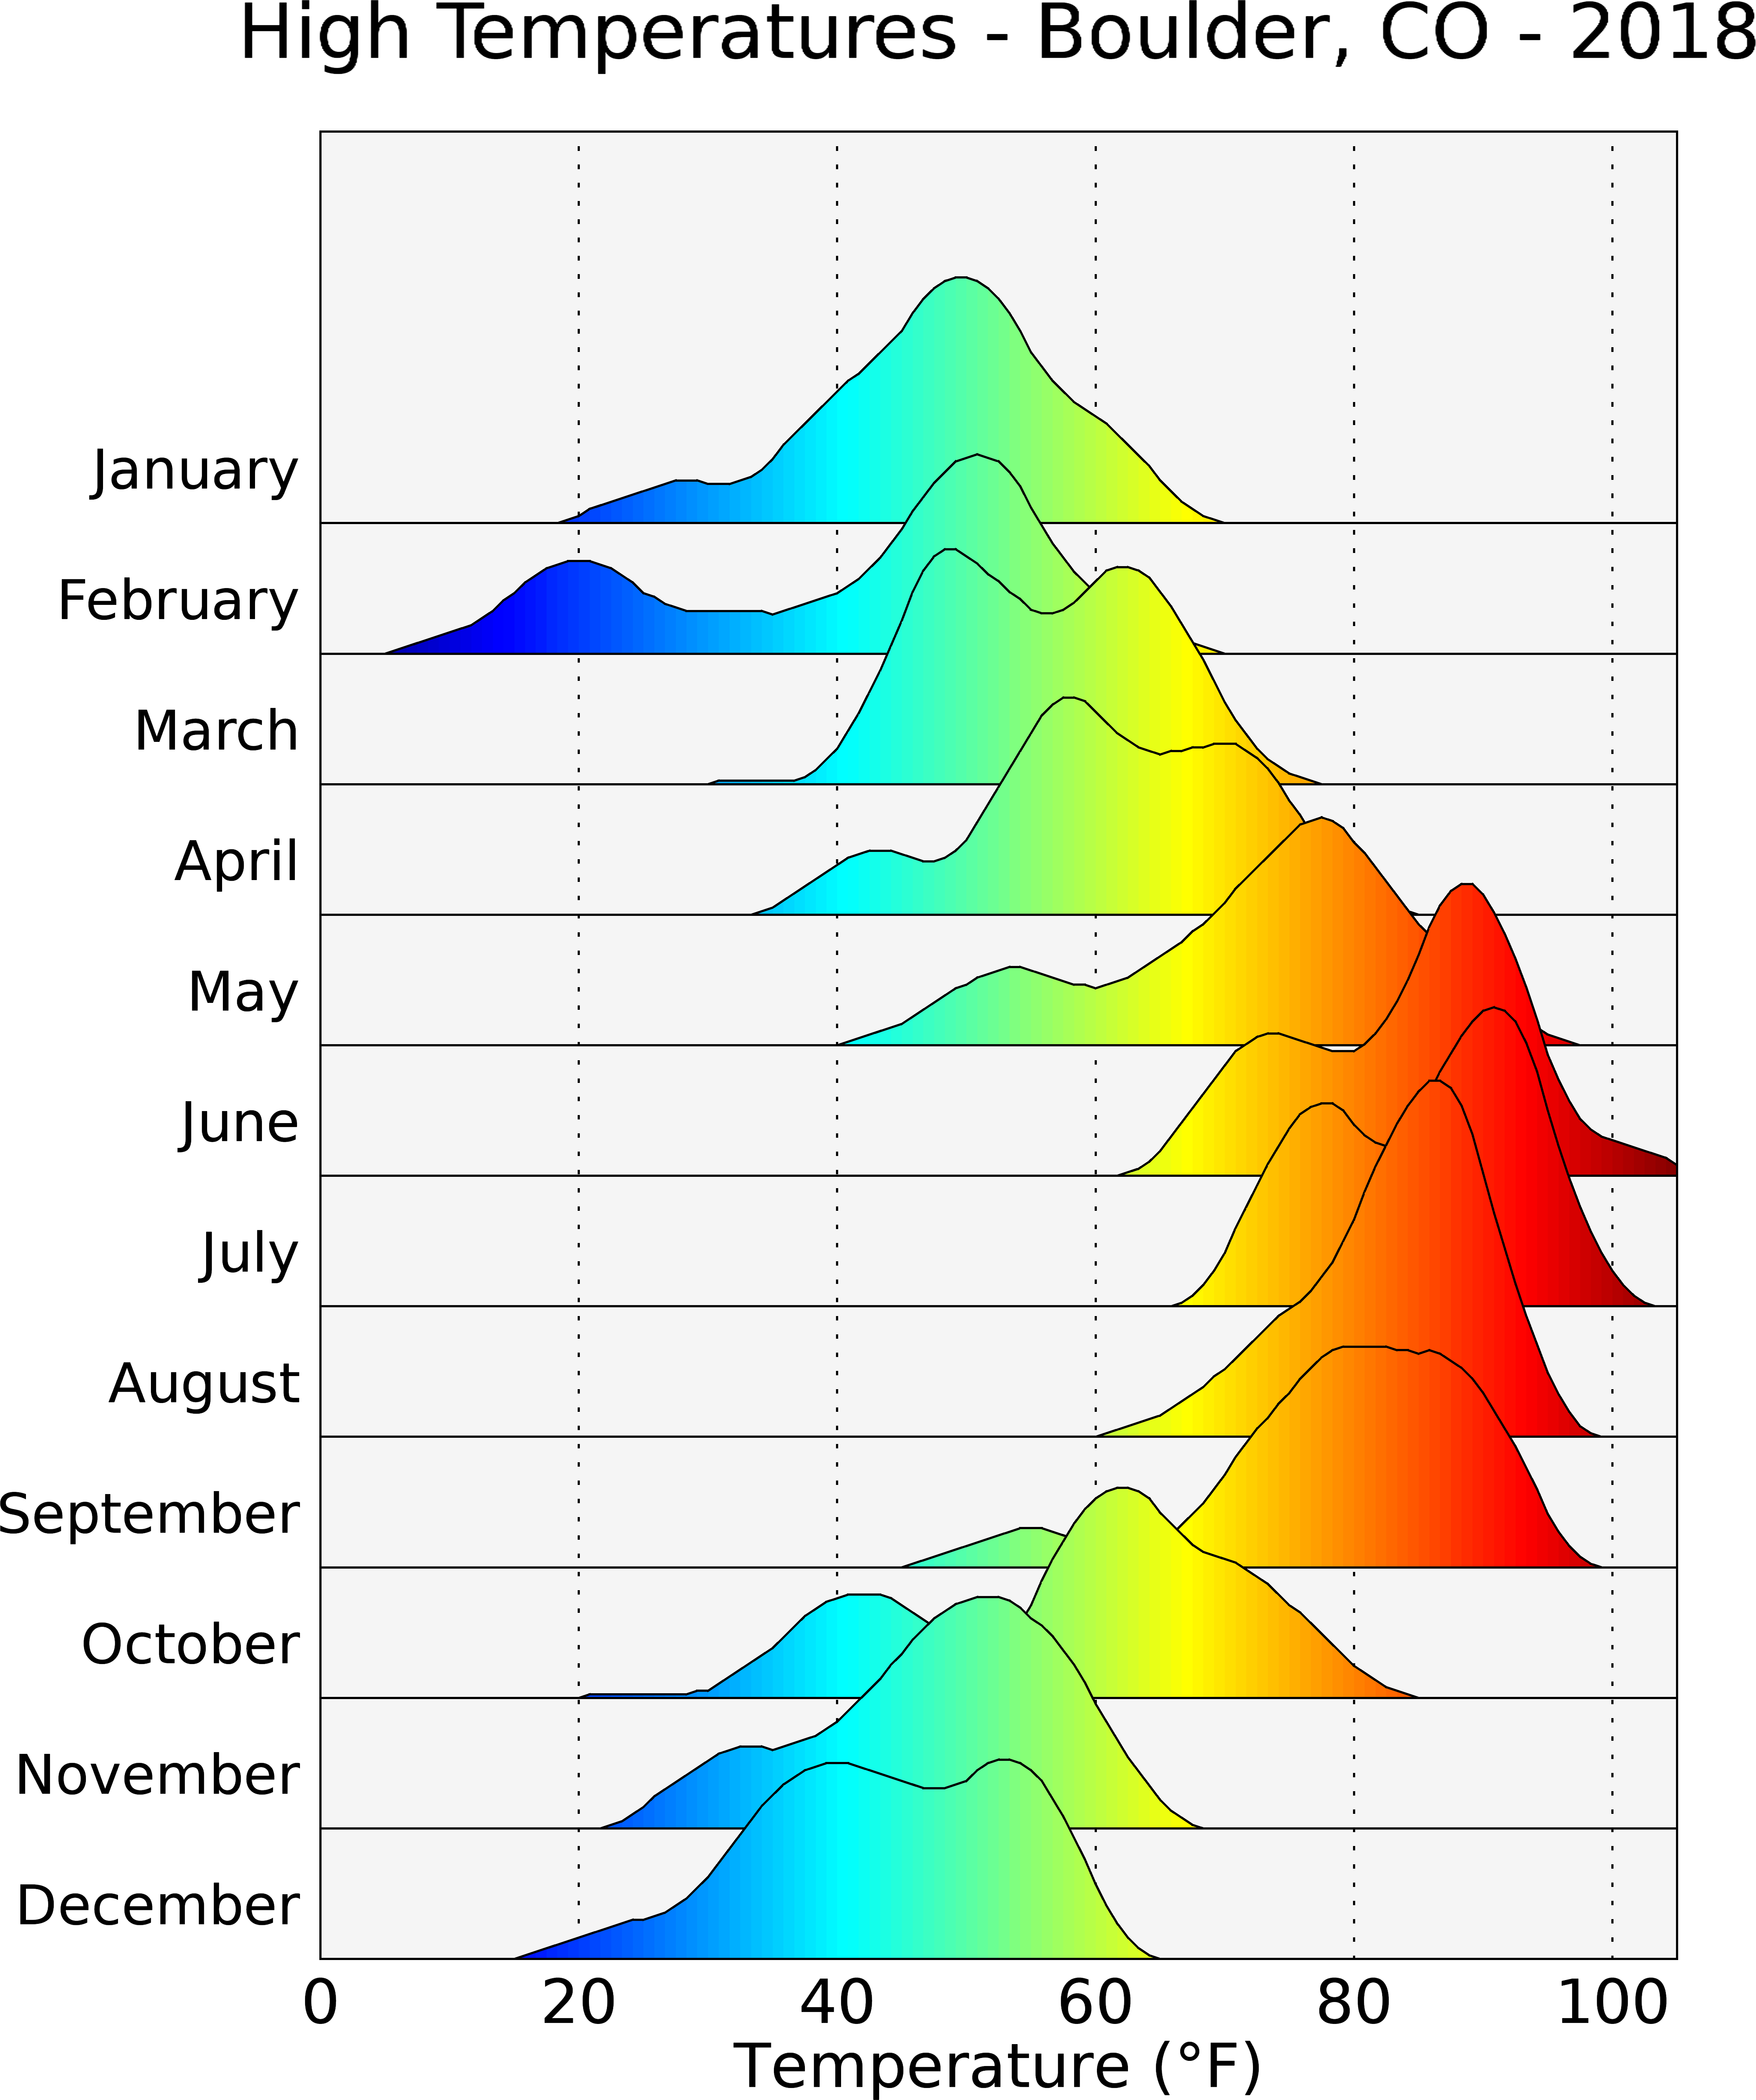
Quite a range of temperatures we saw in 2018! While low temperatures are relatively consistently distributed each month, high temperatures often exhibited a bi- or multi-modal distribution.
Rain & Snow by Day of Week – Boulder, CO – 2018
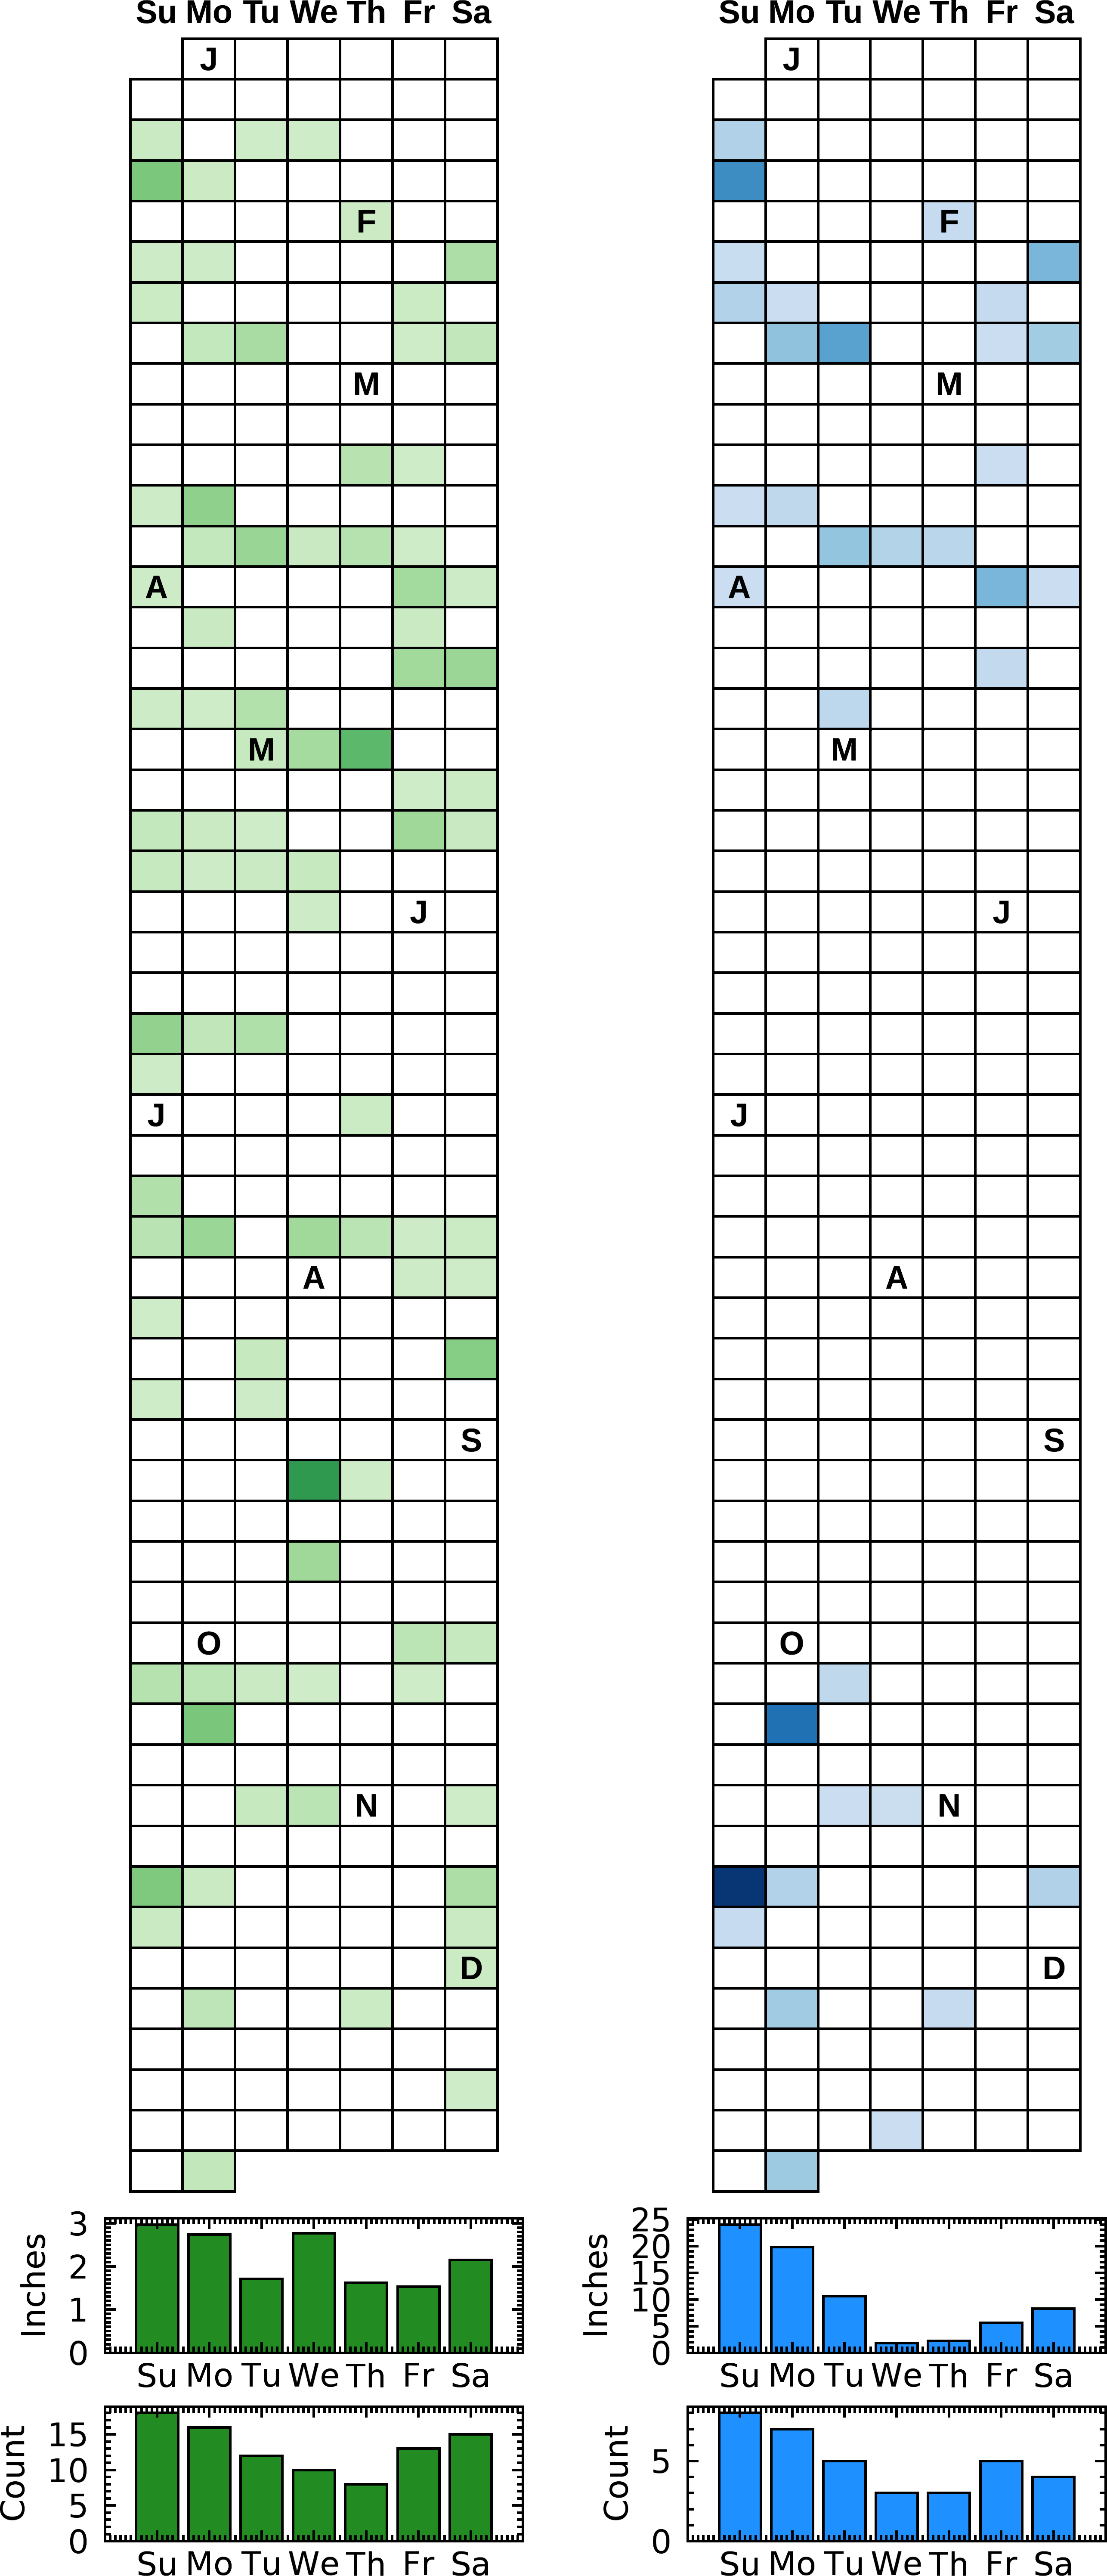
Sunday was the wettest and snowiest day of the week in 2018. Thursday was the driest.
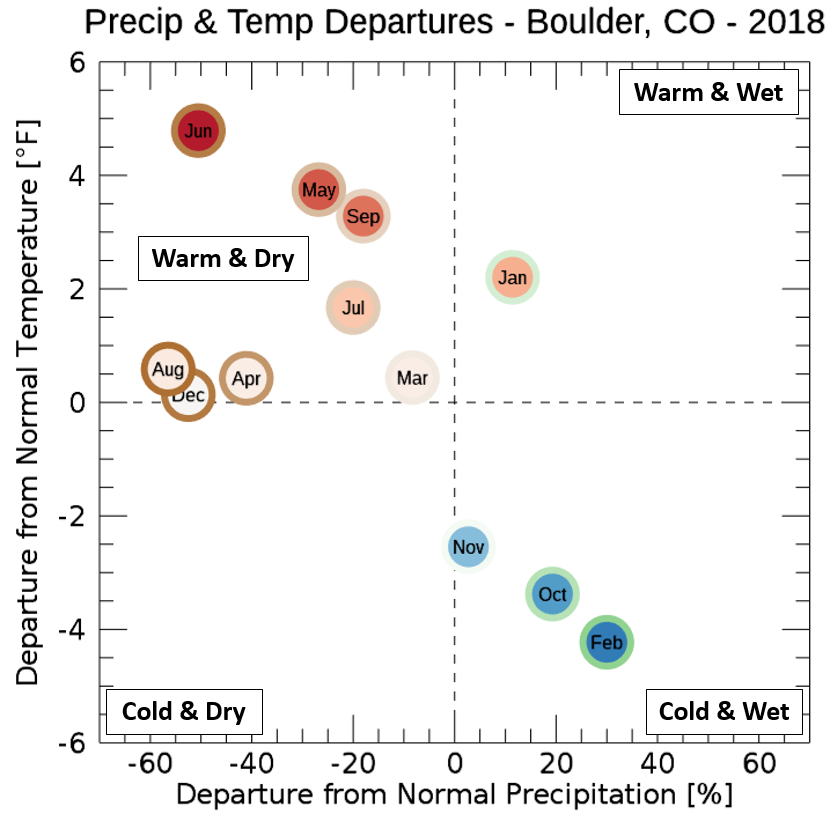
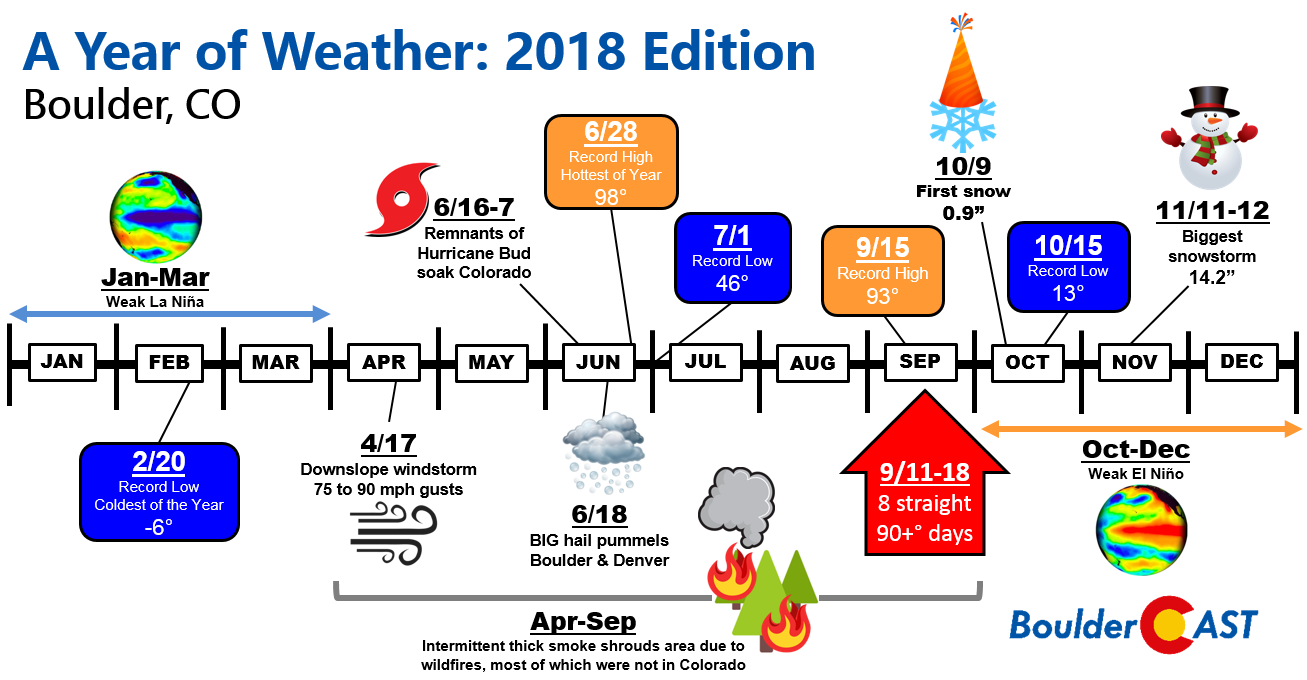
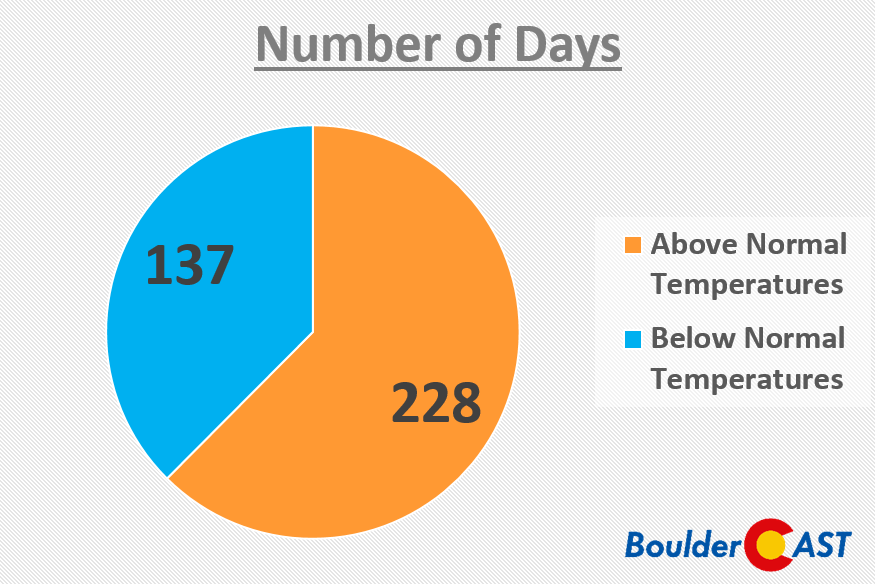
Two-thirds of the months in 2018 fell into the “warm & dry” quadrant, which explains why drought remains a topic of discussion for the Front Range.
Share these graphics:
.


You must be logged in to post a comment.