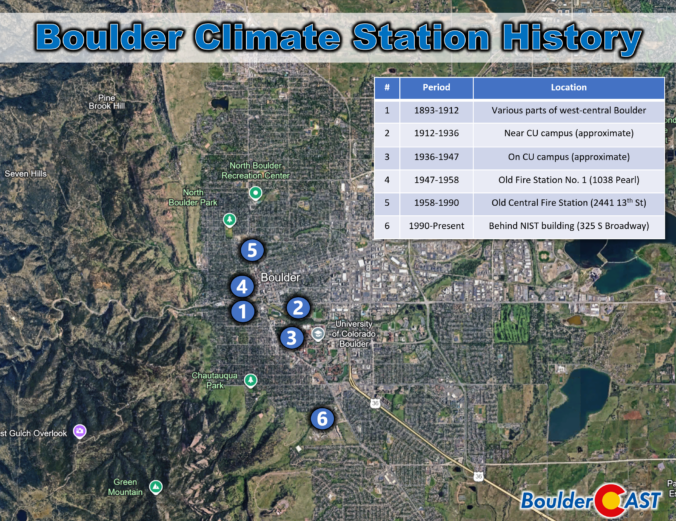
Boulder’s “official” climate record has never lived in one place for long. Over the past 130 years, the instruments that track our temperature, precipitation, and snowfall have been relocated again and again—sometimes only a few blocks, other times miles away into landscapes with completely different quirks and microclimates. Each move left its own imprint on the long‑term dataset we use today, subtly shaping how we compare modern conditions with the Boulder of decades past.
Early Observations (1890s–1910s): Downtown and Highly Variable
Boulder’s earliest official weather observations came from downtown—often at volunteer observers’ homes or small government offices. These sites were anything but standardized. Trees, nearby buildings, coal‑burning furnaces, and the general bustle of a developing town all influenced the readings.
- Nighttime temperatures tended to run warmer due to the urban area retaining heat.
- Snowfall and snow depth were often under‑measured because snow simply didn’t linger long on paved or compacted dirt surfaces.
- Exposure changed frequently as the city grew.
It was a great start at keeping tabs on Boulder’s weather, but far from the controlled environment we expect today.
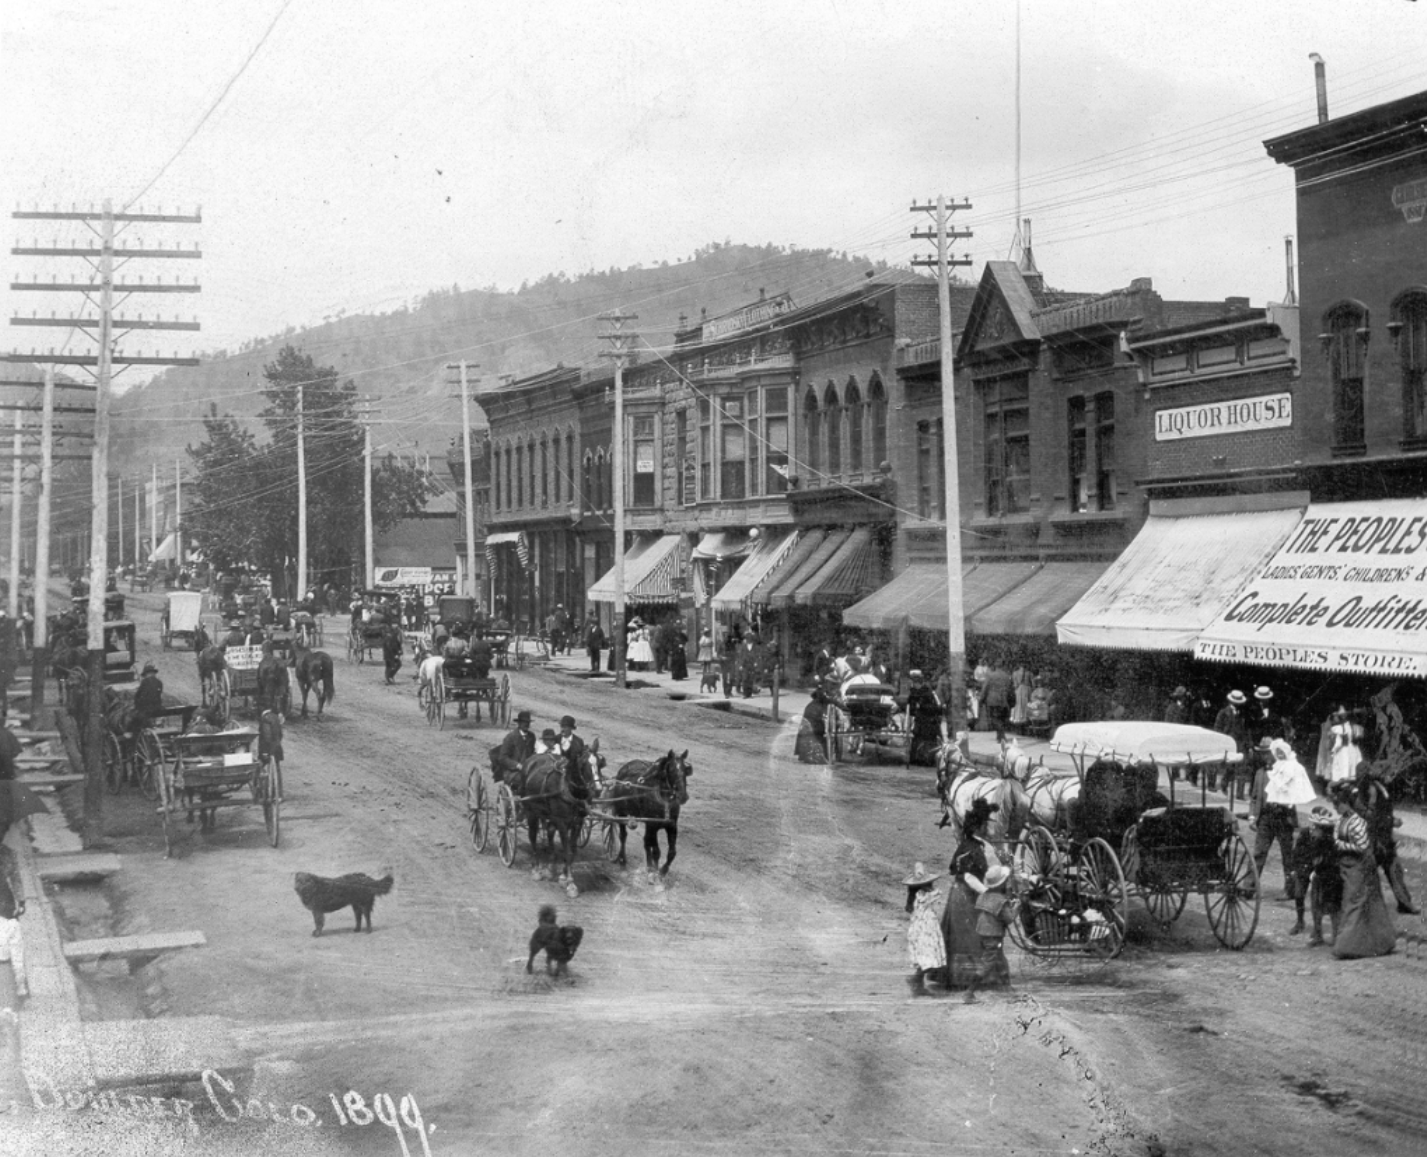
Downtown Boulder, 1899
The University Era (1910s–Late 1940s)
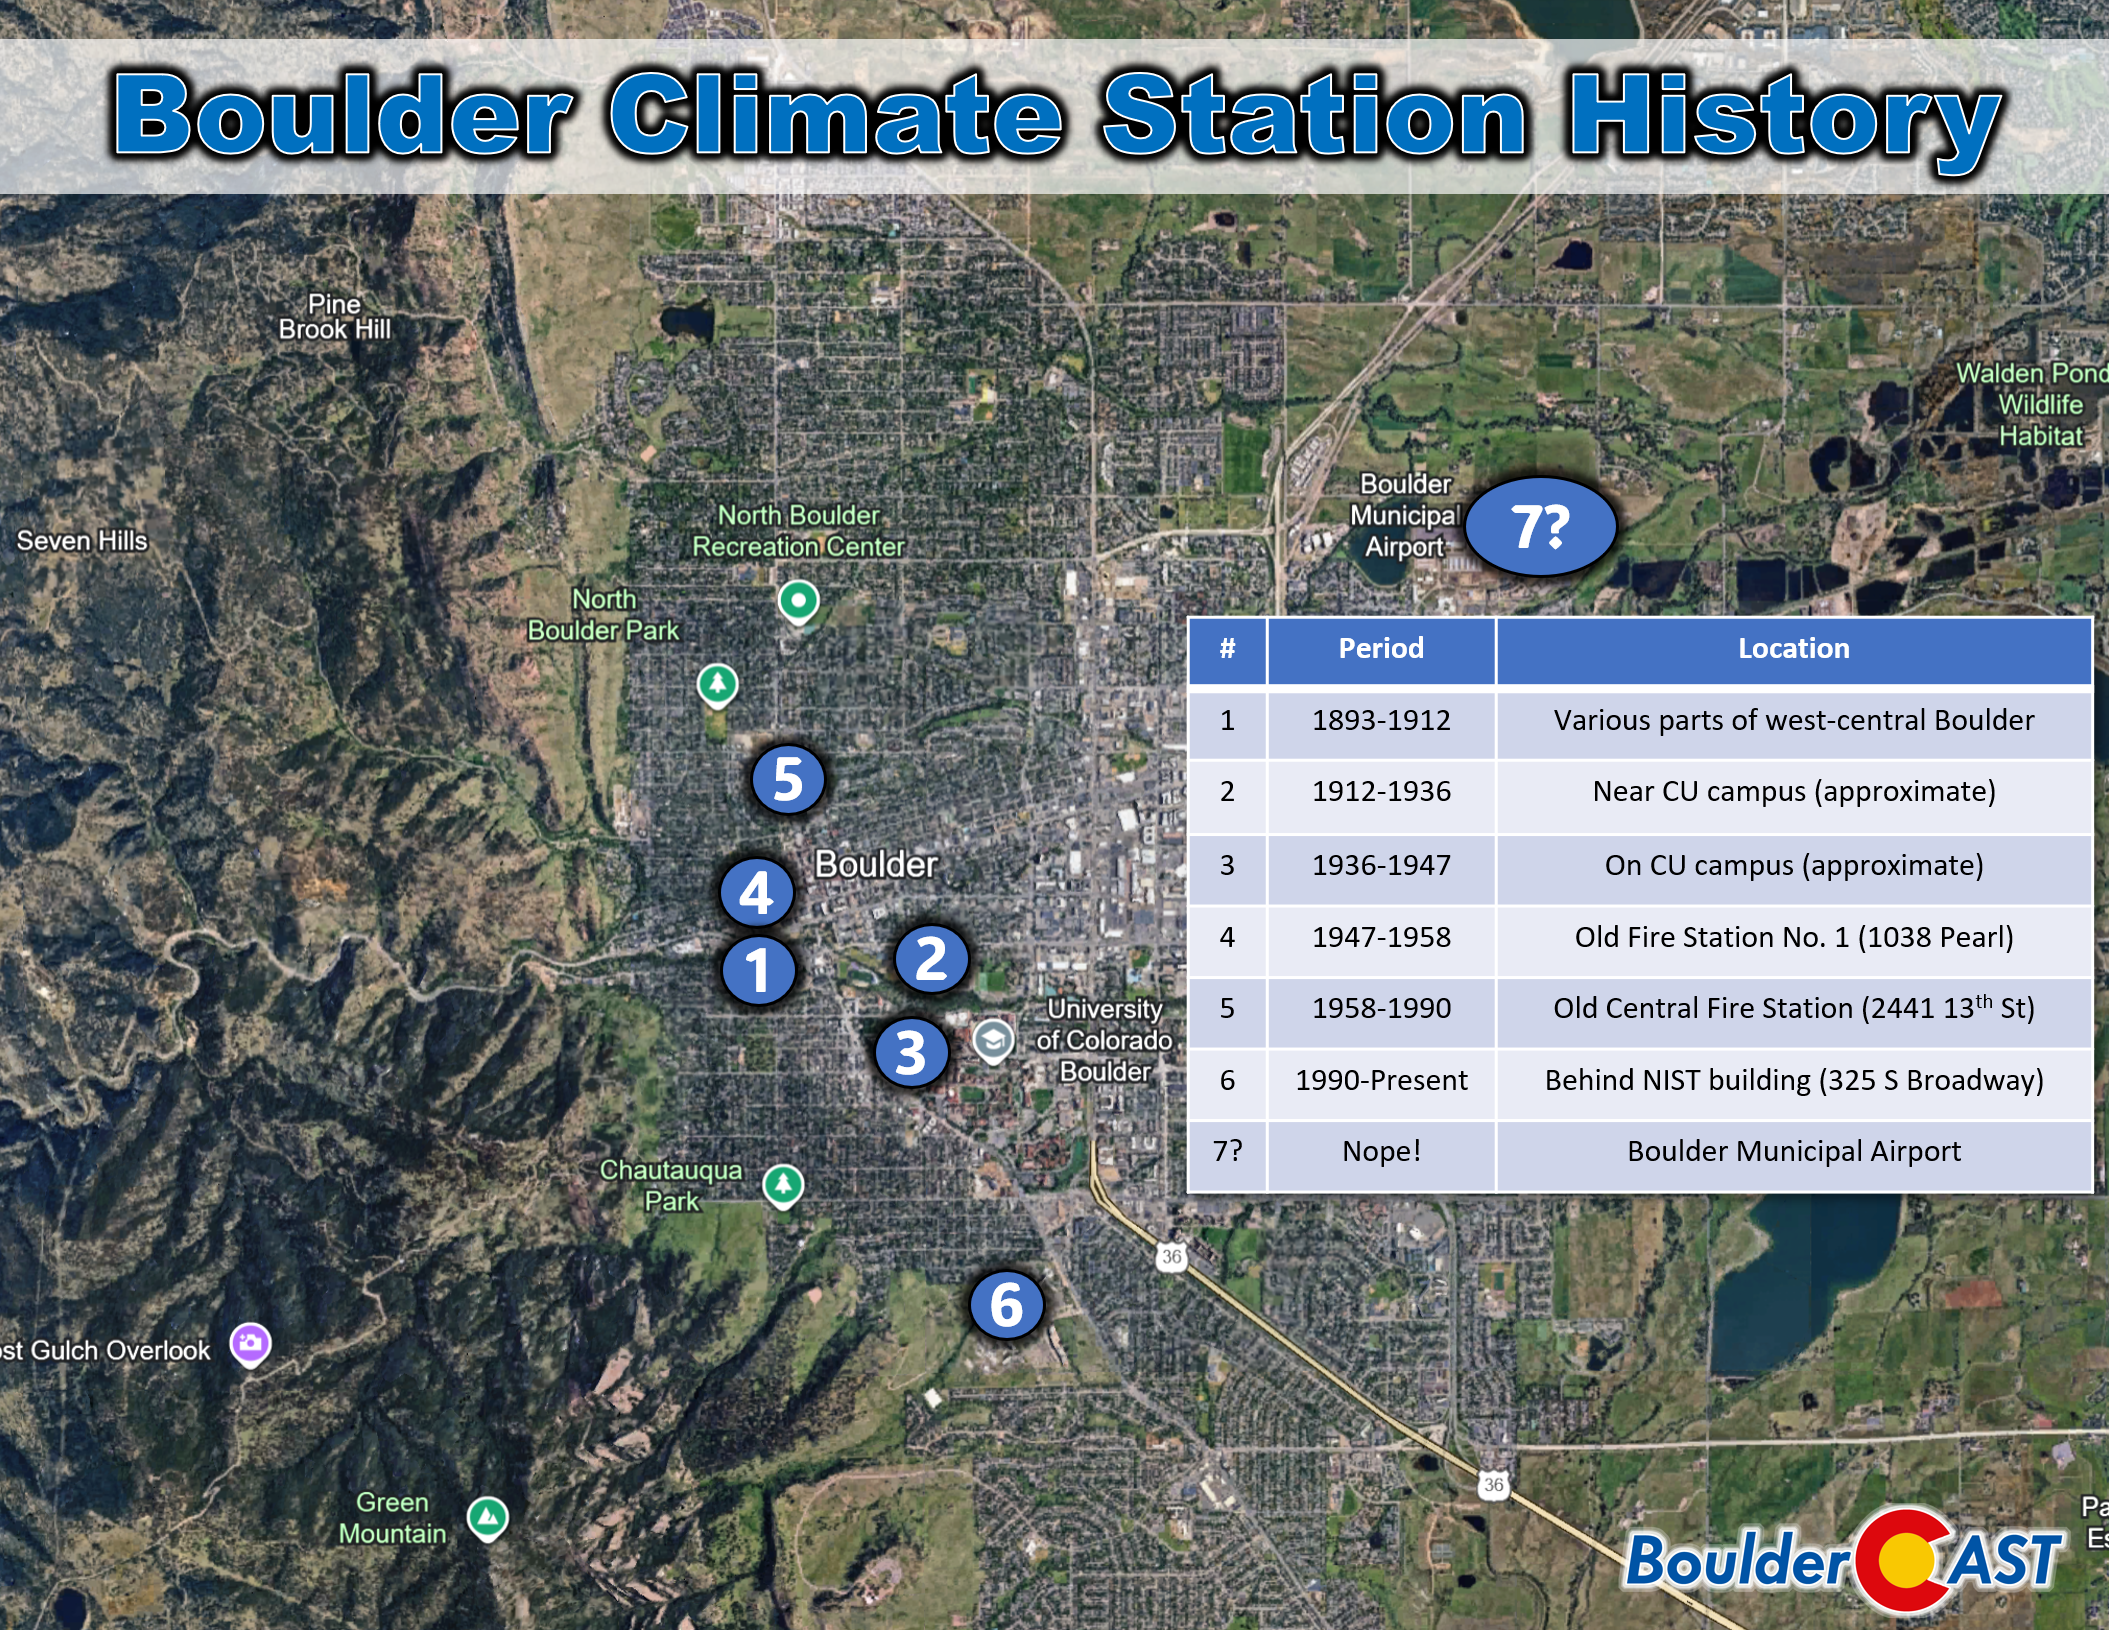
As Boulder expanded, the station migrated toward the University of Colorado. From 1912 to 1936 it sat near campus, and from 1936 to 1947 it moved onto CU property.
The move helped in some aspects:
- CU’s open lawns and slightly higher elevation improved airflow and reduced some urban heat effects.
- The site was more stable and slightly less obstructed than downtown.
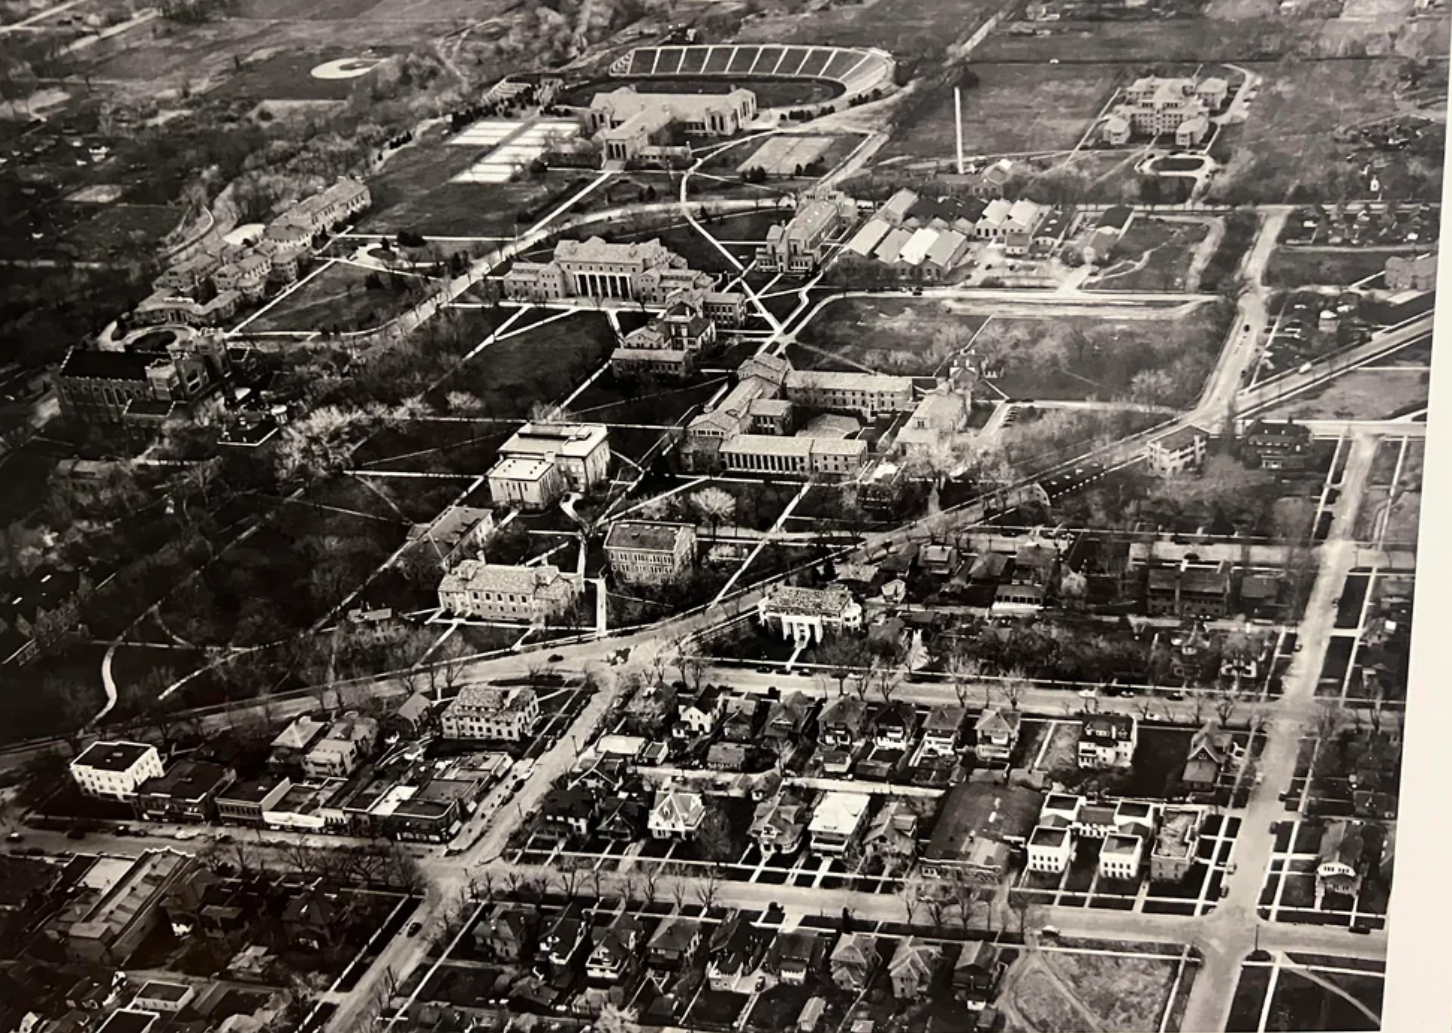
Aerial view of CU/The Hill from the 1940s
But new biases emerged:
- Irrigation around campus increased local humidity (which can impact temperatures)
- Heat‑retaining academic buildings still influenced temperatures, especially at night.
Overall, during this period the data improved, but it still wasn’t perfect.
The Fire Department Era (Late 1940s-Late 1980s): A Tale of Two Stations
From 1947 to 1989, Boulder’s weather observations were handled by the Boulder Fire Department—first downtown, then in north Boulder. This era spans more than four decades and includes some of the most distinct microclimate quirks in the entire record.
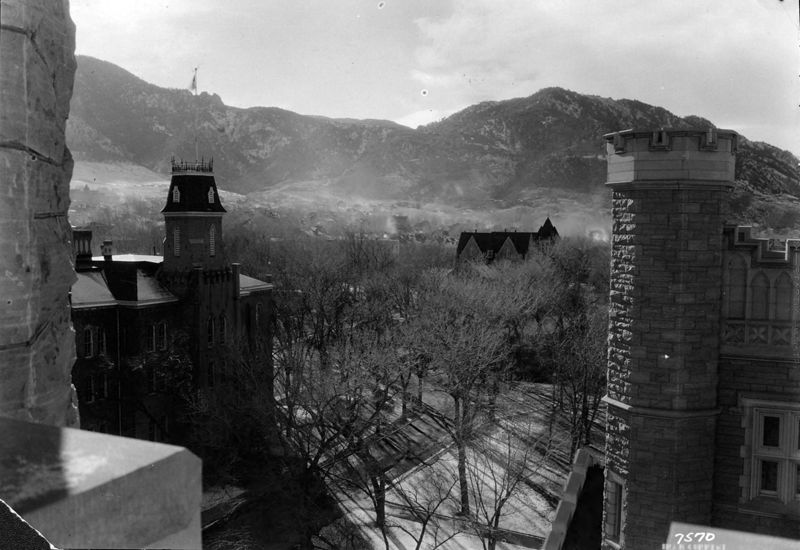
1947–1958: The Old Central Fire Station (1038 Pearl Street, west Boulder)
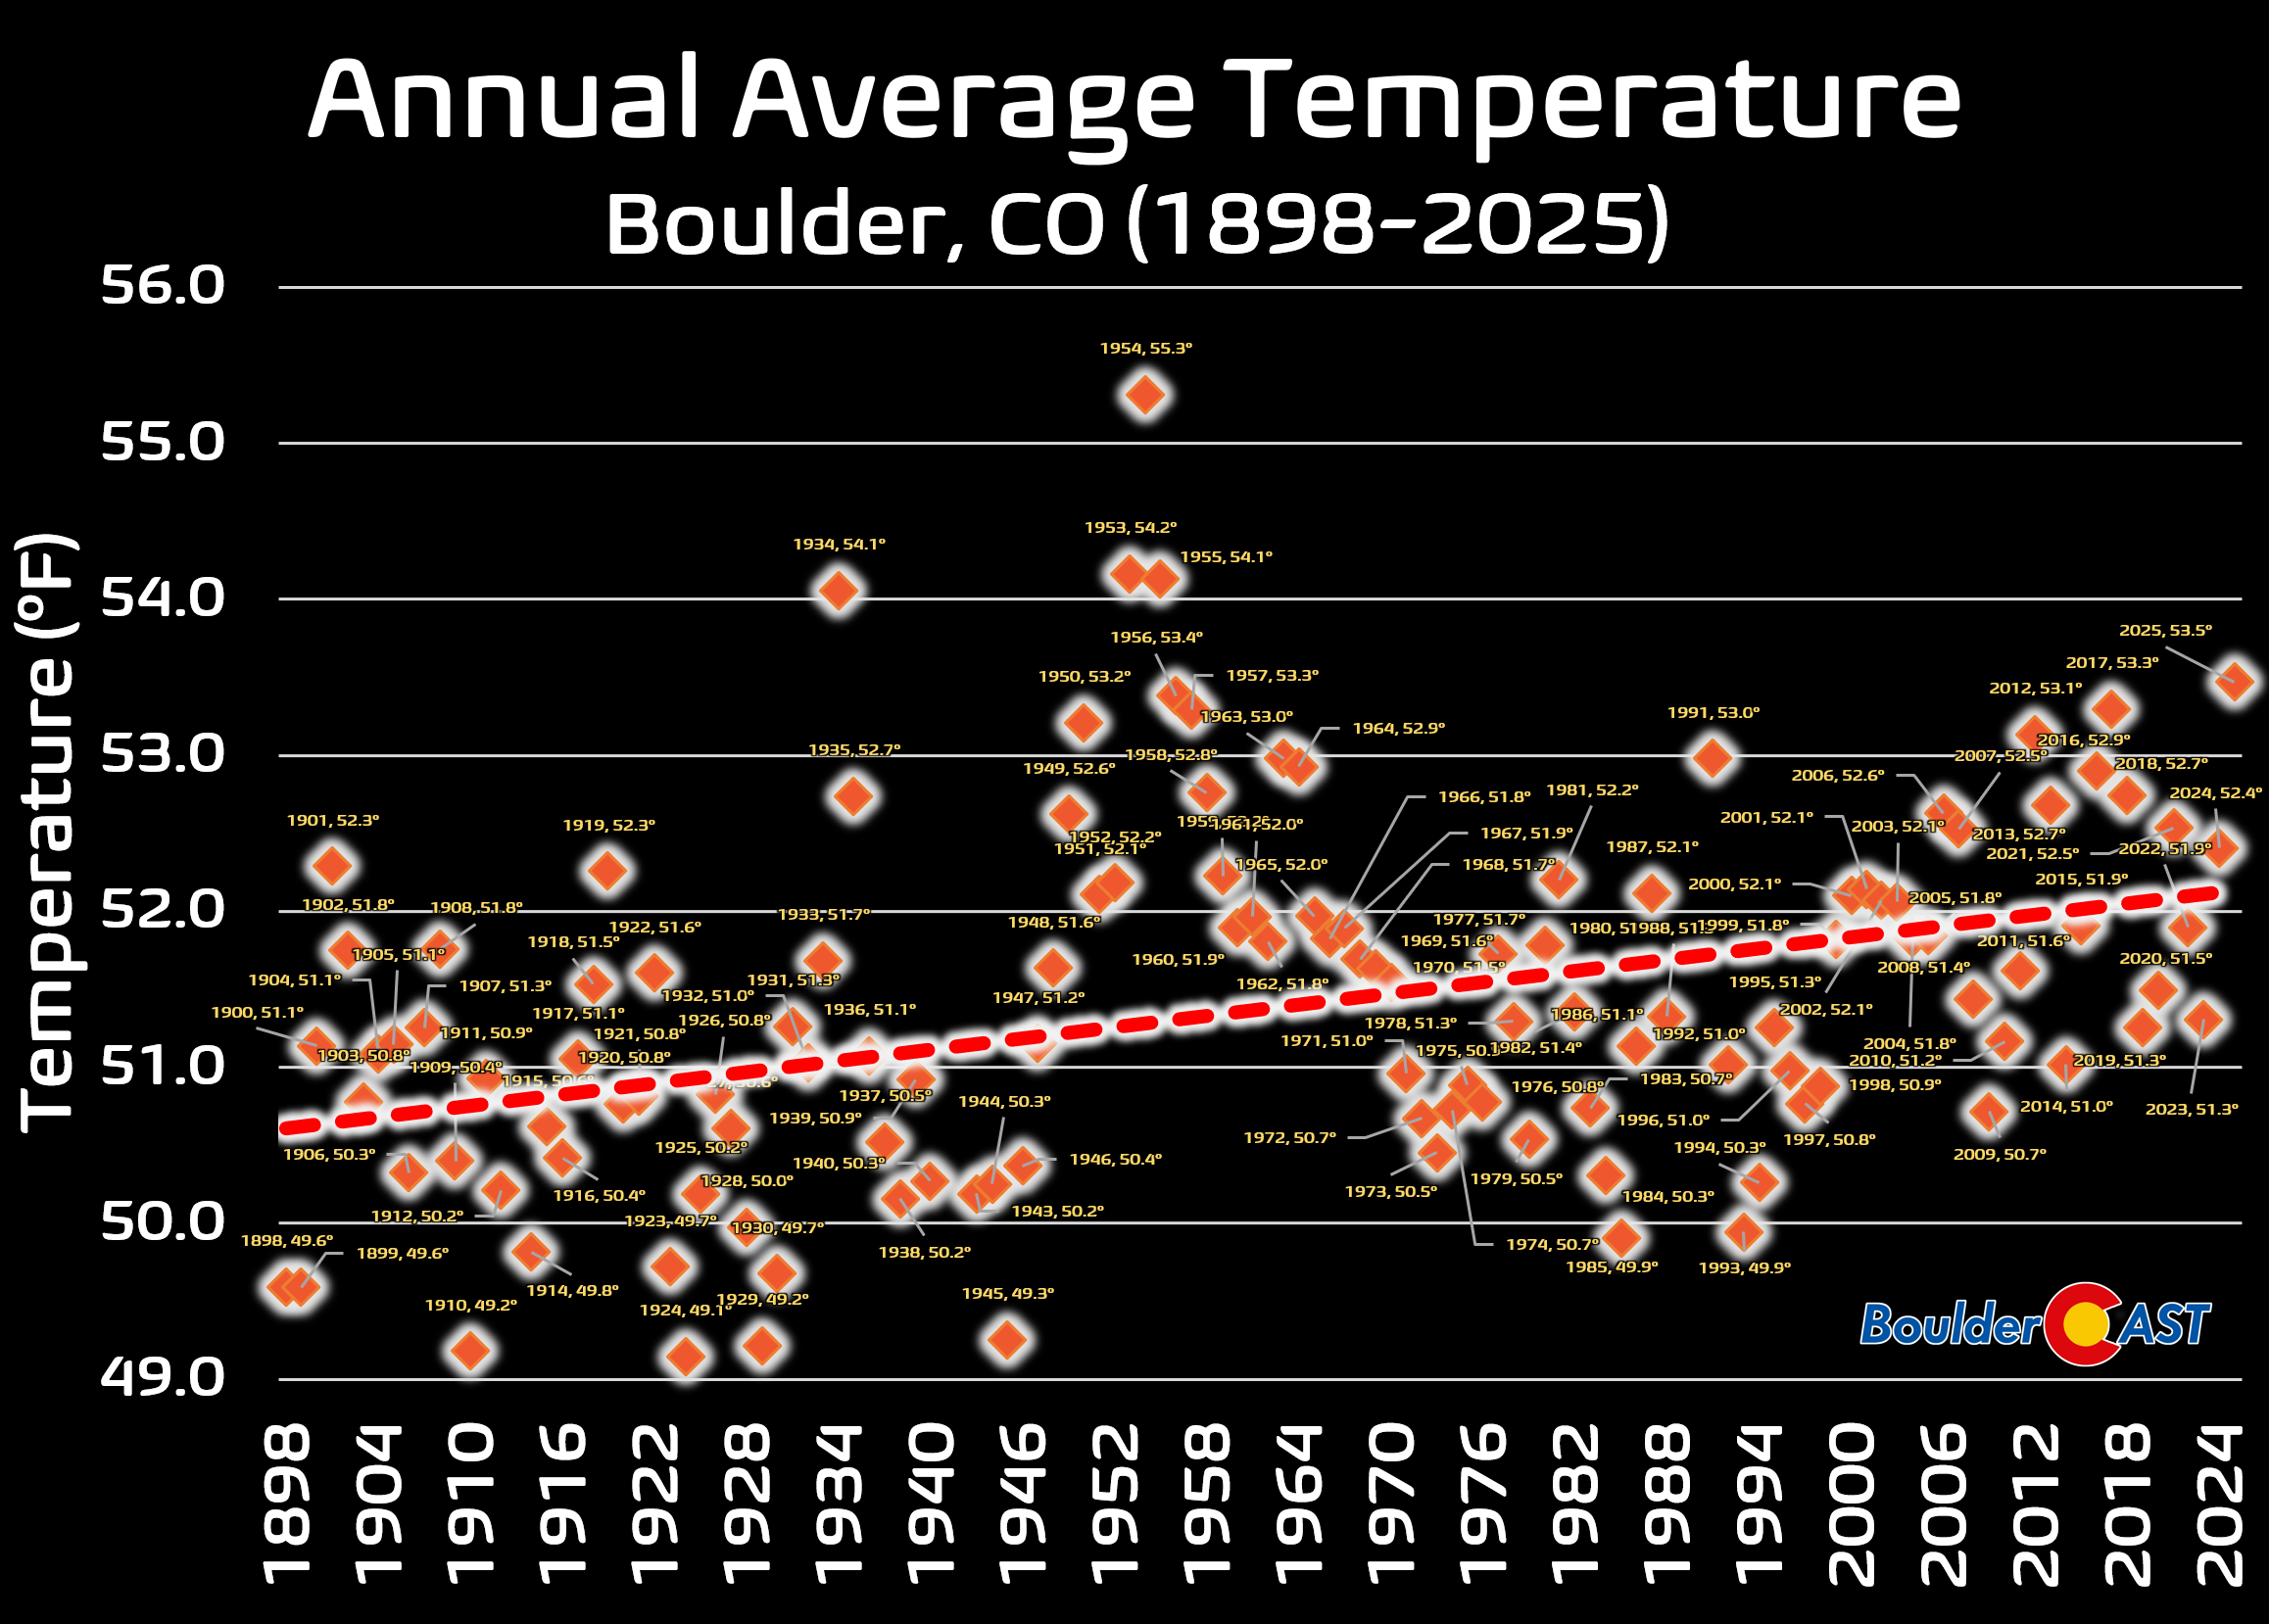
Observations were taken on the sloped roof of the two‑story fire station at the western edge of downtown. This site is infamous for its warm bias:
- The roof surface amplified daytime heating.
- Nighttime cooling was limited by the building’s structure and surrounding development.
- A disproportionally high amount of Boulder’s long‑standing warmth records still trace back to this 11‑year observational period.
It’s the clearest example of how a poor observation site can skew a climate record.
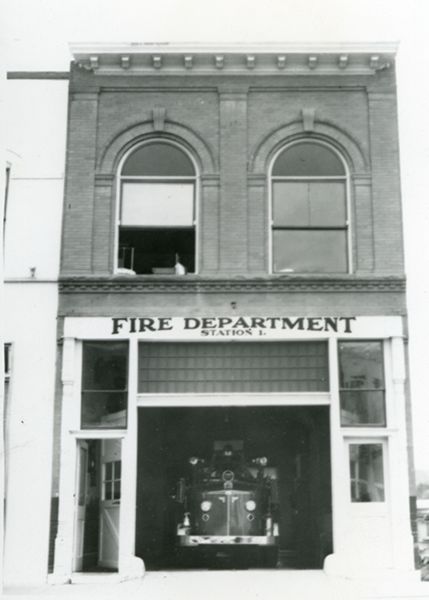
Fire Station #1, 1950s
1958–1989: The New Central Fire Station (2441 13th St, North Boulder)
In 1958, the station moved to the grounds of the new fire station along 13th Street in north Boulder. This location offered more open space and better exposure, but Boulder’s post‑war boom meant the environment around the station changed rapidly—new buildings, new roads, and expanding neighborhoods all subtly influenced the data over time.
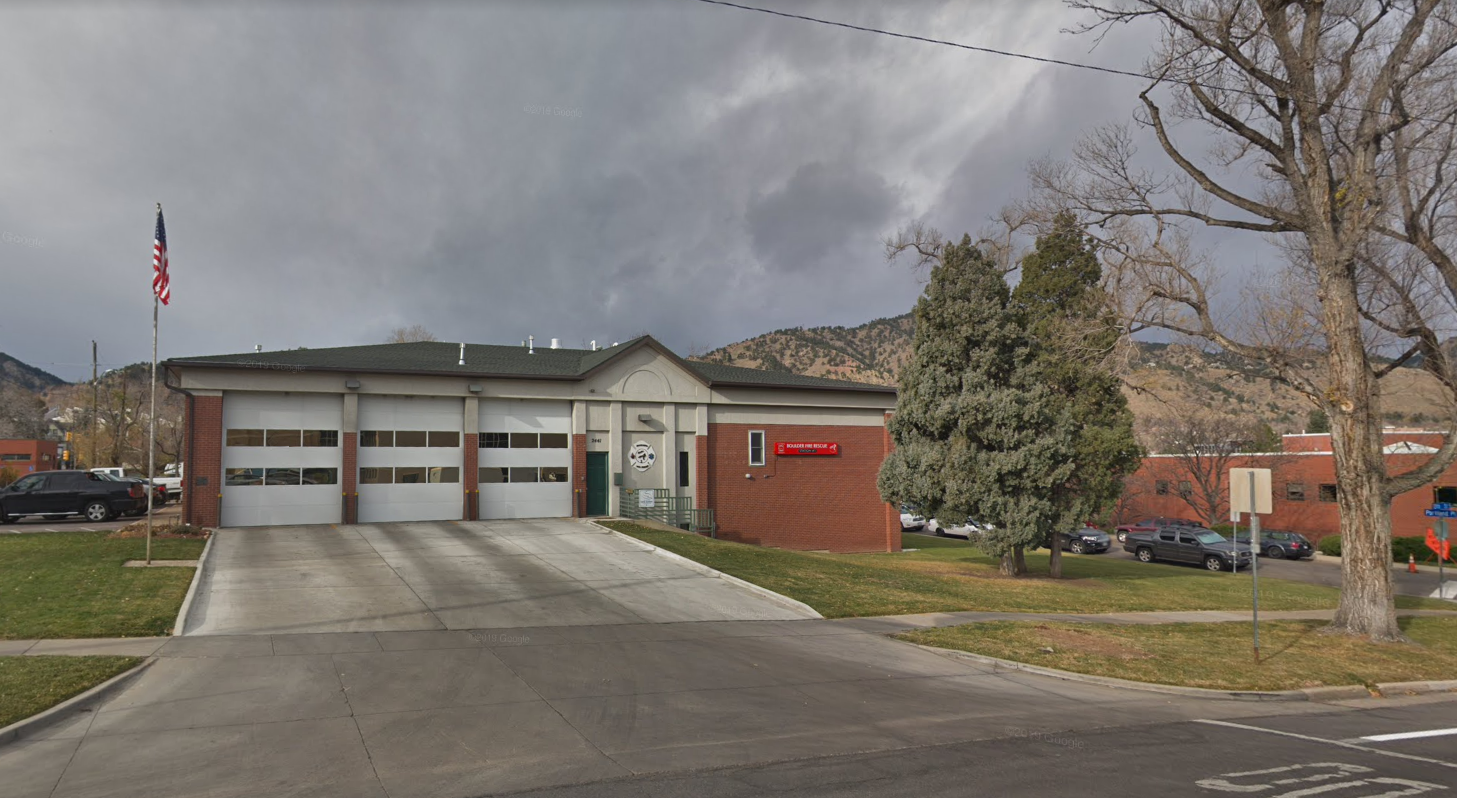
Central Fire Station, North Boulder, ~2020
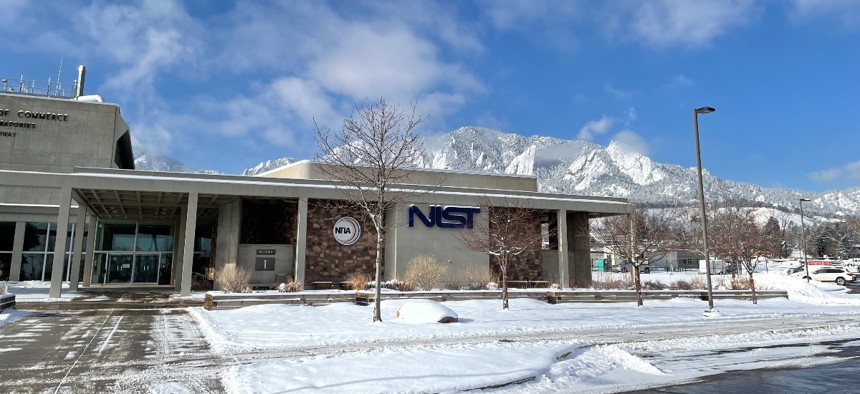
The NIST Site (1990–Today): Stability at Last!
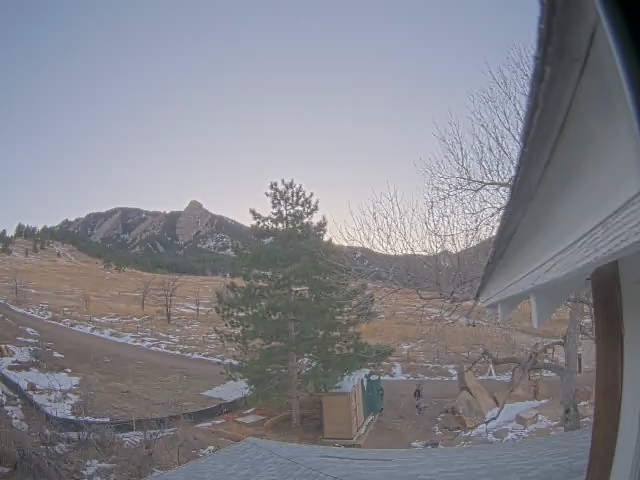
The 1990 move to the NIST campus wasn’t just another relocation—it was Boulder’s climate record finally finding a home built for the long haul. Tucked against the base of the Flatirons and surrounded by stable research facilities, the site offered something Boulder had never really had before: consistency, protection, and a setting that truly reflects our unique weather.
Key characteristics of the NIST site:
- Slightly higher elevation and distance from the urban core often leads to cooler nights.
- Stronger downslope wind exposure due to its position at the base of the Flatirons.
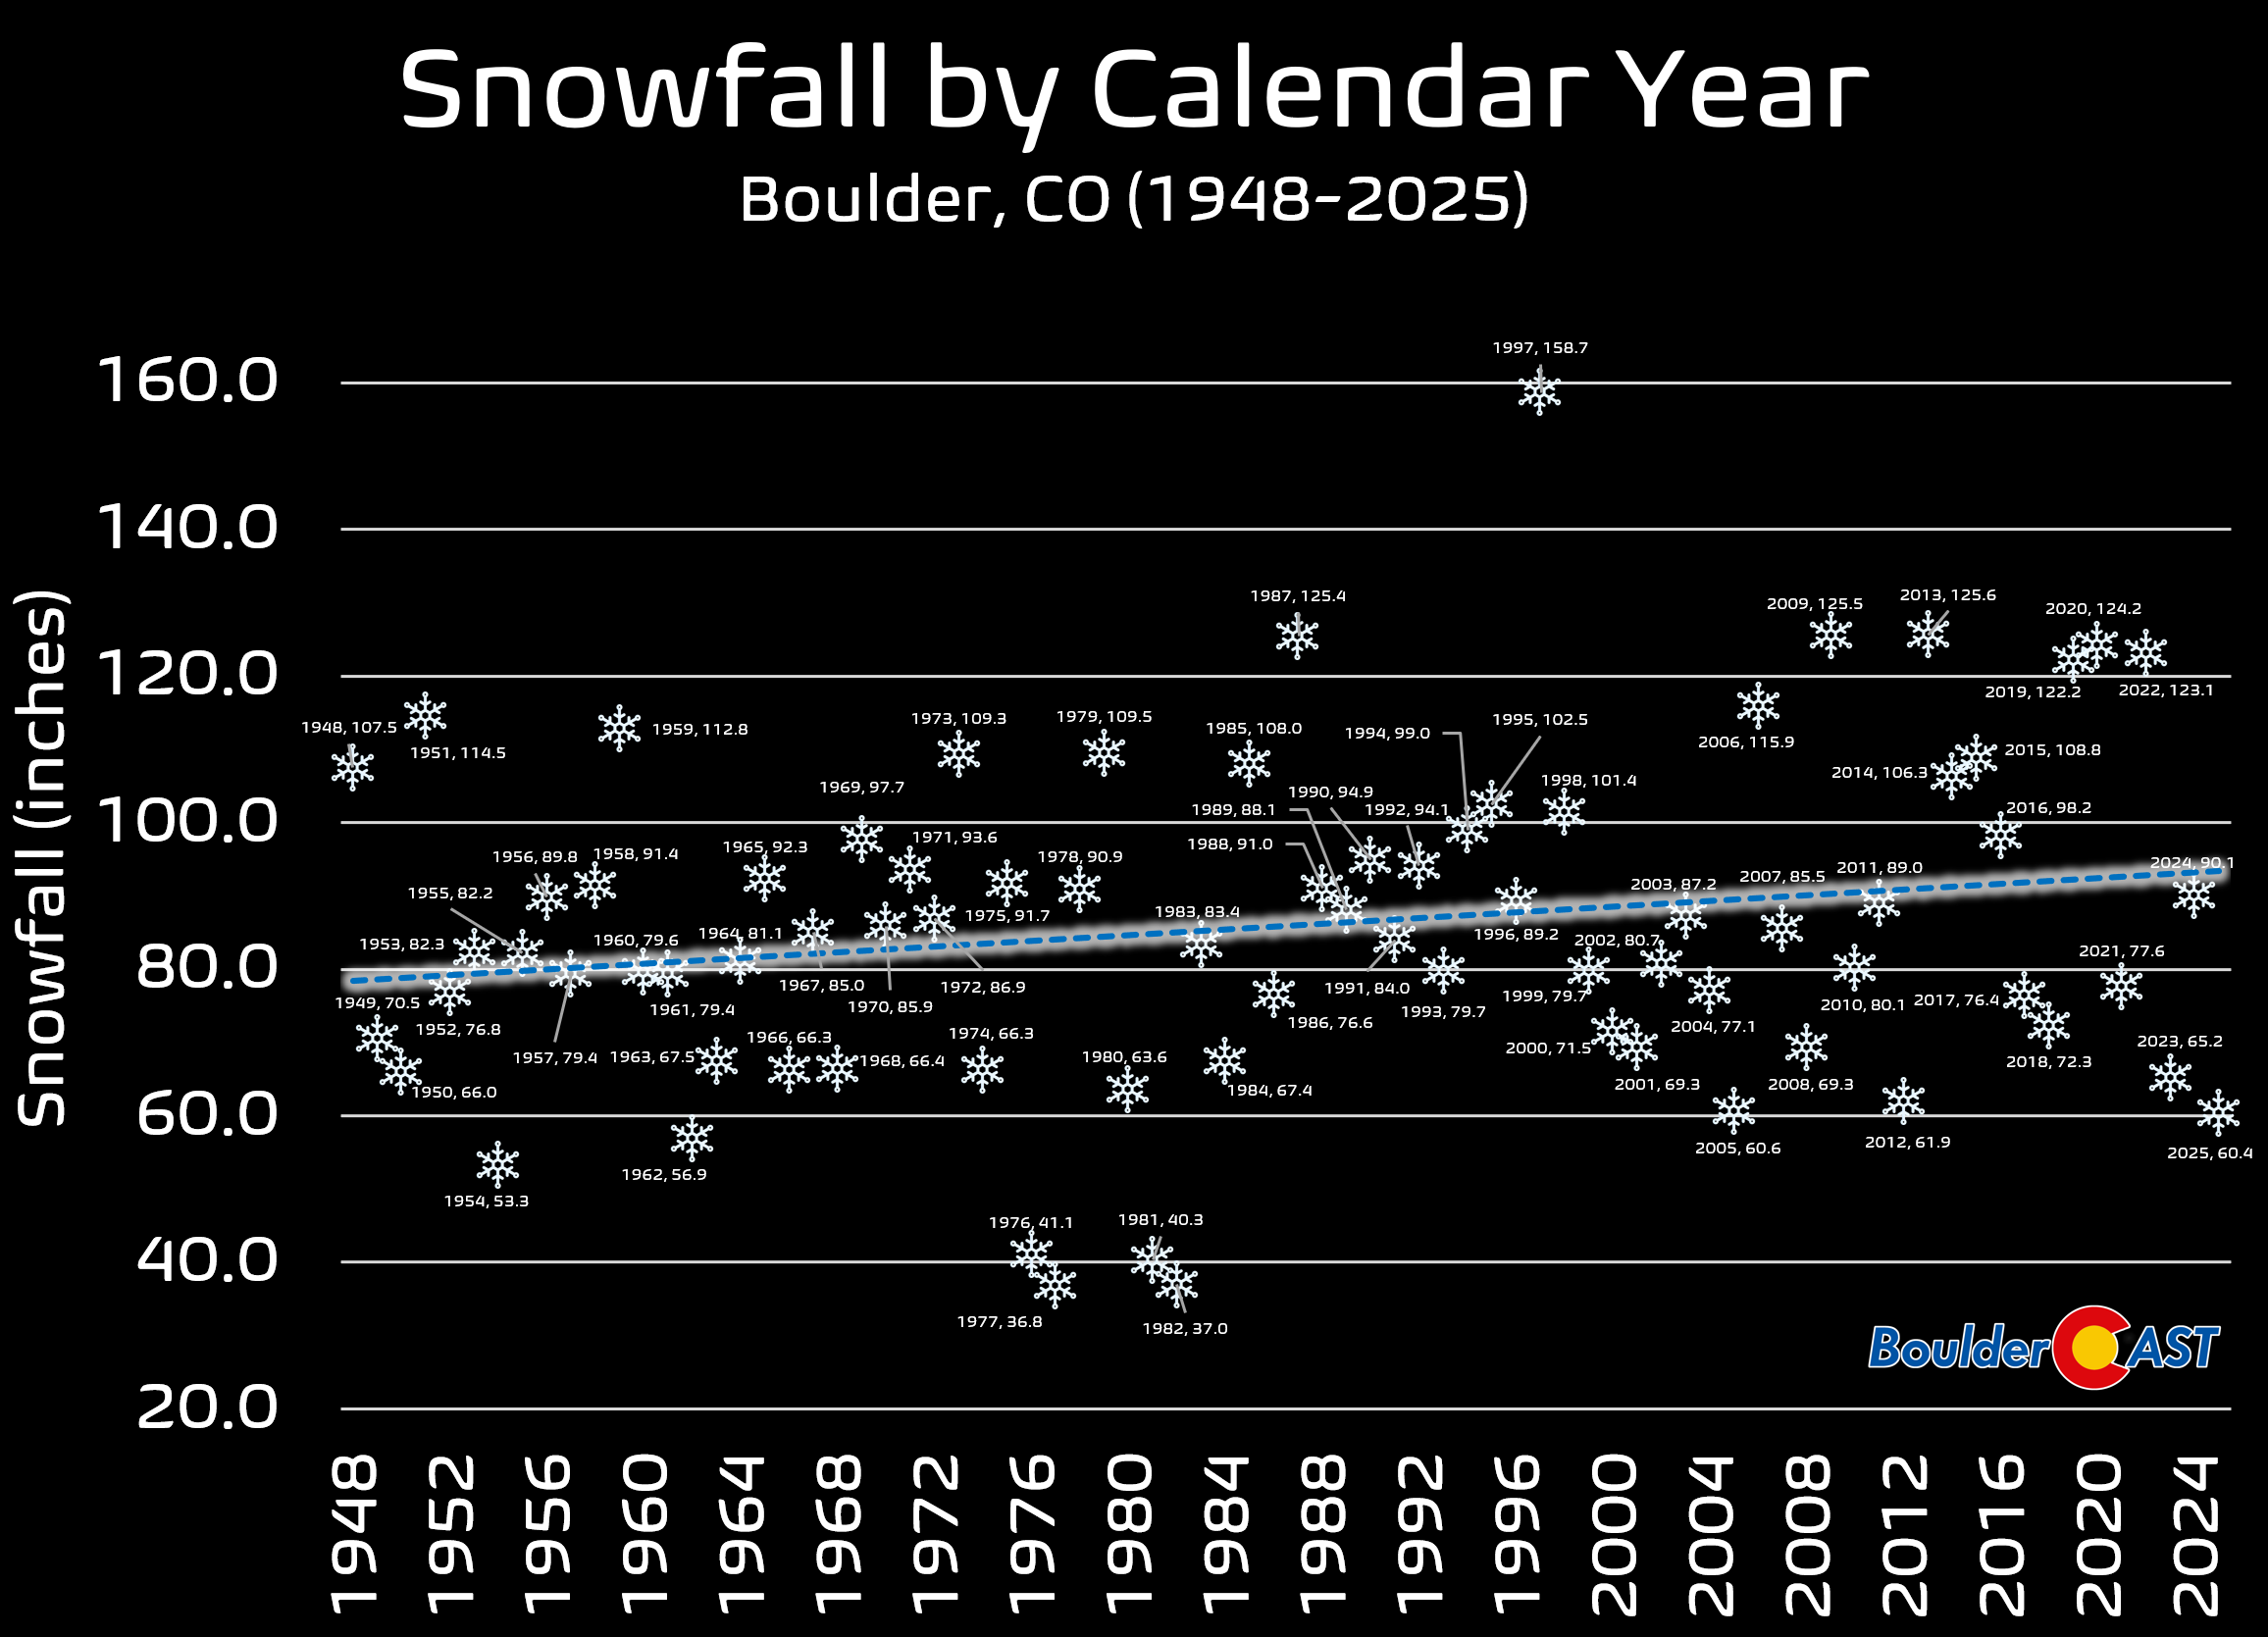
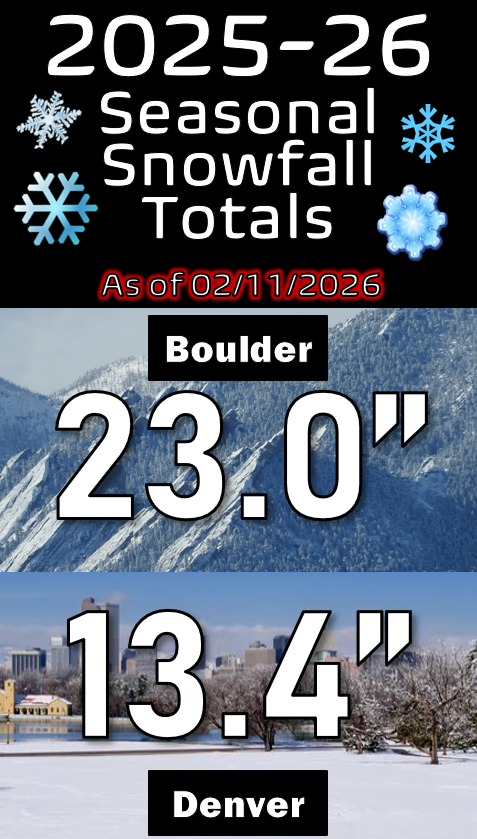
- Snowfall runs higher here than at downtown or campus‑era sites, thanks to more efficient upslope enhancement along the Foothills.
- The surroundings are remarkably stable: protected Open Space to the west, and long‑established federal research campuses—NIST, NTIA, NOAA—on all sides, ensuring minimal environmental drift over time.
- And perhaps most impressively, the record has been kept alive with extraordinary dedication by volunteers Matt Kelsch and John Brown, who have maintained Boulder’s climate observations with near‑unbroken continuity for more than three decades.
Together, the NIST observations and the people behind them have shaped the most consistent and trustworthy chapter of Boulder’s climate history—one that anchors what we compare against today.
What Data Make Up Boulder’s Climate Record?
The official dataset includes:
- Snow depth: Measured on a standardized snow board.
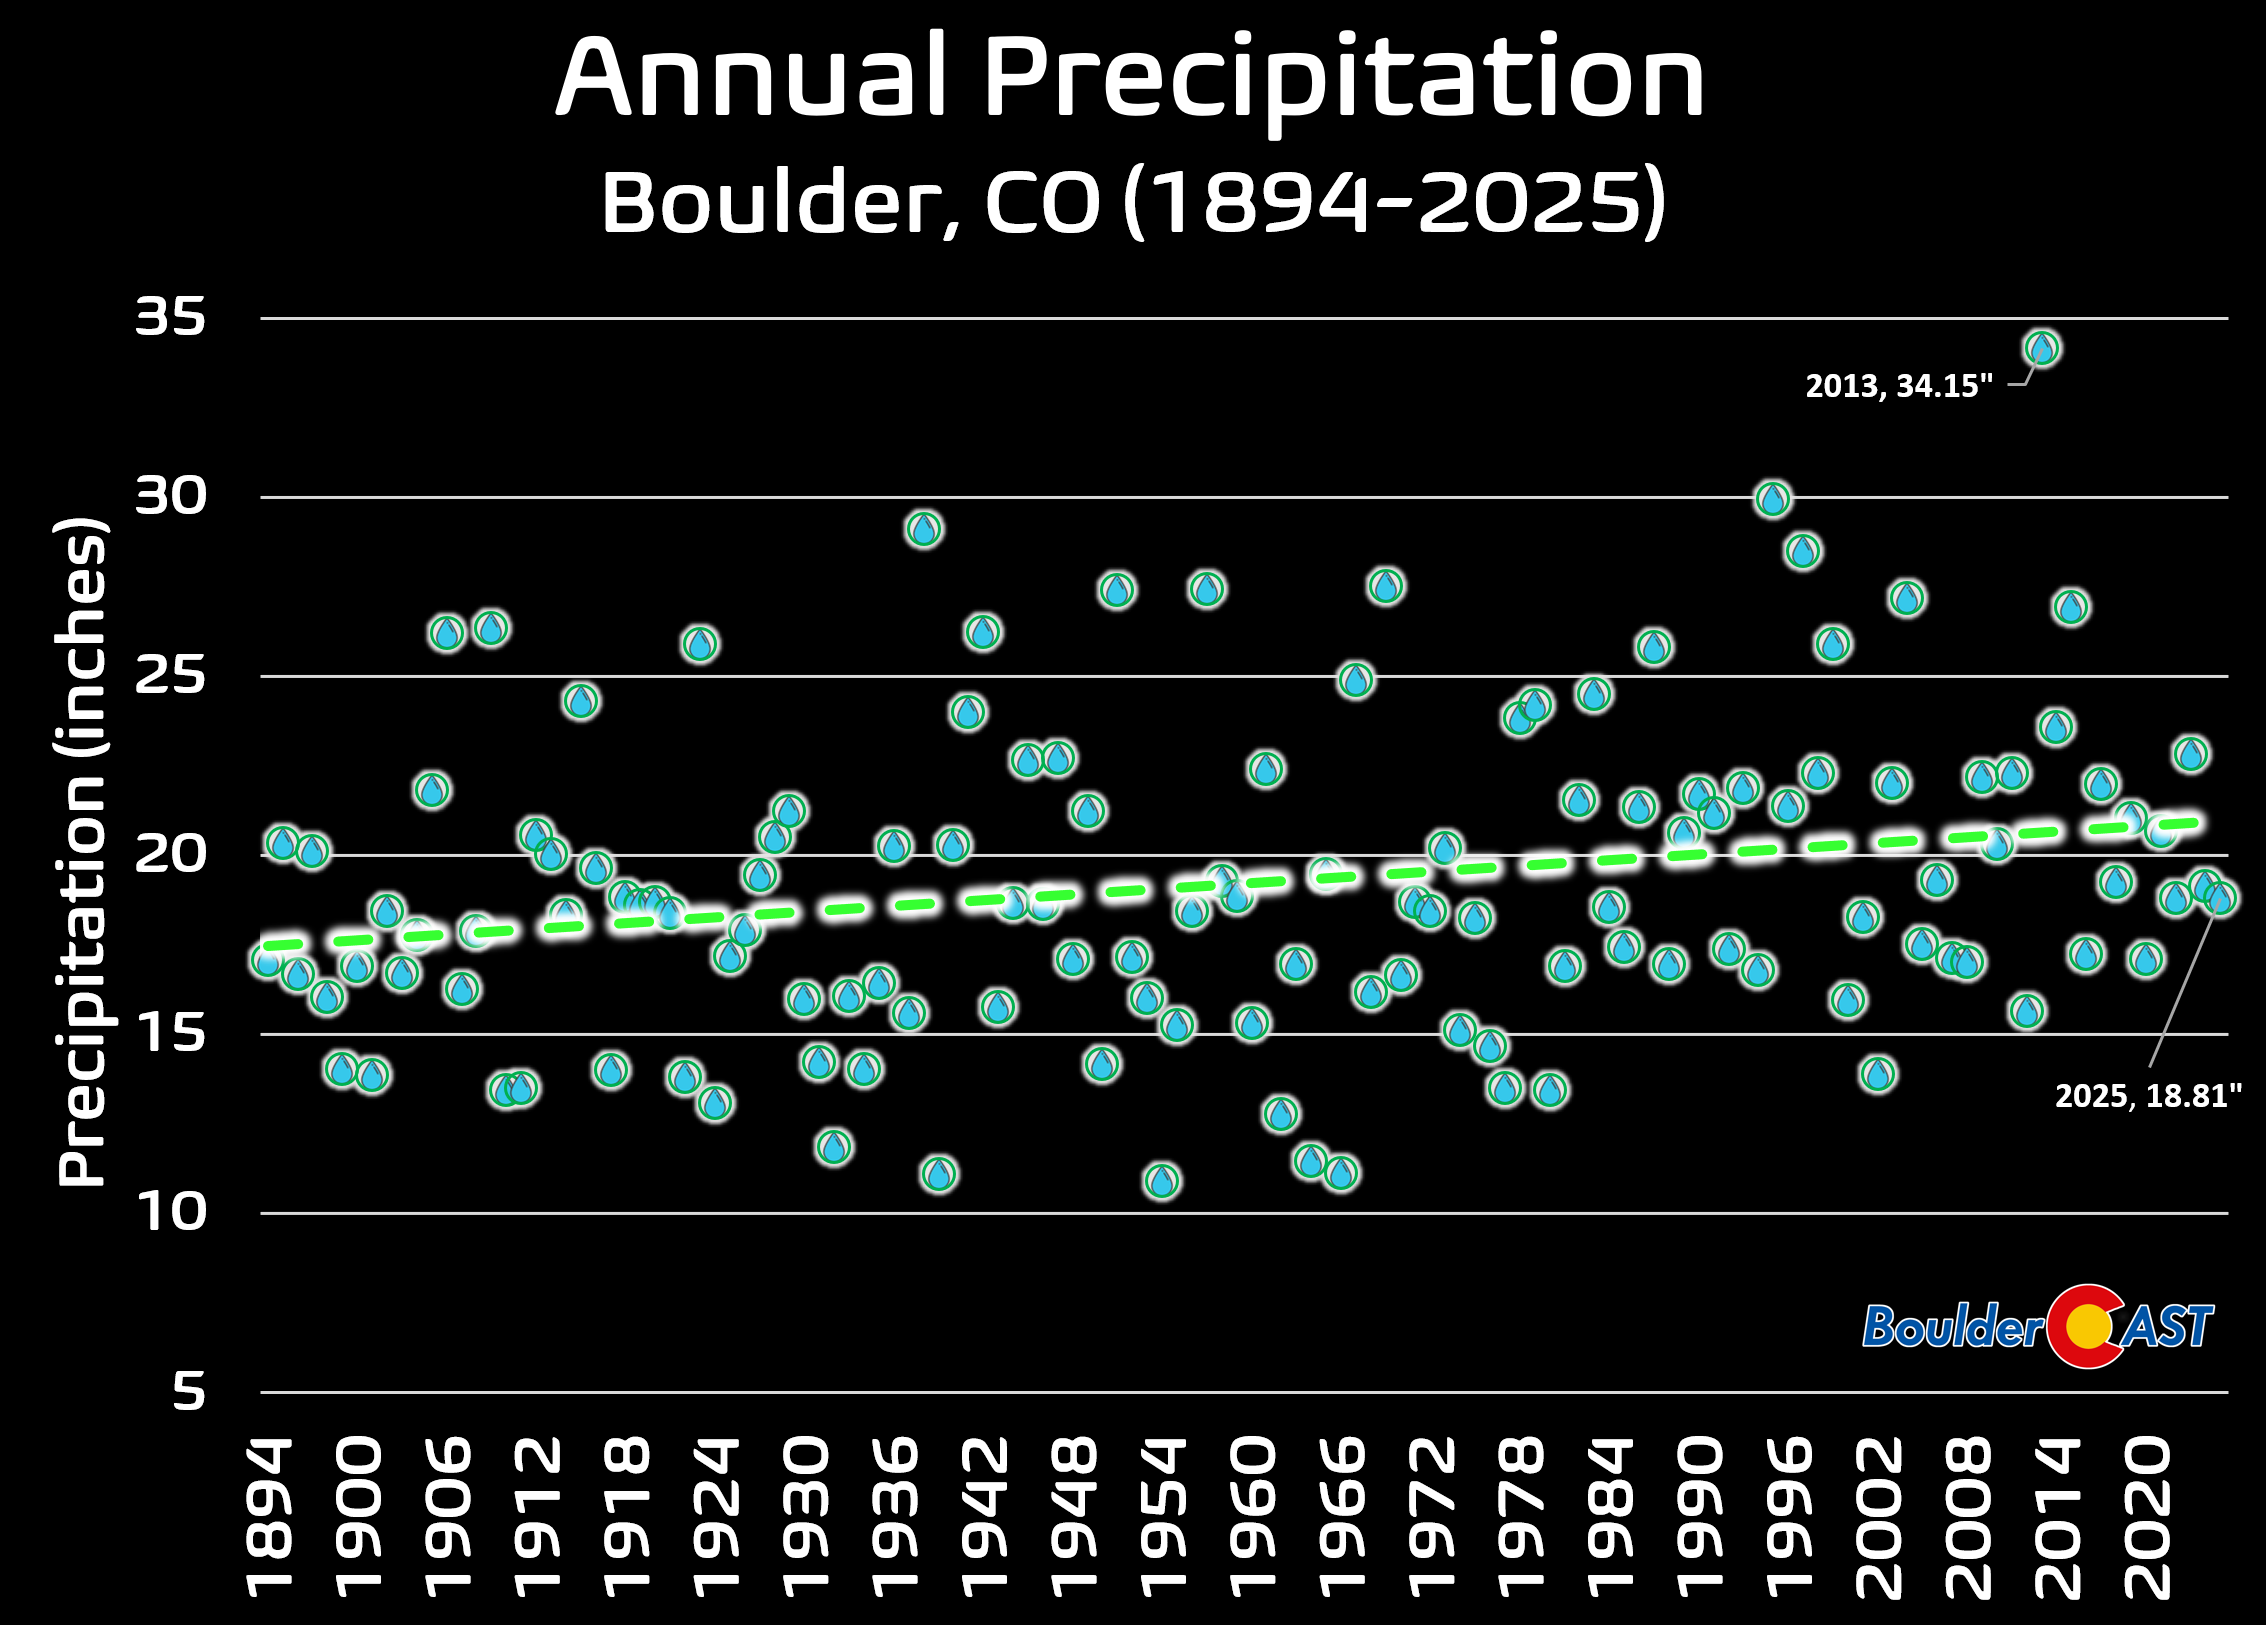
- Precipitation: Rain and melted snow equivalent, using a hot‑water melt method. Two gauges are used—one primary, one backup.
- Temperature: Daily minimum and maximum values.
The official dataset does NOT include:
- Wind: Not recorded at this site and was never part of Boulder’s historical climate observations.
Together these measurements form the backbone of Boulder’s long‑term climate statistics.
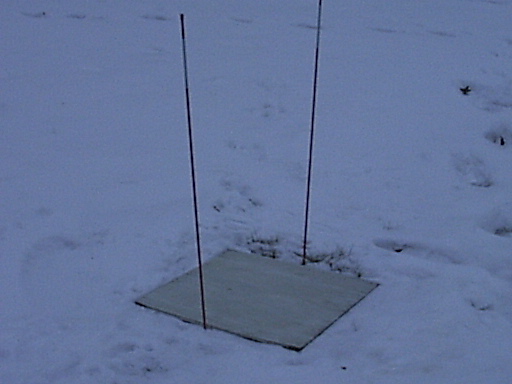
A snow board, use for official snow measurements
Why Boulder doesn’t use its airport as its official climate station now?
Airports seem like the obvious place to stick a weather station—they’re flat, open, and already wired up with instruments for aviation. But for long‑term climate records, “easy” isn’t the goal. Consistency is. Climate data only matters if you can compare today’s numbers to those from decades ago without wondering whether the station’s surroundings changed the story. Moving Boulder’s official site to the Municipal Airport would just add another relocation to a record that’s already had plenty.
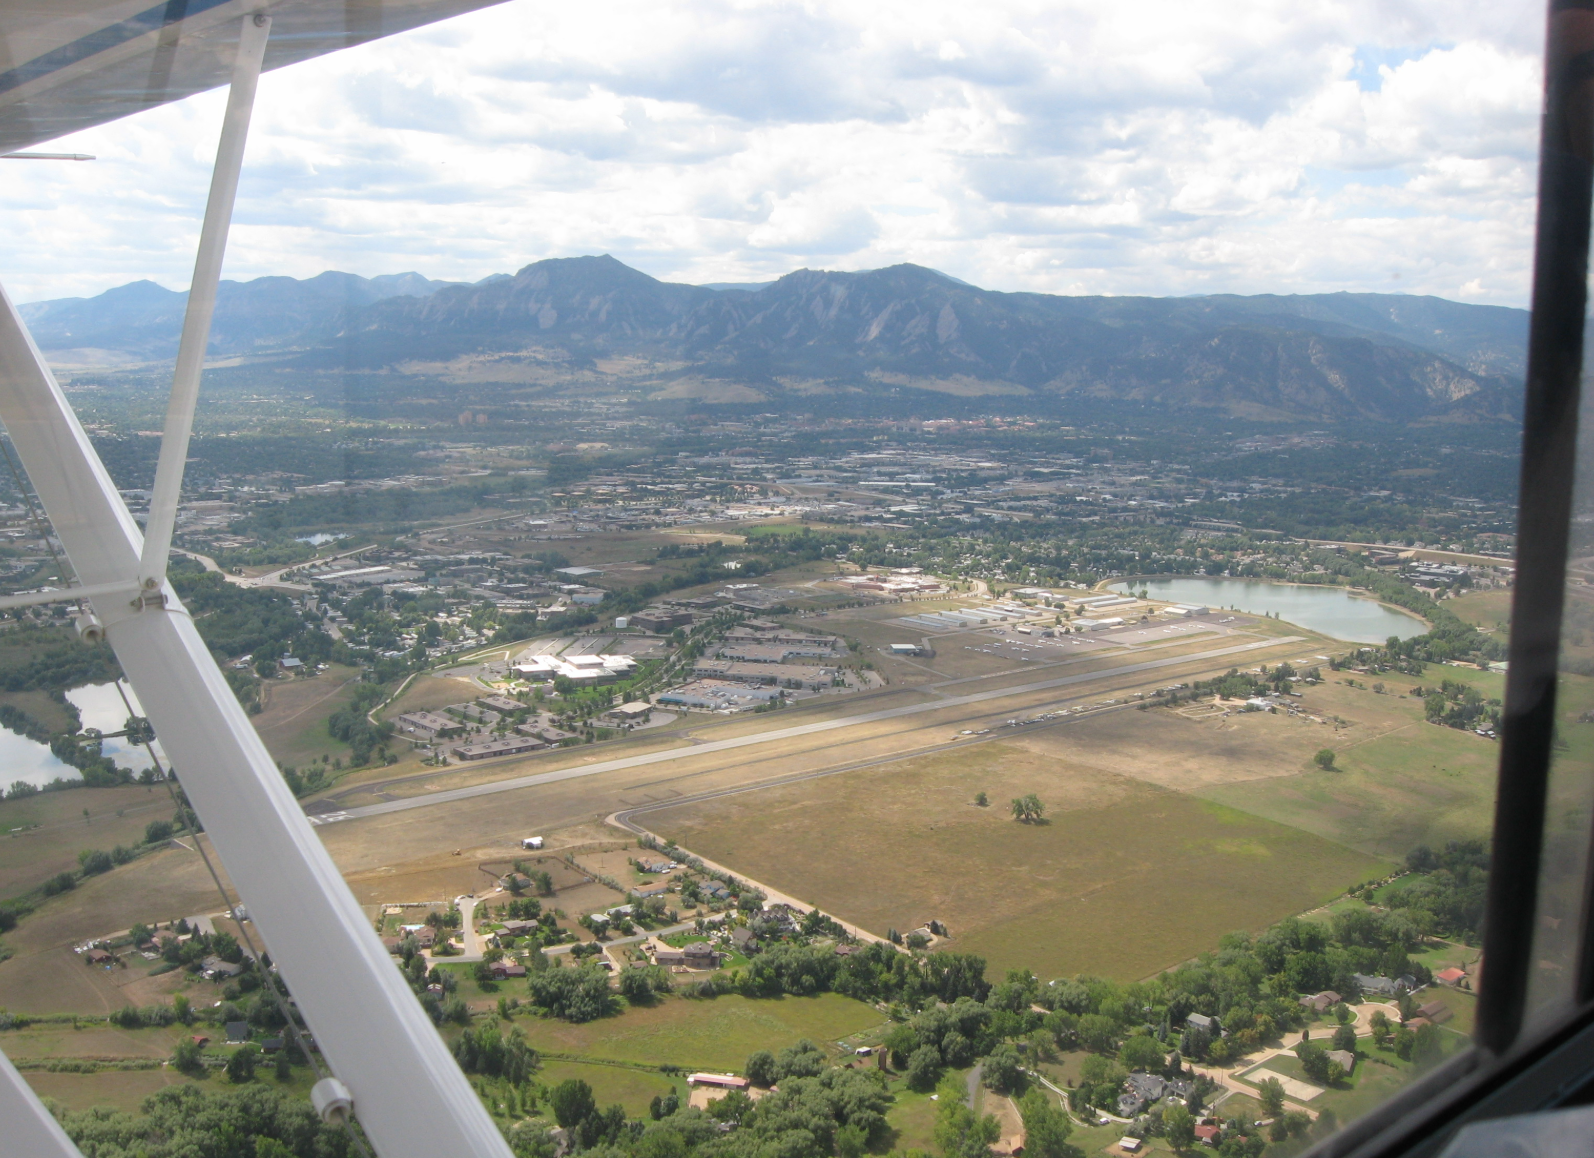
And it wouldn’t just be a new pin on the map—it would be a whole new microclimate. Boulder Municipal Airport sits about 200 feet lower than the NIST site and roughly four miles to the northeast, farther out onto the Plains and away from the Foothills. That shift alone would reshape Boulder’s climate stats yet again:
| Variable | NIST (current site) | Boulder Airport | Impact |
|---|---|---|---|
| Snowfall | Higher due to upslope enhancement | Lower, melts faster | Artificial “decline” in snowfall |
| Nighttime temps | Cooler (most of the time) | Warmer | Artificial warming trend |
| Downslope winds | Stronger | Weaker | Unclear, since wind isn’t officially measured |
| Precipitation | Higher | Slightly lower | Trend discontinuity! |
You’d end up with a dataset that looks like Boulder suddenly warmed, dried out, and lost snowfall—when in reality, the station just moved….again! That’s the last thing we need, especially to move to a location with an uncertain future. Yes, the Boulder Airport would not even be a guaranteed long‑term home: the City of Boulder has repeatedly explored the idea of shutting it down. While it’s still operating today, its future is uncertain—hardly the stable, permanent home a climate station needs.
Accepting Our Varied Climate Record
Boulder’s climate record is a patchwork stitched together from more than a century of moves, microclimates, and evolving technology. Each station location—from downtown rooftops to CU lawns to the more upslope‑influenced NIST site—left its own imprint on the data. Recognizing these shifts doesn’t weaken the record; it strengthens our ability to interpret it. When we understand how the environment around the instruments has changed, we can read Boulder’s long‑term trends with sharper context, better nuance, and a deeper appreciation for the complex story behind every temperature, snowfall, and precipitation statistic.
P.S. If you’re interested in exploring Boulder’s many microclimates further, we highly recommend reading this short BAMS article published by CU atmospheric scientist John Cassano about some of his experiences (and data!) when biking throughout Boulder Valley: Weather Bike: A Bicycle-Based Weather Station for Observing Local Temperature Variations.
Share this content:

Go Premium, get all the perks.
Daily Forecast Updates
Get our daily forecast discussion every morning delivered to your inbox.
All Our Model Data
Access to all our Colorado-centric high-resolution weather model graphics. Seriously — every one!
Ski & Hiking Forecasts
6-day forecasts for all the Colorado ski resorts, plus more than 120 hiking trails, including every 14er.
Smoke Forecasts
Wildfire smoke concentration predictions up to 72 hours into the future.
Exclusive Content
Weekend outlooks every Thursday, bonus storm updates, historical data and much more!
No Advertisements
Enjoy ad-free viewing on the entire site.


You must be logged in to post a comment.