With the Great American Eclipse of 2017 now behind us, we take a look back at the impacts that the moon’s shadow had on our temperature during the once-in-a-lifetime event!
At 11:47 AM late yesterday morning, a peak solar eclipse totality of 94% was reached in the Denver Metro area. While not nearly as awe-inspiring as complete totality, we hope you took the time to experience the eclipse in some fashion. It may very well be Colorado’s best eclipse in your lifetime! The visible satellite animation below from GOES-16 shows the shadow of the moon progressing across the United States.
We had been tracking the forecast for the “moment of peak-totality” for nearly a week now. Despite some initial concerns that high clouds may hamper the viewing in Wyoming and Nebraska, conditions were generally clear region-wide yesterday, especially in northeast Colorado. We even had a nice reprieve from the wildfire smoke (which is unfortunately back today, BTW).
Falling temperatures
One interesting and easily observable change in weather during a solar eclipse is a distinct drop in temperature at ground-level. Temperature changes at the surface are controlled mostly by the local energy balance. We warm up during the day because the ground is absorbing a HUGE amount of solar energy from the sun. Temperatures drop at night because the sun is gone and the energy balance turns negative due to infrared emission from the ground (radiative cooling).
The shadow of the moon causes a rapid shift in this energy balance, removing a large portion of the sun’s energy reaching the ground (or all, for a total solar eclipse). The temperature drop during the eclipse is maximized when skies are clear, winds are light, and the water vapor content of the air is low.
The graphic below shows the observed temperature changes at BoulderCAST Station during the eclipse.
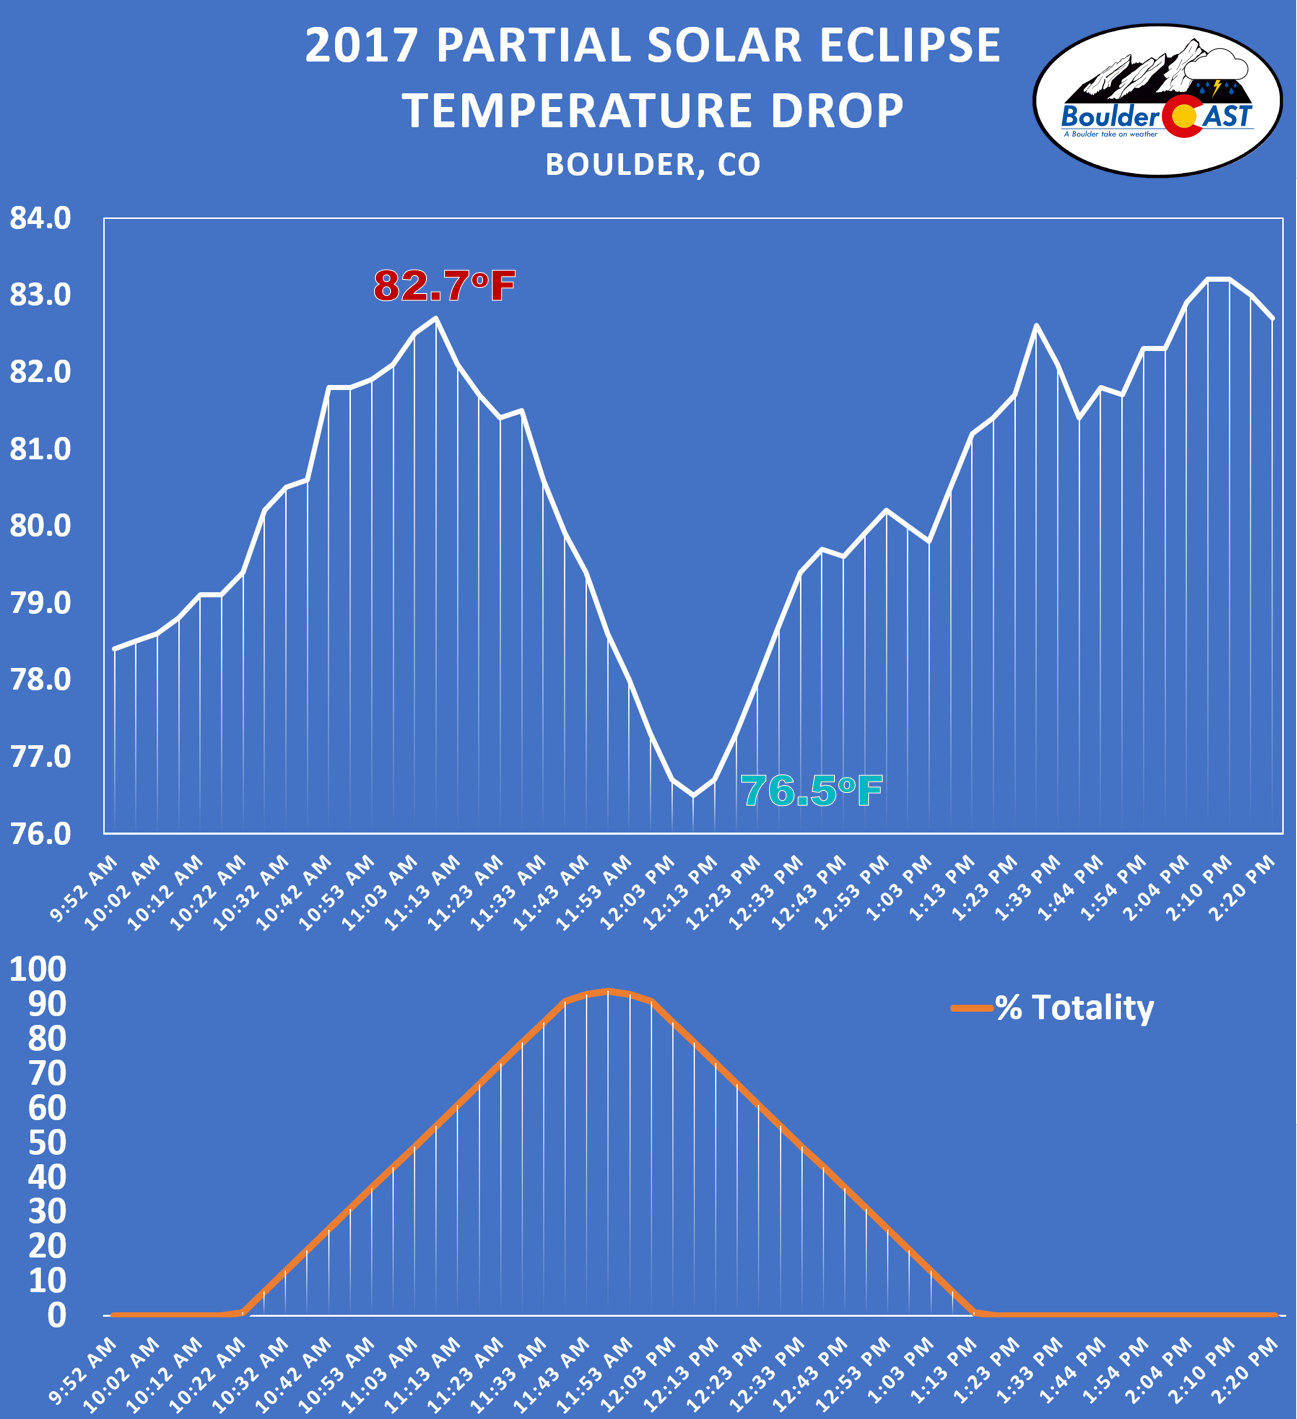
A few things to point out:
- The temperature continued to increase up until about 60% totality was reached, peaking at 82.7 degrees at 11:13 AM. This is approximately the solar blockage needed to shift the energy balance negative and begin the cooling process
- Over the next hour, the temperature sharply declined 6.2 degrees as the moon blocked out up to 94% of the solar disk
- The minimum temperature observed was 76.5 degrees at 12:13 PM. This time was approximately 25 minutes AFTER the peak of the eclipse and was at about 80% totality. Again, this is the point when the energy balance reverted to being positive (as it typically is in the middle of a sunny Front Range day!). The time lag is due to the continued negative energy balance, even after peak totality is reached.
- The energy balance reversal does not occur at the same totality percentage (before peak and after peak totality) because of the changing angle of the sun. These observations show that a 60% obstructed sun at 11:13 AM is roughly energy-equivalent to an 80% obstructed 12:13 PM sun (which is higher in the sky).
Denver International Airport experienced a slightly larger temperatures drop than we measured during the eclipse, plummeting from 85 to 77 degrees over the course of the eclipse (an 8 degree drop).
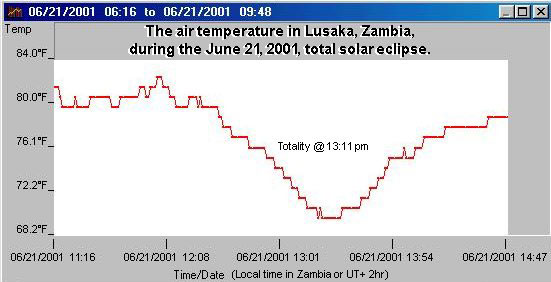
Though high-resolution weather observations haven’t overlapped with total solar eclipses all that frequently in human history, it is believed a temperature drop of up to 15 degrees is possible beneath a total solar eclipse…you just need ideal conditions (clear skies, calm winds, minimal water vapor, lower latitudes). The graphic below is from a total solar eclipse that passed over southern Africa in June of 2001. An observed temperature drop of 13 degrees was recorded in Lusaka, Zambia.
Back to Colorado… The graph below shows a time series of solar irradiance (sunlight energy) from an instrument called a pyranometer located at the University of Colorado. This instrument measures solar radiation from the entire sky reaching the ground. The large dip just before 18:00 UTC (equivalent to 12PM Mountain Time) is the eclipse.
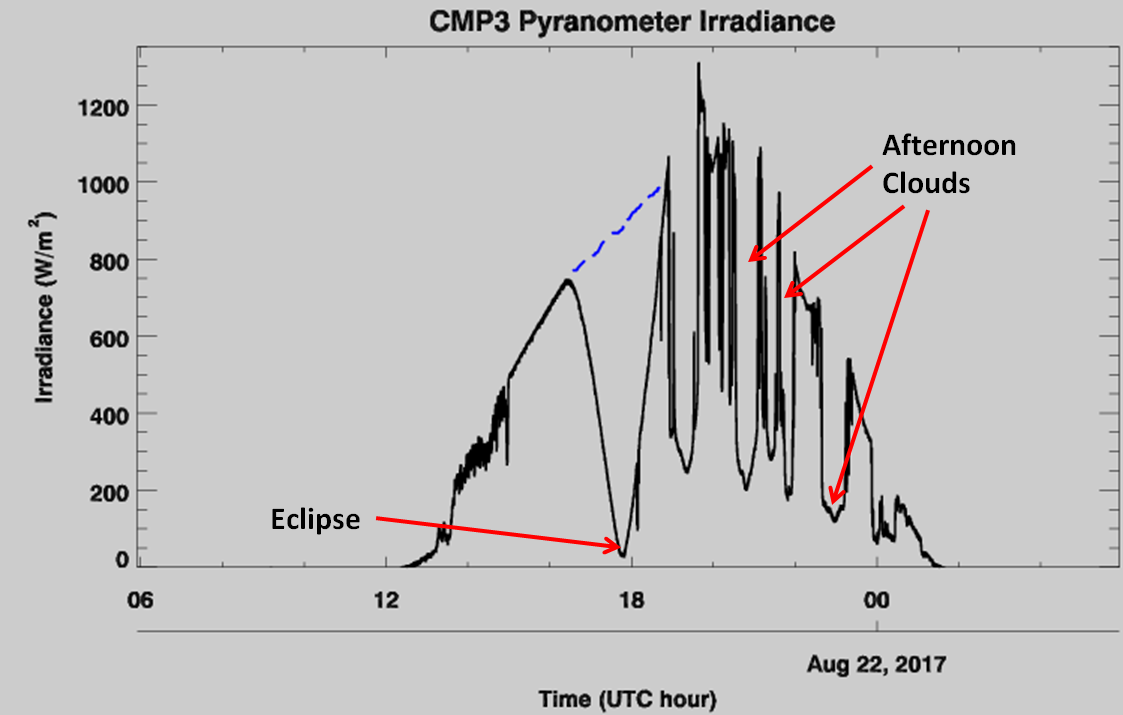
Pyranometer data showing the drop in solar irradiance during the eclipse in Boulder, CO. Data compliments of the Skywatch Observatory and the University of Colorado Department of Atmospheric and Oceanic Sciences.
At peak totality, solar irradiance dropped to just 40 W/m2. Compare this value on the graph to the 100 to 300 W/m2 that was observed as dark storm clouds passed over Boulder later in the afternoon. Though the consensus from many was that our eclipse was underwhelming, 40 W/m2 of solar energy at noon in August is remarkable!
One final note…..
The graph below shows the data from the same instrument from this past Friday, a day with almost no clouds across the Front Range. It shows that normal solar irradiance at 11:47 AM this time of year is about 870 W/m2. With only 40 W/m2 reaching the ground during the peak of the eclipse, this means 830 W/m2 was being obstructed by the moon. Assuredly, this equates to ~95% blockage (830 ÷ 870). The data matches quite well with the anticipated 94% eclipse.
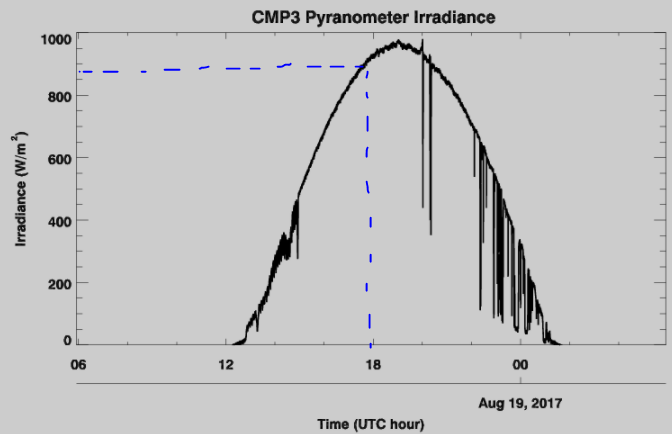
Pyranometer data from August 18, 2017 in Boulder, CO (a mostly sunny day). Data compliments of the Skywatch Observatory and the University of Colorado Department of Atmospheric and Oceanic Sciences.
Did you venture northward to experience 100% totality? What was the coolest part for you? Share you thoughts from the solar eclipse with us in the comments!
Share this awesome content!


Great post!
The temperature drop was really shocking for our group in Wyoming. Using a hand-held digital thermometer near Laramie Peak, WY, I measured a drastic temperature drop down to 63 deg F which rose up to 82 F after the eclipse. Unfortunately, I didn’t get a baseline measurement prior to the eclipse first contact. Next time, I will need to bring a data logger for my thermometer 🙂
I was curious what my personal weather station in the Boulder foothills measured during the partial eclipse, and it looks very similar to yours except that my station was shadowed by a nearby tree shortly after the eclipse.
As always, thanks for the great work and observations! https://uploads.disquscdn.com/images/209bea5f4bd81889ac19cac0c7b44c622e23cd23797648abe6456c4db713d350.png
Wow that is an impressive drop. I hadn’t got around yet to investigating what other types of drops were reported countrywide from the eclipse. I am sure there will be a few journal articles published about it in due time. I know CU/NOAA took out a bunch of instrumentation to Wyoming for the event, at least.
Great plot, Pat. I am curious why your max temperature correlated so closely to peak solar radiation pre-eclipse. As soon as the eclipse started, your temperatures began to drop immediately. There must have been something else at your place contributing to local cooling. Maybe it was breezier?