
The first high wind event of the “winter” season is upon us. We touch on why these type of downslope events happen, and provide details on the timing and intensity of the strongest winds.
Category: Forecasting 101 (Page 2 of 2)
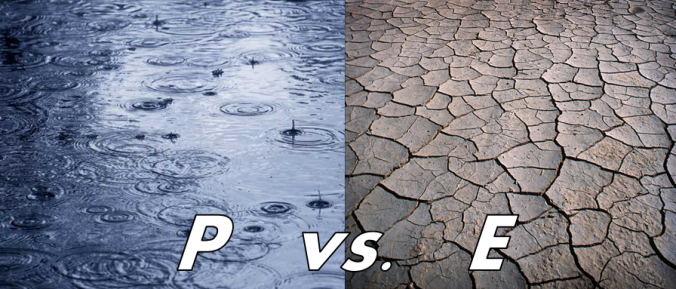
On a basic level, you’re likely familiar with the terms precipitation and evaporation. However, their relationship to one another is more important than you may think for Colorado. We explain this relationship and why it has major impacts on our plant life, population sustainability, drought potential, and even feeds back into our every day weather.
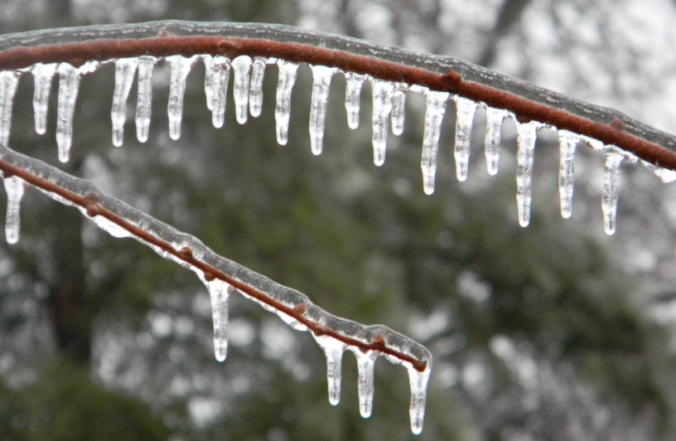
Yesterday saw a mix of wintry precipitation fall across the Denver Metro area. Snow pellets and snowflakes were observed in spots, but closer to the Foothills near Boulder, freezing drizzle produced a dangerous glaze of ice that was responsible for numerous car accidents (and probably many pedestrian slips and falls). We explain the rare weather set-up the led to the somewhat unexpected occurrence of ice in Boulder.
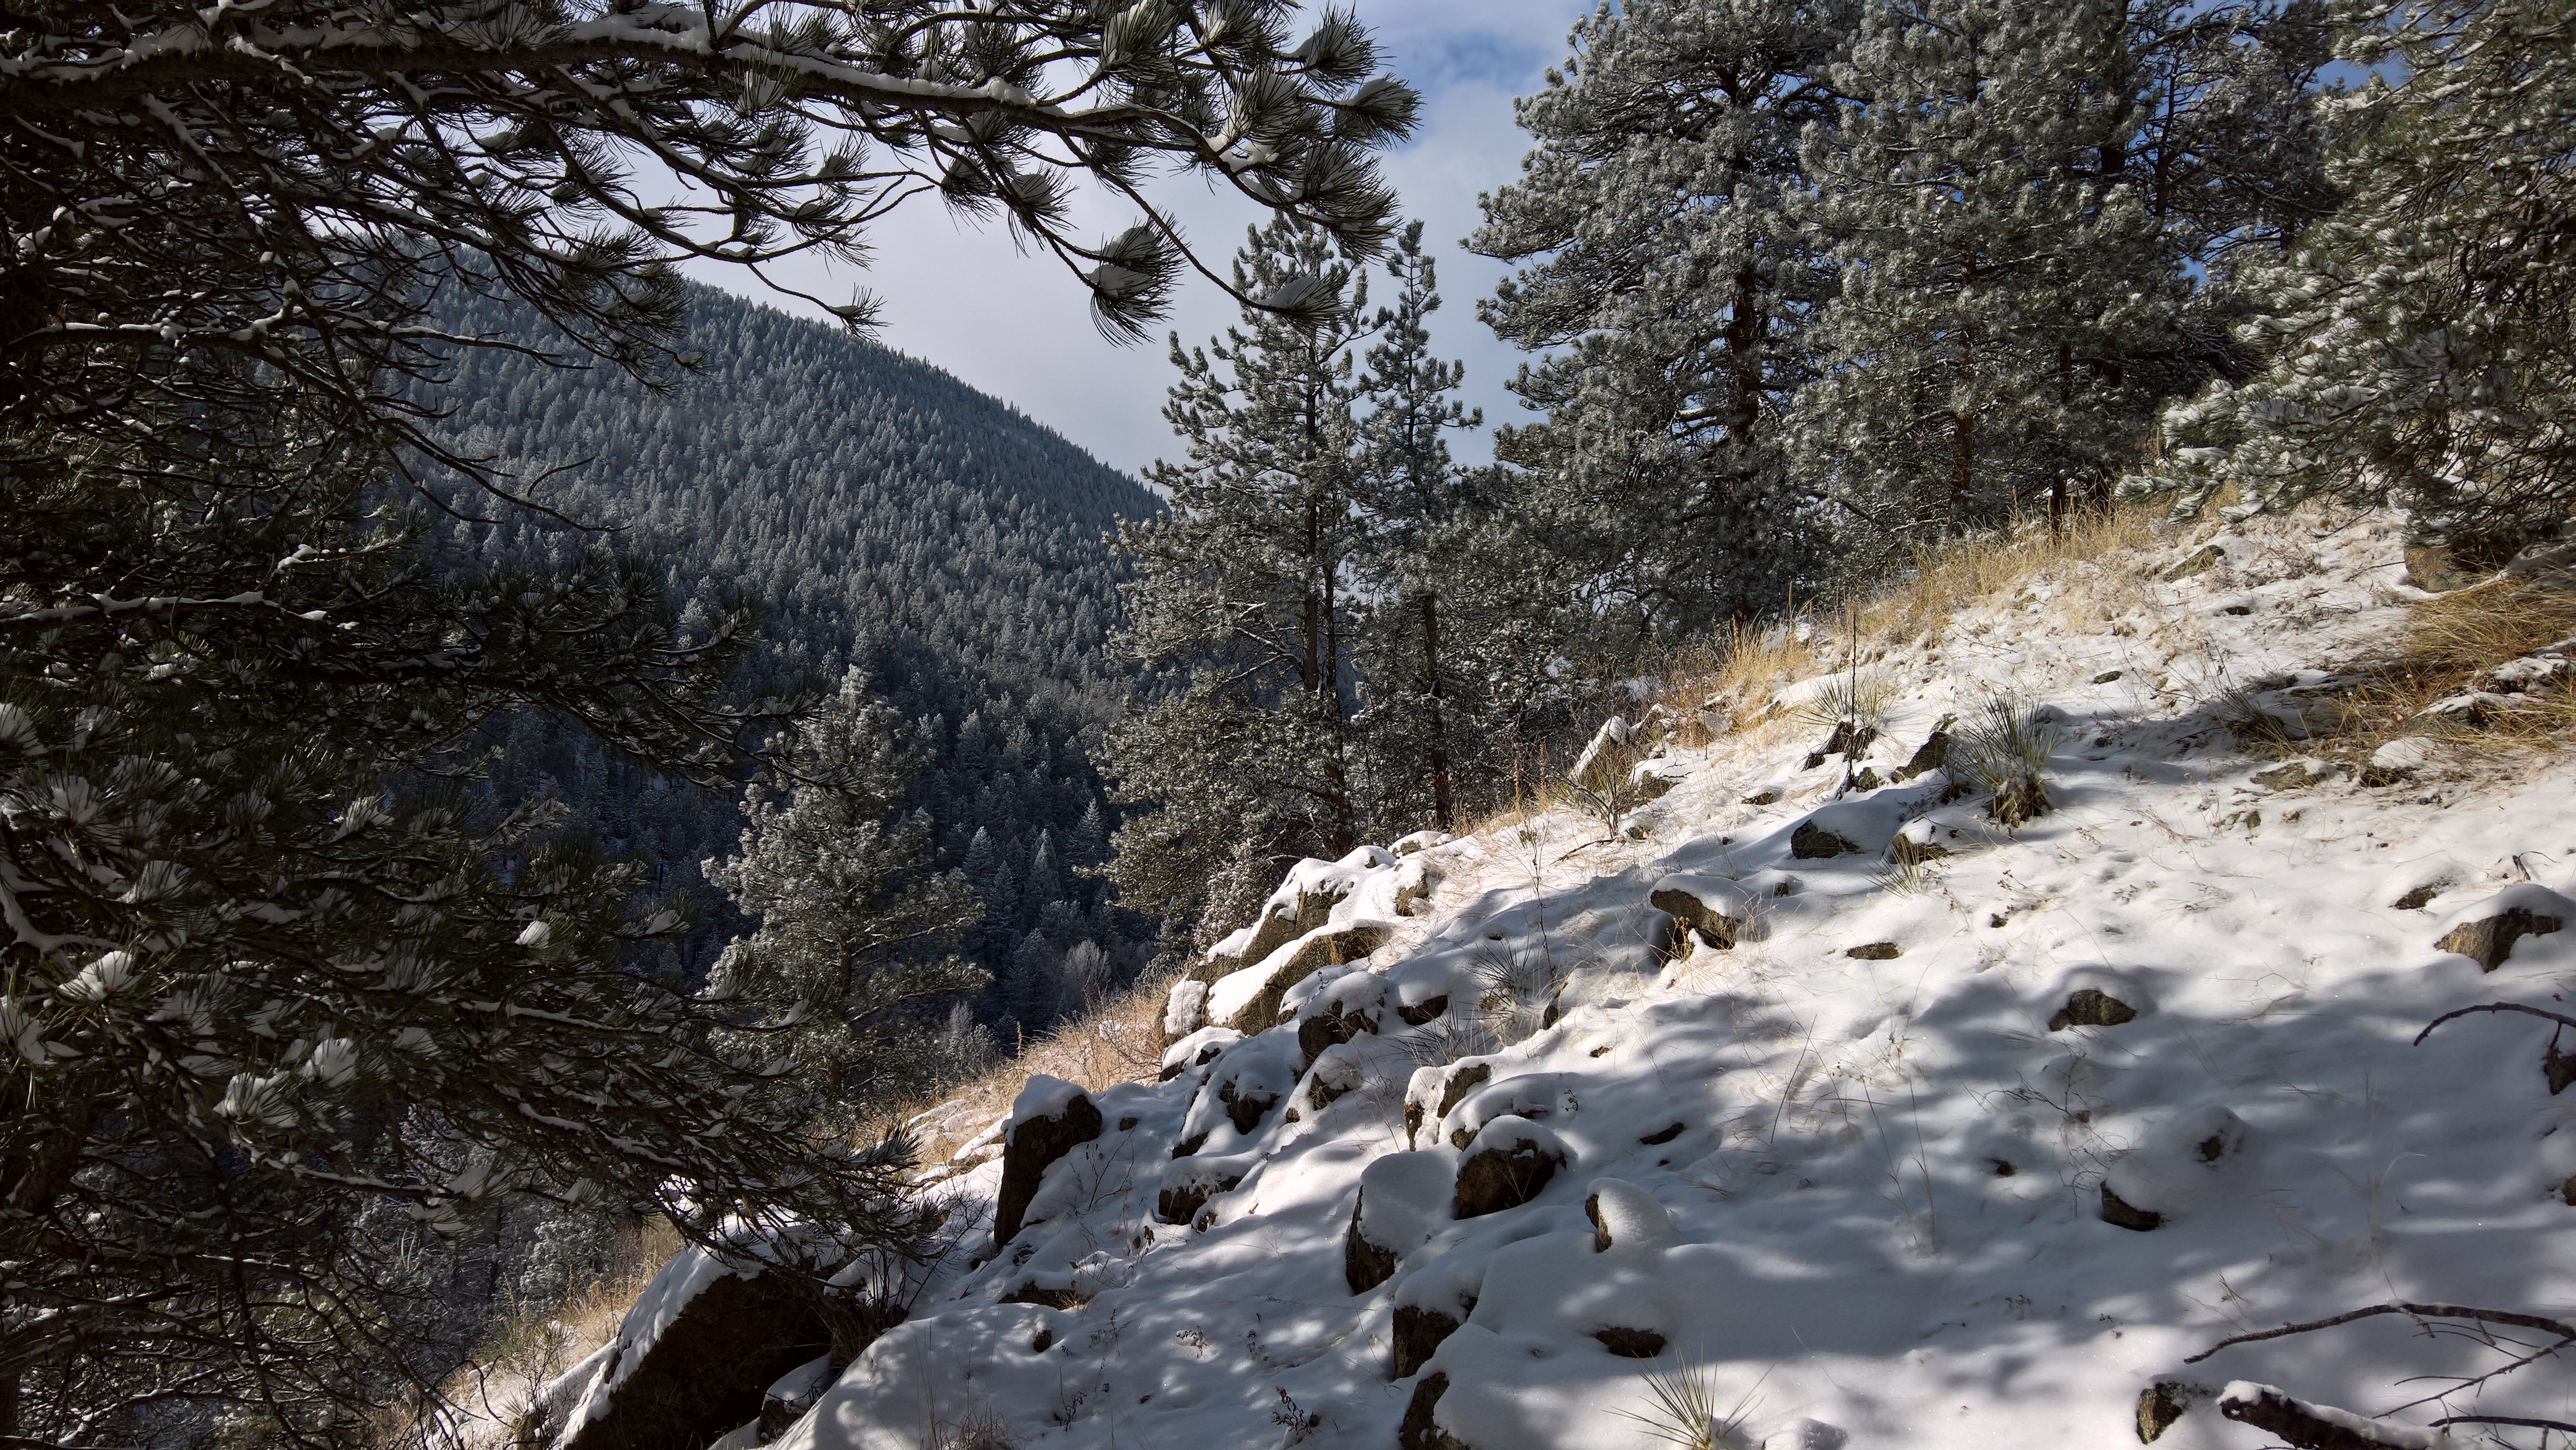
After a lengthy cold stretch which brought more snow to Colorado and other parts of the country, this week we are in store for moderating temperatures, with the potential for low 50’s come Wednesday, all thanks to the heart of the cold air retreating back to Canada and the Northeast. Colder weather and the potential for snow returns late Friday and for the upcoming weekend. What are the specifics for the week? Read on to find out more!
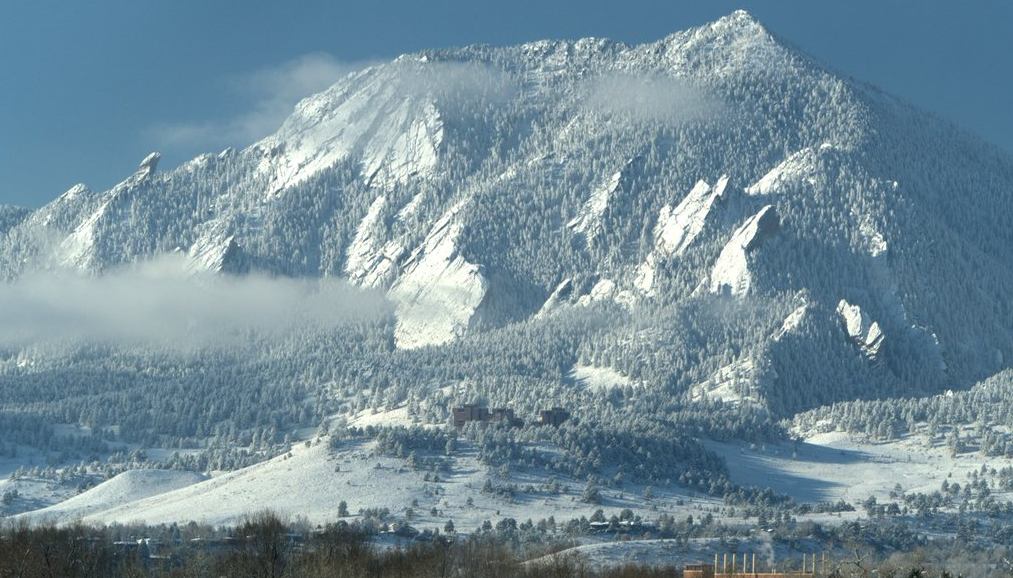
More than thirty-six hours after the snow has settled on the surprise storm of the year (and quite possibly the decade?) for the Denver Metro area, we explain what went through the minds of the forecasters in the hours leading up to the storm, what likely led to the storm’s deviation from initial forecasts, and recap snowfall totals from across the Front Range.
We show a lot of model forecast maps here at BoulderCAST. They offer much more than just pretty colors. Complex weather models, like the GFS and Euro, generate staggering amounts of data in four dimensions (3-D space, plus time) for the entire Earth. Interpreting all that data to make an accurate forecast is a bit like piecing a puzzle together…while blindfolded, and without thumbs. Weather maps allow forecasters to visualize the model data in focused and convenient ways, making them our best tool. We briefly discuss how to first approach these maps.

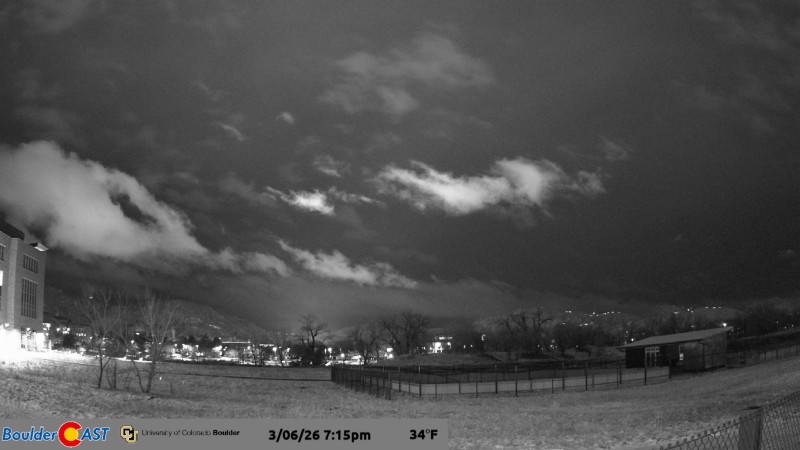
Live View of Boulder
Current Conditions

Live Radar

Latest Smoke Forecast
Recent Premium Posts

BoulderCAST Daily – Sun 08/02/26 | The Front Range Braces for a 100° Doubleheader
🔥 Record Heat — A dominant ridge over the Desert Southwest drives temps …
BoulderCAST Daily – Sat 08/01/26 | Hot Temperatures Build This Weekend
🌡️ Dangerous Heat and Air Quality — Boulder and Denver return to triple …
BoulderCAST Daily – Fri 07/31/26 | Marginal Risk of Severe Storms with Smoke and Haze
🌧️ Isolated Storms — This afternoon and evening, with a marginal risk of …
3-Day Forecast

Trending Content
© 2026 Front Range Weather, LLC
You must be logged in to post a comment.