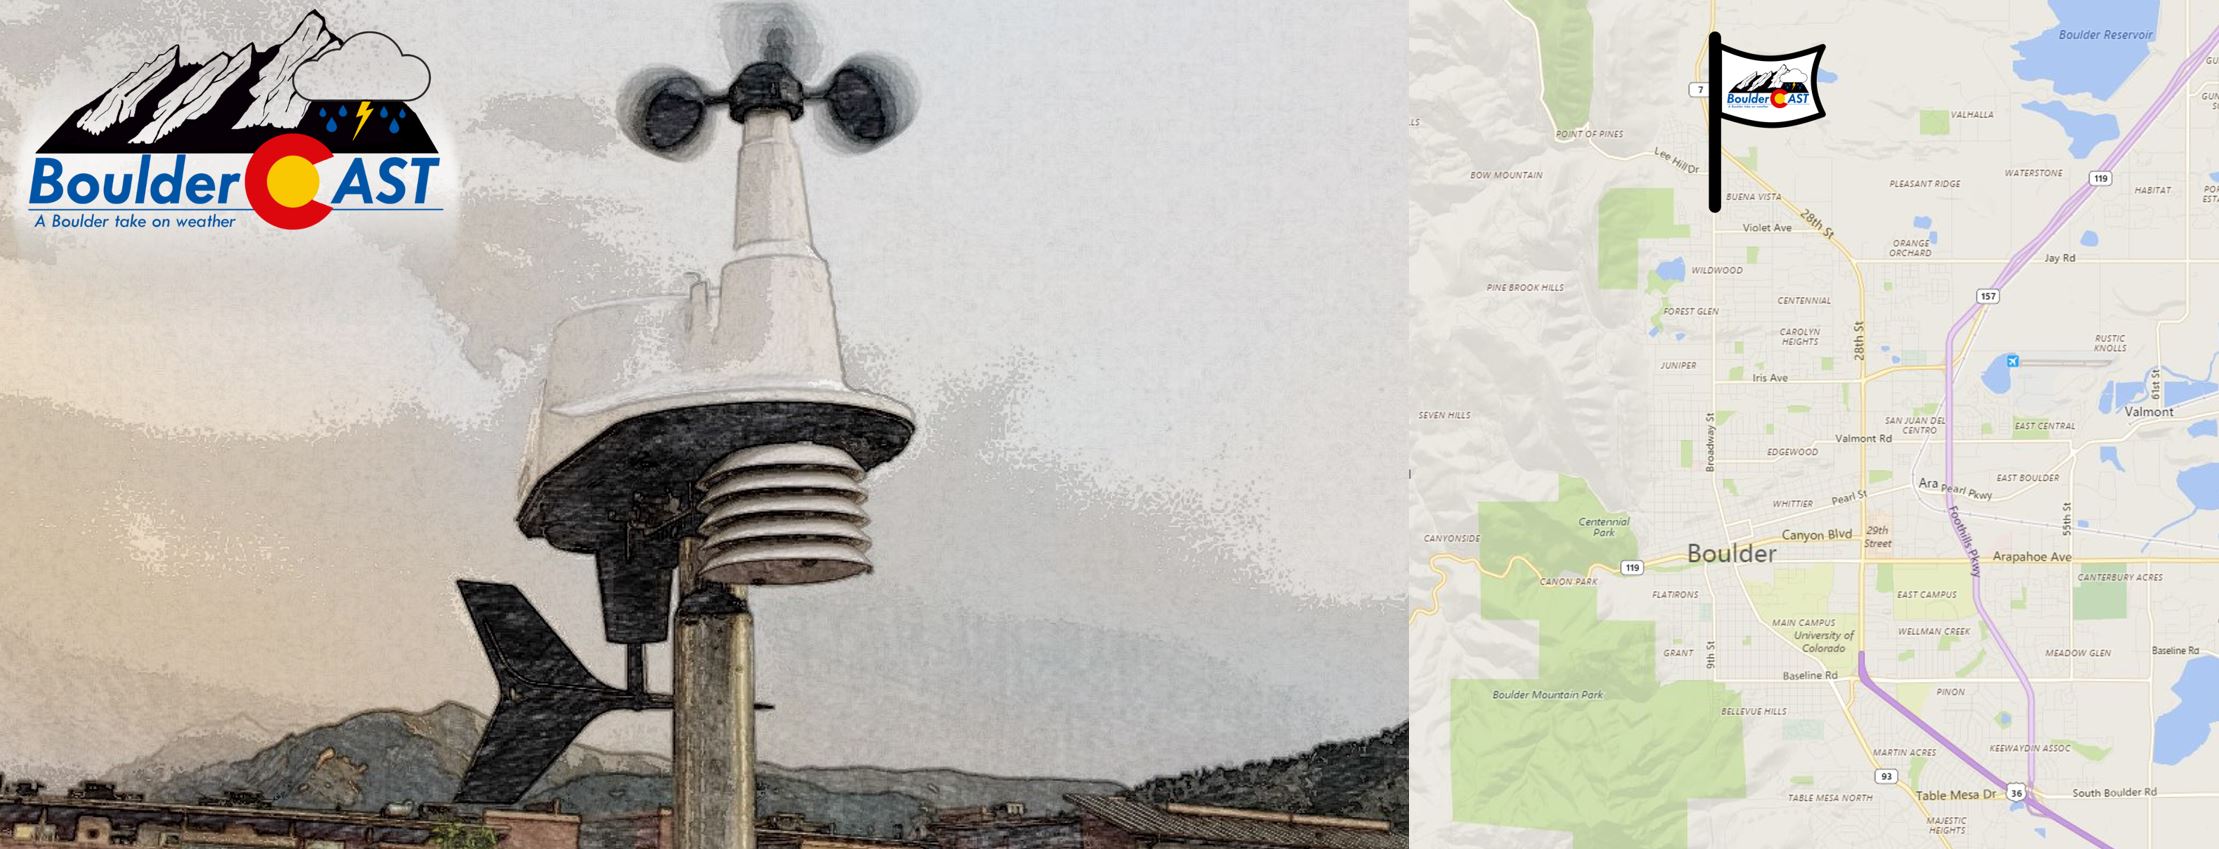
BoulderCAST Station, Boulder, CO
This page contains an index of weather observations taken at the BoulderCAST weather station. Click your month of interest below to bring up the page containing the corresponding daily data.

The BoulderCAST Weather Station has been in operation since early 2015 in North Boulder, situated at an elevation of 5,550 feet.
2017
| Month | Avg High | Avg Low | Mean T (Anomaly) | Max High | Min Low | Avg Dew T | Precip (Anomaly) | Snow | Avg Peak Gust |
|---|---|---|---|---|---|---|---|---|---|
| Jan | 44 | 23 | 33 (-2) | 62 | 0 | 17 | 1.32 (+0.59) | 18.3 | 16 |
| Feb | 54 | 32 | 43 (+8) | 75 | 12 | 20 | 0.76 (-0.07) | 7.7 | 19 |
| Mar | 64 | 36 | 50 (+7) | 84 | 22 | 25 | 1.25 (-0.89) | T | 14 |
| Apr | 64 | 37 | 50 (+1) | 79 | 25 | 30 | 2.54 (-0.32) | 12.2 | 18 |
2016
Click to expand this data table
| Month | Avg High | Avg Low | Mean T (Anomaly) | Max High | Min Low | Avg Dew T | Precip (Anomaly) | Snow | Avg Peak Gust |
|---|---|---|---|---|---|---|---|---|---|
| Jan | 46 | 25 | 35 (0) | 65 | 11 | 18 | 0.50 (-0.23) | 6.8 | 12 |
| Feb | 55 | 30 | 41 (+6) | 73 | 12 | 19 | 1.43 (+0.60) | 22.2 | 19 |
| Mar | 57 | 33 | 44 (+1) | 74 | 20 | 23 | 3.86 (+1.72) | 30.9 | 15 |
| Apr | 62 | 39 | 50 (+1) | 81 | 25 | 31 | 3.27 (+0.41) | 19.8 | 15 |
| May | 67 | 44 | 55 (-2) | 82 | 30 | 39 | 2.69 (-0.11) | 0.9 | 13 |
| Jun | 88 | 60 | 73 (+6) | 104 | 48 | 48 | 1.05 (-1.09) | 0 | 13 |
| Jul | 91 | 63 | 76 (+4) | 100 | 57 | 48 | 0.67 (-1.11) | 0 | 16 |
| Aug | 86 | 58 | 72 (0) | 96 | 46 | 46 | 1.11 (-0.72) | 0 | 15 |
| Sep | 81 | 53 | 66 (+3) | 93 | 40 | 41 | 0.59 (-1.09) | 0 | 13 |
| Oct | 75 | 46 | 59 (+7) | 87 | 32 | 30 | 0.50 (-1.02) | 0 | 15 |
| Nov | 61 | 37 | 48 (+7) | 80 | 20 | 23 | 0.49 (-0.79) | 2.3 | 12 |
| Dec | 44 | 19 | 32 (-2) | 68 | -4 | 15 | 0.75 (-0.15) | 10.8 | 18 |
Click to collapse this data
2015
Click to expand this data table
| Month | Avg High | Avg Low | Mean T (Anomaly) | Max High | Min Low | Avg Dew T | Precip (Anomaly) | Snow | Avg Peak Gust |
|---|---|---|---|---|---|---|---|---|---|
| Jul | 86 | 60 | 72 (0) | 97 | 54 | 50 | 2.86 (+1.12) | 0 | 16 |
| Aug | 88 | 60 | 73 (+2) | 99 | 46 | 47 | 0.46 (-1.37) | 0 | 15 |
| Sep | 84 | 57 | 69 (+6) | 92 | 45 | 40 | 0.25 (-1.43) | 0 | 14 |
| Oct | 69 | 47 | 56 (+5) | 89 | 32 | 38 | 2.52 (+1.00) | 0 | 10 |
| Nov | 53 | 30 | 40 (-1) | 76 | 11 | 22 | 2.17 (+0.89) | 9.6 | 14 |
| Dec | 45 | 26 | 34 (0) | 67 | 9 | 17 | 1.14 (+0.24) | 18.2 | 16 |
Click to collapse this data

You must be logged in to post a comment.